Cover Page
The handle
http://hdl.handle.net/1887/40117
holds various files of this Leiden University
dissertation.
Author: Fagginger Auer, M.F.
Title: Solving multiplication and division problems: latent variable modeling of students'
solution strategies and performance
Solving multiplication and division problems
Latent variable modeling of students’ solution strategies
Fagginger Auer, Marije F.
Solving multiplication and division problems:
Latent variable modeling of students’ solution strategies and performance Copyright c2016 by Marije Fagginger Auer
Cover design by Joran A. Kuijper Printed by Ridderprint BV
All rights reserved. No part of this book may be reproduced, stored in a retrieval system, or transmitted, in any form or by any means, electronically, mechanically, by
photocopy, by recording, or otherwise, without prior written permission from the author.
Solving multiplication and division problems
Latent variable modeling of students’ solution strategies
and performance
PROEFSCHRIFT
ter verkrijging van de graad van doctor aan de Universiteit Leiden, op gezag van de Rector Magnificus prof. mr. C. J. J. M. Stolker,
volgens besluit van het College voor Promoties te verdedigen op woensdag 15 juni 2016
klokke 16.15 uur
Promotor:
prof. dr. W. J. Heiser
Copromotores:
dr. C. M. van Putten (Universiteit Leiden) dr. M. Hickendorff (Universiteit Leiden)
dr. A. A. B´eguin (Cito Instituut voor Toetsontwikkeling)
Promotiecommissie:
prof. dr. M. E. J. Raijmakers (Universiteit van Amsterdam) prof. dr. M. J. de Rooij (Universiteit Leiden)
dr. S. H. G. van der Ven (Universiteit Utrecht) prof. dr. L. Verschaffel (KU Leuven)
Acknowledgement:
Contents
List of Figures vi
List of Tables vi
1 General introduction 1
1.1 Solution strategies in cognitive psychology . . . 2
1.2 Solution strategies in mathematics education . . . 4
1.3 Contents of this dissertation . . . 7
2 Multilevel latent class analysis for large-scale educational assess-ment data: Exploring the relation between the curriculum and students’ mathematical strategies 11 2.1 Introduction . . . 11
2.2 Method . . . 18
2.3 Results . . . 22
2.4 Discussion . . . 28
3 Using LASSO penalization for explanatory IRT: An application on covariates for mathematical achievement in a large-scale as-sessment 33 3.1 Introduction . . . 33
3.2 Method . . . 41
3.3 Results . . . 45
3.4 Discussion . . . 49
3.A Teacher survey questions . . . 52
vi CONTENTS
4 Solution strategies and adaptivity in multidigit division in a
choice/no-choice experiment: Student and instructional factors 57
4.1 Introduction . . . 57
4.2 Method . . . 63
4.3 Results . . . 66
4.4 Discussion . . . 71
5 Affecting students’ choices between mental and written solution strategies for division problems 77 5.1 Introduction . . . 77
5.2 Method . . . 82
5.3 Results . . . 88
5.4 Discussion . . . 95
5.A Student questionnaire . . . 99
5.B Teacher questionnaire . . . 100
6 Single-task versus mixed-task mathematics performance and strat-egy use: Switch costs and perseveration 103 6.1 Introduction . . . 103
6.2 Method . . . 107
6.3 Results . . . 111
6.4 Discussion . . . 113
7 General discussion 117 7.1 Substantive conclusions . . . 118
7.2 Methodological conclusions . . . 121
7.3 Future directions . . . 123
References 127 Nederlandse samenvatting 141 Opzet van dit proefschrift . . . 143
Bevindingen . . . 144
Dankwoord 149
List of Figures
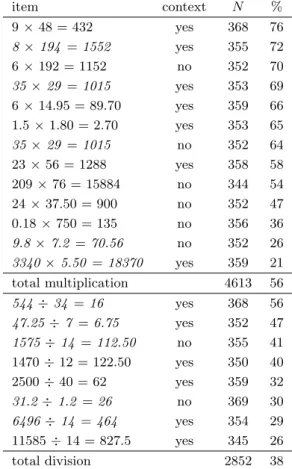
1.1 Use of the different multiplication and division strategies on the assess-ments in 1997, 2004 and 2011 (percentage correct per strategy in 2011 is given between brackets). The lines are broken because the items that are compared for 1997 and 2004 are different from those compared for 2004 and 2011. . . 8 3.1 Penalized regression coefficients and BICs for the different settings of
λ in the LASSO penalized IRT model (dashed vertical line at optimal
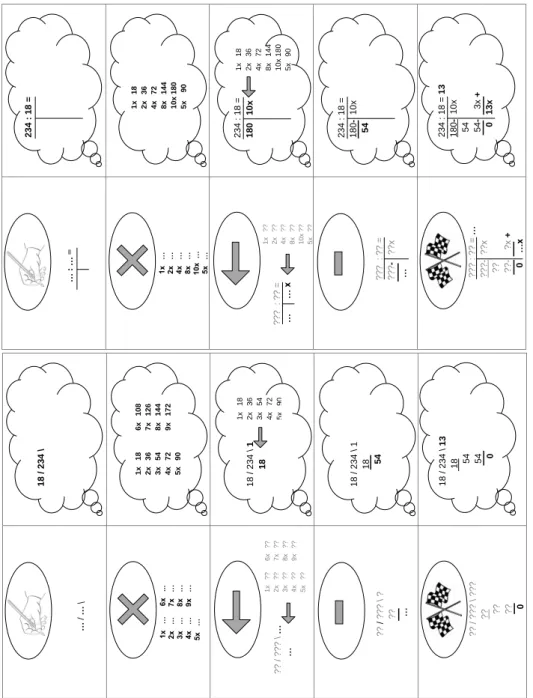
λ= 35). . . 47 5.1 The step-by-step plans (the lower one for students using the digit-based
algorithm, and the upper one for students using the whole-number-based algorithm). . . 85
List of Tables
1.1 Examples of written work for different multiplication and division strate-gies for the problems 23×56 and 544÷34. . . 6
viii List of Tables 2.1 Examples of the digit-based algorithms, whole-number-based algorithms,
and non-algorithmic strategies applied to the multiplication problem 23×56 and the division problem 544÷34. . . 15 2.2 The content of the thirteen multidigit multiplication problems and eight
multidigit division problems in the assessment, and the strategy use frequency on each item. . . 19 2.3 Fit statistics for the non-parametric and parametric multilevel latent
class models. . . 23 2.4 The mean probabilities of choosing each of the six strategies for the
multiplication and division problems for each latent class. . . 24 2.5 The latent student class probabilities in each of the four latent teacher
classes. . . 25 2.6 Fit statistics for the latent class models with successively added predictors. 26 2.7 Students’ probabilities of membership of the four latent student classes
for different levels of the student characteristics and the intended and enacted curriculum predictors. . . 27 3.1 Examples for the multiplication and division strategy categories. . . 39 3.2 The content of the thirteen multidigit multiplication items and eight
multidigit division items in the assessment and the percentage of correct solutions. . . 43 3.3 Use and (observed and estimated) accuracy of the multiplication and
division strategies. . . 45 3.4 Effects of the student characteristics and selected teacher covariates. . . 48 4.1 Examples of applications of the different strategies on 850÷25. . . 60 4.2 The three versions of the eight problems in the division problem set. . . 63 4.3 The questions from the values questionnaire for the students’ teachers. . 64 4.4 Strategy use in the choice, NC-mental and NC-written calculation
con-dition. . . 67 4.5 Efficiency of required mental and written calculation in the respective
no-choice conditions. . . 68 4.6 Performance in terms of accuracy and speed with free strategy choice
List of Tables ix 5.1 Examples of the digit-based algorithm, whole-number-based algorithm,
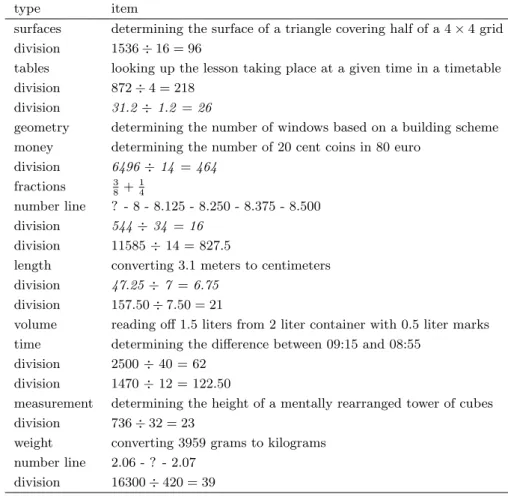
and non-algorithmic strategies applied to the division problem 544÷34. 80 5.2 The division problems that students had to solve at the pretest and
posttest. . . 84 5.3 Explanatory IRT models for training effects on written strategy choices
and accuracy (all comparisons are toMn−1). . . 92
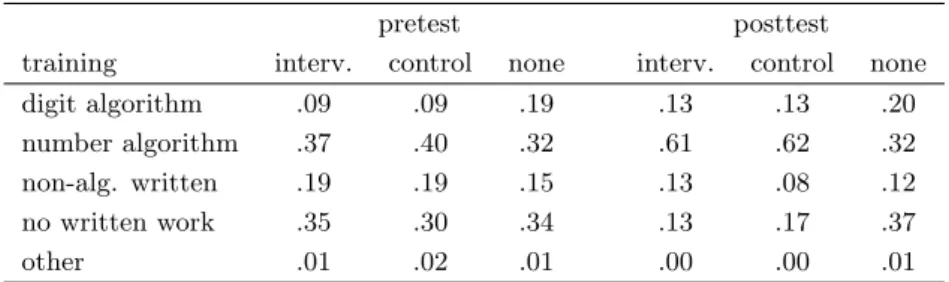
5.4 Strategy use proportions on the pretest and posttest in the intervention, control and no training conditions. . . 93 6.1 The twelve division and twelve other problems (order shown for the
mixed condition). . . 109 6.2 Examples for the different strategy coding categories for the division
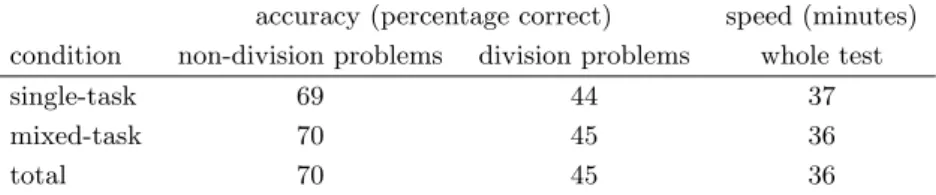
problem 544÷34. . . 110 6.3 Performance in the single and mixed task condition in terms of accuracy
1
General introduction
This dissertation concerns the mathematical strategies and performance of students and what factors affect these different aspects of problem solving. Before delving into the research on this point, I would like to invite you to take a moment to solve the multiplication and division problem presented below:
23×56 544÷34
Were you successful in obtaining the answers? For the multiplication problem, you should have found the answer 1288, and for the division problem the answer 16. And how did you go about obtaining the answers? Did you diligently take up paper and pencil and perform the algorithms you were taught in primary school, or did you perhaps take a less formal approach? Given that you are reading a dissertation, you probably enjoyed quite some years of education or even have a PhD, which means that according to Goodnow (1976), you are especially likely to solve mathematical problems using a mental approach without any external aids.
In taking such an approach, you would not be alone. The line of research that gave rise to this dissertation, comes from the observation of simultaneously declining performance in multiplication and division at the end of Dutch primary school and increasing amounts of problems that are answered without any calculations that are written down (Fagginger Auer, Hickendorff, & Van Putten, 2013; Hickendorff, Heiser, Van Putten, & Verhelst, 2009; Van Putten, 2005). In this dissertation, factors that affect students’ solution strategy use and performance are therefore investigated, as well as the statistical techniques that may be used to conduct such an investigation. This introduction provides a framework for this research by discussing solution strategies from a cognitive psychology point of view, and the
2 CHAPTER 1. GENERAL INTRODUCTION place of strategies in developments in mathematics education. The introduction is concluded with an outline of how the different chapters of this dissertation each contribute to the larger theme.
1.1
Solution strategies in cognitive psychology
Learning and problem solving are characterized by the use of a variety of strategies at every developmental stage (Siegler, 2007). This is already evident in children as young as infants: for example, some infants who are in their first weeks of inde-pendent walking use a stepping strategy, while others use a twisting strategy, and still others a falling strategy (Snapp-Childs & Corbetta, 2009). First graders who are asked to spell words use strategies as varied as retrieval, sounding out, drawing analogies, relying on rules, and visual checking (Rittle-Johnson & Siegler, 1999). Older children who solve transitive reasoning problems differ in their use of deduc-tive and visual solution strategies (Sijtsma & Verweij, 1999). Solution strategies of children and adults have been a topic of continued investigation for cognitive tasks concerning diverse topics, such as mental rotation and transformation (e.g., Arendasy, Sommer, Hergovich, & Feldhammer, 2011), counting (e.g., Bl¨ote, Van Otterloo, Stevenson, & Veenman, 2004), class inclusion (e.g., Siegler & Svetina, 2006), analogical reasoning (e.g., Tunteler, Pronk, & Resing, 2008), and digital gaming (e.g., Ott & Pozzi, 2012).
1.1. SOLUTION STRATEGIES IN COGNITIVE PSYCHOLOGY 3 numbers.
When solving mathematical problems, especially more complex multidigit prob-lems, there is an array of possible solution strategies. Lemaire and Siegler (1995) proposed a general framework for charting the strategy use for a given domain, con-sisting of four aspects of strategic competence. The first aspect of the framework is the strategy repertoire, or in other words, which strategies are used. The second aspect concerns the frequency with which each of the strategies in that repertoire is chosen for use. The third aspect is strategy efficiency, which describes the per-formance of each strategy. The fourth aspect is the adaptivity of the choices that are made between strategies, which can be judged based on task, subject and con-text variables. Combining these different factors, Verschaffel, Luwel, Torbeyns, and Van Dooren (2009) defined the choice for a strategy as adaptive when the chosen strategy is most appropriate for a particular problem for a particular individual, in a particular sociocultural context.
4 CHAPTER 1. GENERAL INTRODUCTION
1.2
Solution strategies in mathematics education
An essential element of the context for mathematical solution strategies is of course the educational system. The educational systems for mathematics underwent quite some changes in the second half of the twentieth century in many Western coun-tries, among which the Netherlands, where the research for this dissertation took place (see descriptions by Klein, 2003, and the Royal Netherlands Academy of Arts and Sciences, 2009). Already prior to this period, there was discontent with mathe-matics education and its outcomes, but no real changes occurred until the U.S.S.R. launched the first space satellite Sputnik in 1957. This caused a shock in the West-ern world and an intWest-ernational conference was held in Royaumont in 1959, with the aim of reforming education to advance economical and technological development. Here, a radically different approach to mathematics education was envisioned with the name of ’New Math’, which de-emphasized algorithms in light of the uprise of computers and calculators, and focused on set theory and logic instead.
New Math was adopted in various European countries and in the U.S., and mathematics education followed its own course of development after that in each country. For example, in the U.S. (Klein, 2003), New Math’s scant attention for basic skills and applications and its sometimes overly formal and abstract nature led to criticisms, and by the early 1970s, New Math programs were discontinued there. During the 1980s, progressivist changes to the curriculum were proposed in the U.S., that revolved around student-centered, discovery-based learning through ’real world’ problem solving. Increased attention was prescribed for topics such as cooperative work, mental computation and use of calculators, whereas direct teacher instruction, algorithms (long division in particular) and paper-and-pencil computations were to receive decreased attention (National Council of Teachers of Mathematics, 1989). In the 1990s, these changes were implemented throughout the country, but they also met with resistance from parents and mathematicians, resulting in so-called ’math wars’.
1.2. SOLUTION STRATEGIES IN MATHEMATICS EDUCATION 5 that should make mathematics meaningful. Five core principles were established for realistic mathematics (Treffers, 1987b): students construct their own knowledge, making students’ own strategies the starting point; models are used to advance from informal to more formal approaches; students reflect on their own approaches; students learn from their own and others’ approaches through interaction; and students are stimulated find connections between what they have learned. By 2002, there were only realistic mathematics textbooks on the market for primary schools. Following a talk that heavily criticized realistic mathematics at a mathematics education conference in 2007 (Van de Craats, 2008), a national debate started.
1.2.1
Strategy use and performance
As can be seen from this short history description, solution strategies were an important aspect of the reforms of mathematics education. Algorithms were de-emphasized in the light of technological advances, while attention for students’ problem solving strategies increased. In realistic mathematics, the informal strate-gies that students invent themselves are used as the building blocks for formaliza-tion. Problems do not have a single standardized approach; instead, the multitude of possible strategies is emphasized through interaction, and students have to make choices between strategies when they solve a problem. This makes the adaptivity of strategy choices highly important: selecting the best performing strategy is vital to performance.
6 CHAPTER 1. GENERAL INTRODUCTION Table 1.1: Examples of written work for different multiplication and division strate-gies for the problems 23×56 and 544÷34.
digit-based algorithm
whole-number-based algorithm
non-algorithmic written
no written work
23×56 56 56 1120 + 3×56 1288
23× 23× 1120 + 168
168 18 1288
1120 + 150
1288 120
1000 + 1288
544÷34 34/544\16 544 : 34 = 10×34 = 340 16 34 340 - 10× 15×34 = 510
204 204 16×34 = 544
204 102 - 3×
0 102
102 - 3×+ 0 16×
& Hemker, 2005). The newest editions of some textbooks do include digit-based division.
1.3. CONTENTS OF THIS DISSERTATION 7 without written work. Follow-up research indicated that this answering without any written work should be interpreted as mental calculation (Hickendorff, Van Putten, Verhelst, & Heiser, 2010).
The accuracy of mental strategies was found to be much lower than that of writ-ten strategies (see percentage correct rates in Figure 1.1). The increasing choices for an inaccurate strategy rather than for the much more accurate alternatives suggest that the important educational goal of adaptivity is not attained for a substantial part of the students. Especially lower ability students and boys appear at risk in this respect (Hickendorff et al., 2009). The changing strategy choices also appear to have had considerable consequences for performance: the overall performance level for the domain of multidigit multiplication and division decreased sharply from 1997 to 2004 (J. Janssen et al., 2005), and remained at that lower level in 2011 (Scheltens et al., 2013).
This also raises the question of how instruction affects students’ performance. As illustrated by the endings of the paragraphs on the history of mathematics reforms in the U.S. and the Netherlands, this is a topic that inspires (sometimes heated) debate. An important contribution to the discussion can be made by empirical investigations that evaluate the actual effects that the prescribed curriculum and different instructional practices have on performance. The existing research on the effects of the curriculum (usually operationalized as the mathematics textbook that is used) finds those effects to be very limited, though studies often lack proper ex-perimental design (Royal Netherlands Academy of Arts and Sciences, 2009; Slavin & Lake, 2008). However, there are considerable effects of teachers’ actual instruc-tional behaviors (e.g., positive effects of cooperative learning methods and programs targeting teachers’ skills in classroom management, motivation, and effective time use; Slavin & Lake, 2008).
1.3
Contents of this dissertation
8 CHAPTER 1. GENERAL INTRODUCTION
1997 2004 2011
0 25 50 75
assessment year
p
ercen
tage
use
strategy
multiplication
digit algorithm (68%) number algorithm (68%) non-algorithmic (59%) no written work (51%)
other (3%)
1997 2004 2011
0 25 50 75
assessment year
p
ercen
tage
use
strategy
division
digit algorithm (61%) number algorithm (63%) non-algorithmic (50%) no written work (22%)
other (4%)
1.3. CONTENTS OF THIS DISSERTATION 9 students’ mathematical performance that needs to be addressed. Two approaches to investigating relations with strategy use and performance are taken: secondary analyses of large-scale assessment data and experiments in primary schools.
The first approach is taken in Chapter 2 and Chapter 3, which contain secondary analyses of data from the most recent Dutch large-scale assessment of mathemati-cal ability at the end of primary school. Many of the students participating in this assessment solved several multidigit multiplication and division problems, and the accuracy and strategy use for each of these solutions was coded based on students’ written work. The students’ teachers filled out a questionnaire on their mathemat-ics instruction: both on general aspects of this instruction and on multiplication and division instruction more specifically. These teacher reports, and student character-istics, were related to students’ strategy use (Chapter 2) and to their performance (Chapter 3).
Investigating these relations posed several statistical challenges: how to deal with the large number of items from the teacher questionnaire; the multilevel structure of the data (item responses within students, who are within classes); the nominal measurement level of the strategies; and the incomplete assessment design, in which students do not complete all items but only systematically varying subsets of items. These issues are addressed with latent variable models. In Chap-ter 2, a first application of multilevel latent class analysis (MLCA) to large-scale assessment data is demonstrated, and several issues in applying this technique are discussed. In Chapter 3, a new combination of LASSO penalization and explana-tory item response theory (IRT) is introduced to deal with the large number of teacher variables.
The second approach to investigating the relation between instruction and strat-egy use and performance is taken in Chapter 4 and Chapter 5, which describe experiments in primary schools. Whereas analyses of large-scale assessments only allow for the investigation of correlational relations, experiments enable causal in-ference. The experiments in both chapters focus on mental versus written strategy use, given the large performance difference between the two, and consider the effects of student characteristics.
10 CHAPTER 1. GENERAL INTRODUCTION another version of the set of division problems, and to not do so for a third version. This experimental set-up allowed for an unbiased assessment of the differences in accuracy and speed between mental and written strategies, and for an investigation of the adaptivity of students’ strategy choices. In Chapter 5, it is evaluated what the effects on spontaneous strategy choices and performance are of a training pro-gram that features instruction in writing down calculations, using a pretest-posttest design with a control training condition and a no training condition.
2
Multilevel latent class analysis for large-scale educational assessment
data: Exploring the relation between the curriculum and students’
mathematical strategies
Abstract
A first application of multilevel latent class analysis (MLCA) to educa-tional large-scale assessment data is demonstrated. This statistical technique addresses several of the challenges that assessment data offers. Importantly, MLCA allows modeling of the often ignored teacher effects and of the joint influence of teacher and student variables. Using data from the 2011 assess-ment of Dutch primary schools’ mathematics, this study explores the relation between the curriculum as reported by 107 teachers and the strategy choices of their 1619 students, while controlling for student characteristics. Consider-able teacher effects are demonstrated, as well as significant relations between the intended as well as enacted curriculum and students’ strategy use. Im-plications of these results for both more theoretical and practical educational research are discussed, as are several issues in applying MLCA and possibili-ties for applying MLCA to different types of educational data.
2.1
Introduction
Latent class analysis (LCA) is a powerful tool for classifying individuals into groups based on their responses on a set of nominal variables (Hagenaars & McCutcheon,
This chapter has been published as: Fagginger Auer, M. F., Hickendorff, M., Van Putten, C. M., B´eguin, A. A., & Heiser, W. J. (2016). Multilevel latent class analysis for large-scale educa-tional assessment data: Exploring the relation between the curriculum and students’ mathematical strategies. Applied Measurement in Education.
The research was made possible by the Dutch National Institute for Educational Measurement Cito, who made the assessment data available to us. We would also like to thank Jeroen Vermunt, Anita van der Kooij and Zsuzsa Bakk for their statistical advice.
12 CHAPTER 2. MLCA FOR LARGE-SCALE ASSESSMENTS 2002; McCutcheon, 1987). LC models have a categorical latent (unobserved) vari-able, and every class or category of this latent variable has class-specific probabilities of responses in the categories of the different observed response variables. As such, each latent class has a specific typical response pattern where some responses have a higher and others have a lower probability, and different response profiles of indi-viduals may be discerned based on this. For example, for a test covering language, mathematics and science, one latent class of students may have a high probability of correct responses for mathematics and science items but a lower probability for language items, while for an other latent class the probability of a correct response is high for language items and lower for mathematics and science items. These two classes then reflect different performance profiles.
Relatively recently, the technique of LCA has been extended to accommodate an additional hierarchical level (Vermunt, 2003): not only the nesting of variables within individuals is included in the model, but also the nesting of individuals in some higher level group (e.g., students within school classes). This multilevel LCA (MLCA) is beginning to be applied more and more in various areas, such as psychiatry (Derks, Boks, & Vermunt, 2012), political science (Morselli & Passini, 2012), and education (Hsieh & Yang, 2012; Mutz & Daniel, 2011; Vermunt, 2003). In the current investigation, we describe a first application of MLCA to educational large-scale assessment data.
2.1.1
MLCA for educational large-scale assessment data
MLCA can address several of the challenges of large-scale assessment data. A first challenge that many large-scale assessments offer is that they employ so-called incomplete designs: the complete item set is too large to be administered in full to students, and is therefore decomposed into smaller subsets. Relating these subsets to each other is difficult using traditional techniques, but is possible using a latent variable to which all items are related (Embretson & Reise, 2000; Hickendorff et al., 2009), such as the latent class variable in LCA. No imputation of missing responses on the items that were not administered is necessary, as the likelihood function of the analysis is only based on cases’ observed responses (Vermunt & Magidson, 2005). A second challenge is the complexity of modeling cognitive phenomena that are not measured on an interval but on a nominal level (such as solution strategy use, item correctness or error types). Nominal response variables are naturally accommodated by (M)LCA.
2.1. INTRODUCTION 13 educational data (items nested within students, who are nested within teachers and schools). Previous applications of LCA (and also of other techniques) to students’ responses on cognitive tests have generally ignored the teacher (or school) level in their modeling (e.g., Geiser, Lehman, & Eid, 2010; Hickendorff et al., 2009, 2010; Lee Webb, Cohen, & Schwanenflugel, 2008; Yang, Shaftel, Glasnapp, & Poggio, 2005). Yet, the context of learning is vital to its outcomes. Zumbo et al. (2015) recently proposed an ecological model of item responding where responses are in-fluenced by contextual variables at various levels: characteristics of the test, of the individual, of the teacher and school, of the family and ecology outside of school, and of the larger community. Based on this model, the authors demonstrate eco-logically moderated differential item functioning (DIF) where different factors in this broader context play a role.
The consideration of a broader context fits in very well with MLCA, as its mul-tilevel aspect makes it especially suited for the incorporation of contextual factors in models of students’ item responses. Predictors at different hierarchical levels can be included in the model, a feature that is naturally called for in modeling the effects of both student and teacher characteristics on students’ item solving.
In the current investigation, we therefore demonstrate the use of MLCA for educational large-scale assessment data, by applying it to data from the most recent large-scale assessment of Dutch sixth graders’ mathematics. We investigate the relation between the curriculum on the one hand and students’ use of solution strategies on the other (while controlling for student characteristics), and describe the technique of MLCA and some of the challenges in its application in more detail.
2.1.2
Curriculum effects on students’ mathematical
achievement and strategies
Recent reviews of research on the effects of mathematics teaching have concluded that the influence of the intended curriculum (as it is formally laid down in cur-riculum guides and textbooks; Remillard, 2005) on achievement is very small, while changes in the enacted curriculum of daily teaching practices have a much larger influence (Slavin & Lake, 2008). These findings are based mainly on small experi-ments, and can be supplemented using large-scale assessment data, which does not allow for causal inference but does offer much larger samples and representative descriptions of the natural variation in daily teaching practices (Slavin, 2008).
14 CHAPTER 2. MLCA FOR LARGE-SCALE ASSESSMENTS 2004; Rowan, Correnti, & Miller, 2002). In identifying the factors that determine teachers’ influence on students’ mathematical achievement, a line of research called ’education production function research’ has focused on the effects of available re-sources. Generally, routinely collected information on teachers’ resources (such as their education level) has failed to show consistent, sizable effects (e.g., Jepsen, 2005; Nye et al., 2004; Wenglinsky, 2002), while more in-depth teacher resource measurements (such as knowledge for mathematical teaching) show more consis-tent positive effects (Hill, Rowan, & Ball, 2005; Wayne & Youngs, 2003). The more process-focused line of ’process-product research’ has most notably found positive effects of active teaching, which involves teachers’ direct instruction of students in formats such as lecturing, leading discussions, and interaction during individual work (as described by Hill et al., 2005, and Rowan et al., 2002), as contrasted with frequent independent work of students and working on nonacademic subjects. Also, positive effects have been found of reform-oriented classroom practice, which involves activities such as exploring possible methods to solve a mathematical prob-lem (Cohen & Hill, 2000).
These results all concern curriculum effects on students’ mathematical achieve-ment, but the mathematicalstrategies of students that are the focus of this inves-tigation are also of great interest. The various reforms in mathematics education that have taken place in a number of countries in the past decades (Kilpatrick, Swafford, & Findell, 2001) share a view on strategy use that moves away from product-focused algorithmic approaches towards process-focused approaches with more space for students’ own strategic explorations (Gravemeijer, 1997). Investigat-ing which instructional practices elicit particular patterns of strategy choices may shed light on how reforms actually affect students’ behavior. On a more theoretical level, the literature on children’s choices between and performance with mathemati-cal strategies has so far focused on the effects of children’s individual characteristics and of the nature of the mathematical problems that are offered (e.g., Hickendorff et al., 2010; Imbo & Vandierendonck, 2008; Lemaire & Lecacheur, 2011; Lemaire & Siegler, 1995), and may therefore be extended by also exploring the effects of instruction.
2.1.3
Multidigit multiplication and division strategies in the
Netherlands
2.1. INTRODUCTION 15 Table 2.1: Examples of the digit-based algorithms, whole-number-based algorithms, and non-algorithmic strategies applied to the multiplication problem 23×56 and the division problem 544÷34.
strategy multiplication division
digit-based algorithm 56
23×
168 1120+ 1288
34/544\16 34 204 204 0 whole-number-based algorithm 56
23×
18 150 120 1000+ 1288
544 : 34 = 340 - 10×
204 102 - 3×
102
102 - 3×+ 0 16×
non-algorithmic written strategies 1120 + 3×56 1120 + 168 1288
10×34 = 340 13×34 = 442 16×34 = 544
division strategies in the Dutch situation (Hickendorff, 2011; J. Janssen et al., 2005). Multidigit multiplication and division go beyond simple multiplication table facts (such as 5×6 or 72÷8) and require operations on larger numbers or decimal numbers (such as 56×23 or 544÷16). The Dutch mathematics education reform introduced new algorithmic ’whole-number-based’ approaches for these multidigit operations, where every step towards obtaining the solution requires students to understand the magnitude of the numbers they are working with (Treffers, 1987a). This approach deviates from the more traditional ’digit-based’ algorithms, where the numbers are broken up into digits that can be handled without an appreciation of their magnitude in the whole number (see Table 2.1 for examples of both algorithms). In general, Dutch children’s learning trajectory consists of first learning the whole-number-based multiplication and division algorithms, and later switching to the digit-based algorithm for multiplication (and in some schools, also for division; Buijs, 2008).
16 CHAPTER 2. MLCA FOR LARGE-SCALE ASSESSMENTS multiplication and division and switched to answering without writing down any calculations (mental calculation; Hickendorff et al., 2010) instead. These mental calculation strategies were found to be much less accurate than written strategies (digit-based or other) (Hickendorff, 2011; Hickendorff et al., 2009), and were used more by boys, students with low mathematical proficiency, and lower SES students.
2.1.4
The present study
In the present study, MLCA is used to investigate the relation between both the intended and enacted curriculum and the use of solution strategies for multidigit multiplication and division items by 1619 Dutch sixth graders (11-12-year-olds). The intended curriculum is operationalized as the mathematics textbook and the enacted curriculum as the self-reports on mathematics teaching practices of the stu-dents’ 107 teachers. The data are from the most recent (2011) large-scale national assessment of the mathematical abilities of Dutch students at the end of primary school (Scheltens et al., 2013).
Hypotheses
Based on previous research on Dutch students’ multiplication and division strategy use by Hickendorff (2011), we expect to find a considerable group of students who mostly answer without written calculations (with relatively many boys, students with low mathematical proficiency, and lower SES students), one group where stu-dents mostly use the digit-based algorithm, and one group where stustu-dents mostly use the whole-number-based algorithm or non-algorithmic approaches. Hickendorff (2011) considered multiplication and division in isolation, but we consider them si-multaneously and can therefore analyze the relation between individual differences in strategy use on multiplication and division items. For example, there may be a group of students who prefer the digit-based algorithm for multiplication and the whole-number-based algorithm for division, matching the most common end points of the respective learning trajectories.
2.1. INTRODUCTION 17 effects of the enacted curriculum, the previously discussed achievement literature described positive effects of direct instruction rather than independent work, so these activities might affect choices for more accurate (written) or less accurate (mental) strategies. Differentiated instruction might also have such effects, espe-cially because of the association between ability and strategy choices. Furthermore, we expect effects of teachers’ strategy instruction in algorithms, mental calculation, and strategy flexibility, because of the apparent direct connection to students’ strat-egy use.
Issues in applying MLCA
The application of MLCA with predictors which is the focus of the present study comes with several practical issues that require attention. The first is the speci-fication of the multilevel effect in the model. The common parametric approach specifies a normal distribution for group (in our case, teacher) deviations from the overall parameter value, but this distributional assumption is strong and the inter-pretation of such group effects is abstract. The nonparametric approach proposed by Vermunt (2003) instead creates a latent class variable for the groups (in addition to the latent class variable for the individuals), requiring less strong distributional assumptions, making computations less intensive, and allowing for easier substan-tive interpretation. Therefore, we will use the nonparametric approach.
18 CHAPTER 2. MLCA FOR LARGE-SCALE ASSESSMENTS we will use this corrected three-step approach.
The third issue is the selection of the best model. This is usually done based on information criteria that consider model fit and complexity simultaneously, such as the popular Aikaike en Bayesian Information Criterion (AIC and BIC). However, these criteria penalize model complexity differently and therefore often identify different models as optimal (Burnham & Anderson, 2004). The issue is further complicated with the introduction of a multilevel effect, because the BIC penaliza-tion depends on sample size, and it is then unclear whether to use the number of individuals or groups for that (Jones, 2011). Lukoˇcien˙e and Vermunt (2010) inves-tigated this issue and demonstrate optimal performance of the group-based BIC, and underestimation of complexity by the individual-based BIC and overestimation by the AIC. In our analyses, model selection with all three criteria is compared.
2.2
Method
2.2.1
Sample
For our data from the most recent large-scale assessment of the mathematical abil-ities of Dutch students, 107 schools from the entire country were selected according to a random sampling procedure stratified by socioeconomic status. From a total of 2548 participating sixth graders (11-12-year-olds) in those schools, 1619 students from the classes of 107 teachers (one teacher per school, between 5 and 25 students per school in most cases) solved multidigit multiplication and division problems (because of the incomplete assessment design, not all students solved this type of problems). Of the 1619 children, 49 percent were boys and 51 percent were girls. Fifty percent of the children had a relatively higher general scholastic ability level, as they were to go to secondary school types after summer that would prepare them for higher education, while the other 50 percent were to go to vocational types of secondary education. In terms of SES, most children (88 percent) had at least one parent who completed at least two years of secondary school, while 12 percent did not.
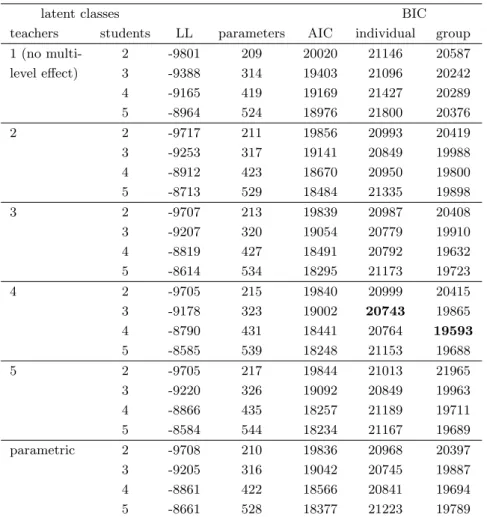
2.2. METHOD 19 Table 2.2: The content of the thirteen multidigit multiplication problems and eight multidigit division problems in the assessment, and the strategy use frequency on each item.
strategy use (percent)
problem context DA WA NA NW U O N
M01 9×48 = 432 yes 39 4 24 30 2 2 368
M02 23×56 = 1288 yes 45 6 21 17 5 6 358
M03 209×76 = 15884 no 49 5 24 12 7 3 344
M04 35×29 =1015 yes 40 4 28 23 3 2 353
M05 35×29 =1015 no 43 4 23 24 3 3 352
M06 24×37.50 = 900 no 39 2 31 18 6 5 352
M07 9.8×7.2 =70.56 no 40 3 17 27 10 3 352
M08 8×194 =1552 yes 43 3 25 27 2 1 355
M09 6×192 = 1152 no 33 2 33 23 4 5 352
M10 1.5×1.80 = 2.70 yes 1 0 13 79 3 4 353
M11 0.18×750 = 135 no 41 2 16 27 12 2 356
M12 6×14.95 = 89.70 yes 32 1 29 34 2 2 359
M13 3340×5.50 =18370 yes 41 3 23 18 10 5 359
D01 544÷34 =16 yes 18 32 5 27 10 7 368
D02 31.2÷1.2 =26 no 9 10 6 50 18 7 369
D03 11585÷14 = 827.5 yes 17 30 4 32 10 7 345
D04 1470÷12 = 122.50 yes 19 25 11 31 12 3 350
D05 1575÷14 =112.50 no 17 30 16 22 12 3 355
D06 47.25÷7 =6.75 yes 17 25 10 33 10 5 352
D07 6496÷14 =464 yes 16 24 5 36 12 7 354
D08 2500÷40 = 62 yes 12 15 11 45 6 11 359
total multiplication 37 3 24 28 5 3 4613
total division 16 24 9 35 11 6 2852
Note: Parallel versions of problems not yet released for publication are in
ital-ics. DA=digit-based algorithm, WA=whole-number-based algorithm, NA=non-algorithmic written, NW=no written work, U=unanswered, O=other
20 CHAPTER 2. MLCA FOR LARGE-SCALE ASSESSMENTS
2.2.2
Materials
Multiplication and division problems
The assessment contained thirteen multidigit multiplication and eight division lems, of which students solved systematically varying subsets of three or six prob-lems according to an incomplete design (see Hickendorff et al., 2009, for more de-tails on such designs). The problems are given in Table 2.2, including whether the problem to be solved was provided in a realistic context (such as determining how many bundles of 40 tulips can be made from 2500 tulips). Students were allowed to write down their calculations in the ample blank space in their test booklets, and these calculations were coded for strategy use. Six categories were discerned: the aforementioned digit-based and whole-number-based algorithms, written work without an algorithmic notation (such as only writing down intermediate steps), no written work, unanswered problems, and other (unclear) solutions (see Table 2.1 for examples). The coding was carried out by the first and third author and three undergraduate students, and interrater agreement was high (Cohen’sκ’s (J. Cohen, 1960) of .90 for the multiplication and .89 for the division coding on average, based on 112 multiplication and 112 division solutions categorized by all).
Teacher survey about classroom practice
The teachers of the participating students filled out a survey about their mathemat-ics teaching practices. The 14 questions in the survey that concerned multiplication, division, and mental calculation strategy instruction were used to create four scores (by taking the mean of the standardized responses to the questions), as were the 10 questions that concerned instruction formats, and the 10 questions that concerned instruction differentiation. The Appendix gives the questions that were used to create each score.
2.2.3
Multilevel latent class analysis
We estimated latent classes of students reflecting particular strategy choice pro-files using MLCA, which classifies respondents in latent classes that are each char-acterized by a particular pattern of response probabilities for a set of problems (Goodman, 1974; Hagenaars & McCutcheon, 2002). For our case, let Yijk denote
the strategy choice of studentiof teacherjfor itemk. A particular strategy choice on itemkis denoted bysk. The latent class variable is denoted byXij, a particular
2.2. METHOD 21 choices of a student is denoted byYij and a possible strategy choice pattern bys. This makes the model:
P(Yij=s) =
T X
t=1
P(Xij=t) K Y
k=1
P(Yijk =sk|Xij =t). (2.1)
In this model, the general probability of a particular pattern of strategy choices,
P(Yij = s), is decomposed into T class-dependent probabilities,
K Q
k=1
P(Yijk = sk|Xij =t). These class-dependent probabilities are each weighted by the
proba-bility of being in that latent class,P(Xij=t). The interpretation of the nature of
the latent classes is based on the class-dependent probabilities of strategy choices on each of the problems, P(Yijk = sk|Xij = t). The model is extended with a
multilevel component by adding a latent teacher class variable, on which students’ probability of being in each latent student class (P(Xij =t)) is dependent.
Predic-tors at the teacher and student level that influence class probabilities can also be added, as described by Vermunt (2003, 2005). For such a multilevel model with one teacher-level predictorZ1j and one student-level predictorZ2ij, letWj denote the
latent teacher class that that teacherj is in, withmdenoting a particular teacher class. The model then becomes:
P(Xij =t|Wj=m) =
exp(γtm+γ1tZ1j+γ2tZ2ij) T
P
r=1
exp(γrm+γ1rZ1j+γ2rZ2ij)
. (2.2)
See Henry and Muth´en (2010) for graphical representations of this type of mod-els.
22 CHAPTER 2. MLCA FOR LARGE-SCALE ASSESSMENTS evaluated based on the magnitude of the changes in the probability of class mem-berships associated with different levels of the predictors. Effect coding was used for all predictors.
2.3
Results
2.3.1
The latent class measurement model
For the LC measurement models fitted on the strategy data, both the AIC and BICs (see Table 2.3) show that adding a multilevel structure greatly improves model fit, signifying a considerable within-teacher dependency of observations. While the AIC identifies a very complex model as optimal (ten latent teacher classes and six latent student classes), the BICs are in near agreement on a more simple model (four latent teacher classes and three or four latent student classes). Of these simpler models, the model with four student classes has a much clearer interpretation and is also favored by the group-based BIC that is optimal according to Lukoˇcien˙e and Vermunt (2010). This model has an entropyR2of .87 for the latent student classes
and .82 for the teacher classes, which both indicate a high level of classification certainty (Dias & Vermunt, 2006).
We also estimated measurement models with a parametric rather than a non-parametric teacher effect (see the bottom part of Table 2.3). The non-parametric model with the lowest group-based BIC also had four student classes, and the class-specific probabilities of these classes were very similar to those of the classes in the non-parametric model (indicating very similar nature of the classes), but the classes differed considerably in size in the two approaches (by 13, 4, 25, and 15 percentage points respectively). Latent teacher classes cannot be compared as there are none in the parametric approach, which also prevents later easy substantive interpretation of the multilevel effect. The fit of the best parametric model was not better than that of the best non-parametric model according to the information criteria, and the entropyR2for the student classes of the parametric model was lower (.80).
Latent student classes
2.3. RESULTS 23
Table 2.3: Fit statistics for the non-parametric and parametric multilevel latent class models.
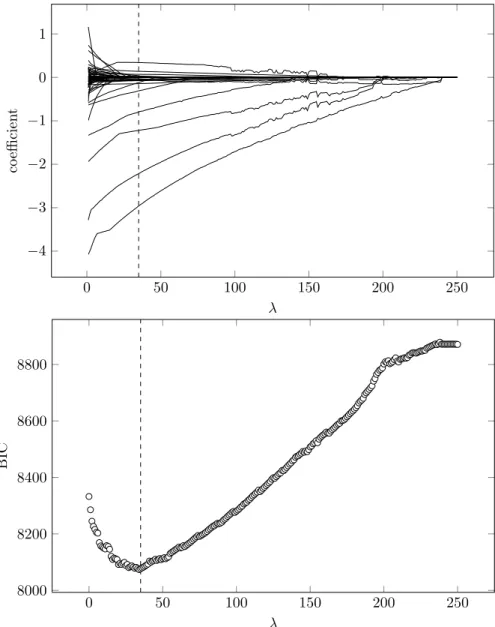
latent classes BIC
teachers students LL parameters AIC individual group
1 (no multi- 2 -9801 209 20020 21146 20587
level effect) 3 -9388 314 19403 21096 20242
4 -9165 419 19169 21427 20289
5 -8964 524 18976 21800 20376
2 2 -9717 211 19856 20993 20419
3 -9253 317 19141 20849 19988
4 -8912 423 18670 20950 19800
5 -8713 529 18484 21335 19898
3 2 -9707 213 19839 20987 20408
3 -9207 320 19054 20779 19910
4 -8819 427 18491 20792 19632
5 -8614 534 18295 21173 19723
4 2 -9705 215 19840 20999 20415
3 -9178 323 19002 20743 19865
4 -8790 431 18441 20764 19593
5 -8585 539 18248 21153 19688
5 2 -9705 217 19844 21013 21965
3 -9220 326 19092 20849 19963
4 -8866 435 18257 21189 19711
5 -8584 544 18234 21167 19689
parametric 2 -9708 210 19836 20968 20397
3 -9205 316 19042 20745 19887
4 -8861 422 18566 20841 19694
5 -8661 528 18377 21223 19789
Note: The lowest BICs are bold. The lowest AIC was for 10 teacher and 6 student
24 CHAPTER 2. MLCA FOR LARGE-SCALE ASSESSMENTS Table 2.4: The mean probabilities of choosing each of the six strategies for the multiplication and division problems for each latent class.
strategy probability (proportion students in class)
NW class (.31) MA class (.29) NA class (.21) DA class (.20)
strategy × ÷ × ÷ × ÷ × ÷
DA .06 .01 .71 .01 .04 .03 .68 .70
WA .01 .02 .02 .54 .14 .37 .02 .01
NA .25 .03 .15 .10 .68 .21 .16 .03
NW .52 .65 .10 .24 .08 .22 .10 .17
U .13 .23 .02 .06 .03 .08 .03 .03
O .04 .05 .02 .05 .04 .10 .02 .06
Note: The highest probability per operation within a class is in boldface. MA=mixed
algorithm, see Table 2.2 for other abbreviations.
2.4, which shows that every latent student class is dominated by high probabilities of choosing one or two strategies.
The largest student class (with a class probability of .31, i.e., containing 31 percent of students) is characterized by a high probability of answering without written work for every item, and also a considerable probability of leaving prob-lems unanswered (especially division probprob-lems). Because of this, we label this class the ’no written work class’. The second largest student class (probability of .29) is characterized by a high probability of solving multiplication problems with the digit-based algorithm and a high probability of solving division problems with the number-based algorithm (the ’mixed algorithm class’). The third largest student class (probability of .21) is characterized by a high probability of solving multi-plication problems with non-algorithmic written strategies and a mixture of the number algorithm, non-algorithmic written strategies and no written work for the division problems (the ’non-algorithmic written class’). The smallest student class (probability of .20) is characterized by a high probability of solving both multiplica-tion and division problems with digit-based algorithms (the ’digit-based algorithm class’.)
Latent teacher classes
2.3. RESULTS 25 Table 2.5: The latent student class probabilities in each of the four latent teacher classes.
latent student class probability
latent teacher class NW MA NA DA
1 (P =.39) .27 .61 .11 .00
2 (P =.30) .38 .08 .51 .02
3 (P =.19) .23 .00 .03 .74
4 (P =.12) .34 .22 .09 .36
total .31 .29 .21 .20
Note: The highest latent student class probability within a latent teacher class is in
boldface. See Table 2.2 and 2.4 for abbreviations.
class varies most over teacher classes (between .00 and .74), followed by that of the mixed algorithm class (between .00 and .61), and that of the non-algorithmic written class (between .03 and .51). The probability of the no written work class varies relatively little over teacher classes (between .23 and .38). The largest teacher class (size of .39) is characterized by a high probability of the mixed algorithm class, the second largest teacher class (.30) by a high probability of the non-algorithmic written strategy class, the third largest teacher class (.19) by a high probability of the digit-based algorithm class, and the smallest teacher class (.12) by substantial probabilities for all classes except the non-algorithmic written class.
These insightful results on the magnitude and nature of teachers’ effects illus-trate one of the advantages of the nonparametric specification of the multilevel effect.
2.3.2
Adding predictors to the latent class model
group-26 CHAPTER 2. MLCA FOR LARGE-SCALE ASSESSMENTS Table 2.6: Fit statistics for the latent class models with successively added predic-tors.
BIC predictors added to the model LL pars AIC individual group
none -1651 15 3333 3414 3373
student char. gender, ability, SES -1569 24 3186 3315 3250
intended curr. textbook -1550 36 3172 3366 3268
enacted curr. strategy instruction -1517 48 3129 3388 3257
instruction formats -1500 60 3120 3443 3280 instruction diff. -1479 72 3103 3491 3295
Note: The lowest information criteria are in boldface.
based BIC is nearly as low for the model with the textbook and strategy instruction predictors added as for the model with only student predictors (3257 vs. 3250). Since curriculum effects were our primary interest, we chose to proceed with this more extensive model.
The statistical significance of the covariates in this model was evaluated with Wald tests, and the magnitude of the effects is illustrated by comparisons of the probabilities of membership of the latent student classes for individuals at the dif-ferent levels of the predictors (see Table 2.7). These probabilities were calculated with all of the other selected predictors in the model set at their mean. For the interval-level instruction variables, probabilities are compared for students of teach-ers who score one standard deviation above the mean of that variable and students of teachers who score one standard deviation below the mean. Probabilities for the different levels of a predictor that differ by .10 or more are discussed.
Student characteristics
Student gender had a significant effect on class probabilities,W2= 107.1,p < .001,
with the probability of being in the no written work class being .33 higher for boys than for girls. The probability of being in the mixed algorithm class was .17 higher for girls than for boys. Students’ general scholastic ability also had a significant effect,W2= 53.0, p < .001, with the probability of being in the no written work
28 CHAPTER 2. MLCA FOR LARGE-SCALE ASSESSMENTS
Intended curriculum
Mathematics textbook had a significant effect, W2 = 123.6, p < .001. Students
being instructed from the Pluspunt (PP) textbook had a probability for the non-algorithmic class that is .14 higher than than that of the total, and a .13 lower probability for the digit-based algorithm class. Students with the Rekenrijk (RR) textbook had a .16 lower probability for the digit algorithm class. Students with the Alles Telt (AT) textbook had a .16 lower probability of being in the mixed algorithm class and a .13 higher probability of being in the non-algorithmic written class. Students with other textbooks had .14 lower probability of being in the mixed algorithm class and a .14 higher probability of being in the digit algorithm class.
Enacted curriculum
All strategy instruction scores had significant effects. When comparing students whose teacher scored one standard deviation above the mean in their focus on the digit-based algorithm for multiplication to students whose teacher scored one standard deviation below the mean (and who were thus more focused on the whole-number-based algorithm for multiplication), their probability of being in the mixed algorithm class was .25 higher, while their probability of being in the non-algorithmic written class was .14 lower, W2 = 36.6, p < .001. Students whose
teacher scored above rather than below the mean for digit-based division had a .26 higher probability of being in the digit algorithm class, and a .18 and .12 lower probability of being in the mixed algorithm and non-algorithmic written class re-spectively, W2 = 100.9, p < .001 . Students whose teacher scored above rather
than below the mean in their attention to various aspects of mental calculation had a .18 higher probability of being in the mixed algorithm class and a .15 lower probability of being in the digit algorithm class, W2 = 49.0, p < .001. Students whose teachers scored above rather than below the mean for the use of multiple strategies per operation type, had a .35 lower probability of being in the mixed algorithm class and a .18 higher probability of being in the no written work class,
W2= 54.0,p < .001.
2.4
Discussion
2.4. DISCUSSION 29 solving (Zumbo et al., 2015). We demonstrated the added value of adequately modeling the multilevel structure inherent to educational data: though teacher effects are often ignored by researchers, we found them to be considerable. Model fit was much better with than without a multilevel structure for the teacher level, and latent teacher groups were found with large differences in students’ probability of having a certain strategy choice profile. Ignoring teacher effects therefore seems to result in the omission of a crucial part of the model, and thereby in an incomplete representation of reality. The present study also demonstrated the relevance of the possibility of including predictors at different hierarchical levels in the model by simultaneously controlling for student characteristics and investigating curriculum effects, which led to interesting results relevant to both educational practice and theory.
2.4.1
Substantive conclusions
The results with regard to strategy choice profiles (or latent classes) that were found were largely in line with our hypotheses: there were profiles dominated by answering without written work, by the digit-based algorithm, by non-algorithmic approaches and the whole-number-based algorithm, and by both algorithms depending on the operation (multiplication or division). Students’ probability of being in each of these classes was found to depend strongly on the teacher, because it varied considerably between latent teacher groups. The range was largest for the algorithmic classes and smallest for the no written work class. Therefore, teachers appear to have large effects effects on students’ strategy use, but these effects unfortunately seem smallest for the inaccurate mental strategies without written work.
Intended and enacted curriculum predictors were added, controlling for student characteristics. Consistent with previous research findings, boys and students who were going to a lower secondary school level were more likely to answer without writ-ten work. The inwrit-tended curriculum and enacted curriculum were not significantly related to each other, and were both found to be related to strategy choices, despite the suggestion from the literature of limited effects of the intended curriculum. As for the intended curriculum, the textbooks mostly appeared to be related to stu-dents’ probability of using the different algorithmic and non-algorithmic written strategies.
30 CHAPTER 2. MLCA FOR LARGE-SCALE ASSESSMENTS whole-number-based algorithms appeared to have the unexpected side-effect of a higher use of non-algorithmic written strategies. Devoting more attention to men-tal strategies was associated with higher probability of the mixed algorithm class and lower probability of the digit-based algorithm class. Teaching more than one strategy per operation was associated with lower probability of the mixed algorithm class and higher probability of the no written work class. Instruction formats did not have significant effects on strategy use, thereby not confirming our expectations regarding the effects of direct instruction versus independent work. Instruction dif-ferentiation also did not have a significant effect.
2.4.2
Limitations
A limitation of the present study could be the sample size, which is both relevant for the estimation of the complex MLCA models and the generalizability of the results. As for the sample size required for the estimation of MLCA models (or LCA models more generally), there are no general rules of thumb. Our sample of 1619 students with 107 teachers seems to be of a similar order of magnitude as those in the examples used by Vermunt (2003) in his introduction of MLCA, where applications were featured with 886 employees in 41 teams, 2156 students in 97 schools, and 3584 respondents in 32 countries. A more precise estimate for a specific situation can be made using Monte Carlo simulations, where factors such as the number and type of problems, the separation of the classes and their relative sizes (approximately equal or not) and the amount of missing data play a role (Muth´en & Muth´en, 2002; Nylund, Asparouhov, & Muth´en, 2007). Nylund et al. (2007) found particular problems with information criteria when a small sample (N = 200) was combined with unequal class sizes, as small classes then contain very few subjects. This is not the case in our sample.
2.4. DISCUSSION 31
2.4.3
Implications
The results suggest several implications (though the limited sample size should be noted). They suggest that models for strategy choices such as the Adaptive Strategy Choice Model (ASCM; Lemaire & Siegler, 1995) may need to be extended to include factors beyond the student and the problem (in line with suggestions by Verschaffel et al., 2009), and the same goes for other investigations of mathematical strategy use that have overlooked instructional factors so far (e.g., Hickendorff et al., 2010; Imbo & Vandierendonck, 2008; Lemaire & Lecacheur, 2011). The results also suggest that the investigations of curriculum effects on achievement may so far have omitted an important mediator: curriculum affects strategy use, and there are strong performance differences between strategies (Hickendorff, 2011; Hickendorff et al., 2009), so the curriculum may (in part) affect achievement through its effect on strategy use.
For educational reforms, our results suggest that although positive effects on achievement have been found of instructional practices congruent with reform ideas (Cohen & Hill, 2000), reform-oriented instruction may also have unexpected side-effects: teaching that is more oriented towards the whole-number-based algorithms introduced by the Dutch mathematics education reform, is not only associated with more use of those algorithms, but also with more use of non-algorithmic strategies that have previously been shown to be less accurate than algorithms (Hickendorff et al., 2009). Finally, our finding that the effects of teachers and the curriculum on the proportion of students who mainly use mental strategies were small suggests that it might be challenging to reduce students’ use of mental strategies through means of regular instruction, and that perhaps special interventions are necessary to promote their use of more accurate written strategies.
2.4.4
Conclusion
3
Using LASSO penalization for explanatory IRT: An application on
instructional covariates for mathematical achievement in a large-scale
assessment
Abstract
A new combination of statistical techniques is introduced: LASSO pe-nalization for explanatory IRT models. This was made possible by recently released software for LASSO penalization of GLMMs, as IRT models can be conceptualized as GLMMs. LASSO penalized IRT shows special promise for the simultaneous consideration of high numbers of covariates for students’ achievement in large-scale educational assessments. This is illustrated with an application of the technique on Dutch mathematical large-scale assessment data from 1619 students, with covariates from a questionnaire filled out by 107 teachers. The various steps in applying the technique are explicated, and educationally relevant results are discussed.
3.1
Introduction
Data with very high numbers of covariates can be analyzed using regularization methods that place a penalty on the regression parameters to improve prediction accuracy and interpretation, making this type of regression known as penalized re-gression. A popular form of penalized regression is LASSO (least absolute shrinkage and selection operator), where more and more regression parameters become zero as the penalty increases, thereby functioning as a covariate selection tool (Tibshirani,
This chapter is currently submitted for publication as: Fagginger Auer, M. F., Hickendorff, M., & Van Putten, C. M. (submitted). Using LASSO penalization for explanatory IRT: An application on covariates for mathematical achievement in a large-scale assessment.
The research was made possible by the Dutch National Institute for Educational Measurement Cito, who made the assessment data available to us.
34 CHAPTER 3. LASSO PENALIZATION FOR EXPLANATORY IRT 1996). LASSO has so far been applied in many (generalized) linear models, but has only recently been extended to generalized linear mixed models (GLMMs), allow-ing for the modelallow-ing of correlated observations (Groll & Tutz, 2014; Schelldorfer, Meier, & B¨uhlmann, 2014).
In the present study, we utilize this GLMM extension of LASSO to introduce penalized regression for explanatory item response theory (IRT) models, making use of the possibility of conducting IRT analyses with general GLMM software demonstrated by De Boeck and Wilson (2004). This first use of LASSO penalized explanatory IRT is demonstrated with an application to a large-scale educational dataset, a type of data for which this technique promises to be especially useful as it allows for the simultaneous consideration of high numbers of potentially relevant covariates while optimally modeling achievement.
3.1.1
Explanatory IRT with LASSO penalization for large-scale
assessment data
In large-scale educational assessments, achievement in an educational domain is assessed for a large representative sample of students to enable evaluation of the outcomes of an educational system (often that of a country), and to make compar-isons to past outcomes or to outcomes of other educational systems. The analysis of achievement data from assessments usually requires the linking of different subsets of a total item set. These can be both subsets of the large complete item set within an assessment and item sets of successive assessments, and can be done using IRT (e.g, Mullis, Martin, Foy, & Akora, 2012; Mullis, Martin, Foy, & Drucker, 2012; OECD, 2013; Scheltens et al., 2013). IRT models achievement by placing persons and items on a common latent scale, and the probability of a correct response de-pends on the distance between the ability θp of a person p and the difficulty βi
of an item i in a logistic function: P(ypi = 1|θp) =
exp(θp−βi)
1+exp(θp−βi). This basic IRT
3.1. INTRODUCTION 35 person covariates that vary across persons but not items (such as gender) can be used to explain ability level, and finally, person-by-item covariates that vary across both persons and items (such as solution strategy use) are also possible. IRT can therefore be used not only to optimally model achievement in large-scale assess-ments, but also to gain more insight into the factors that affect achievement (e.g., see Hickendorff et al., 2009).
Collection of data on such factors is a part of many assessments, as these assess-ments include questionnaires on topics such as children’s background and attitudes, teachers’ characteristics and instructional practices, and the conditions in schools (Mullis, Martin, Foy, & Akora, 2012; Mullis, Martin, Foy, & Drucker, 2012; OECD, 2013; Scheltens et al., 2013). These many different factors contribute to achieve-ment jointly, and should be considered simultaneously so that effects are evaluated while controlling for other covariates, and so that the importance of different co-variates relative to each other can be determined. However, analyses with very high numbers of covariates can be challenging, especially with models that are already complex models such as explanatory IRT models.
Penalized regression
A common way to deal with the challenge of high numbers of covariates is through so-called penalized regression. As described by Tibshirani (1996), normal regression with ordinary least squares (OLS) estimates can be improved in terms of prediction accuracy and interpretation by penalizing regression coefficients by shrinking them or setting some of them to zero. This can be done in various ways. One way is subset selection, in which a model with a subset of the covariates is selected (through forward or backward selection). Though the reduced number of covariates in this situation facilitates interpretation, small changes in the data can lead to the selection of very different models, creating the risk of chance capitalization and compromising prediction accuracy. A second way, ridge regression, is more stable as regression coefficients are shrunk in a continuous process, but is also more complex in terms of interpretation as none of the coefficients become zero. Tibshirani (1996) proposed a third way, LASSO regression, which seeks to combine stability and interpretability by shrinking some regression coefficients and setting others to zero.
Both in LASSO and ridge regression, the sum of a specific function of the regression parameters has to be smaller than or equal to a tuning parameter t. With ridge regression, this is the sum of the squared coefficients, P
j β2
36 CHAPTER 3. LASSO PENALIZATION FOR EXPLANATORY IRT with LASSO regression, the sum of the absolute coefficients,P
j
|βj| ≤t. With this
restriction, the sum of the squared differences between the observed and predicted
y’s,
N P
i=1
(yi−P j
βjxij)2, is minimized. Incorporating the restriction explicitly in the
latter equation, this can be alternatively formulated as
N P
i=1
(yi−P j
βjxij)2+λP j
β2 j
or
N P
i=1
(yi−P j
βjxij)2+λP j
|βj|. This whole equation is minimized, which in the case
of aλof 0 results in ordinary regression, but with increasing values ofλin a higher and higher penalization for the sum of the coefficients (until finally all penalized coefficients are zero). The different restrictions on the regression coefficients in ridge and LASSO result in shrunken coefficients in both cases, but generally, only with LASSO coefficients are set to zero (Tibshirani, 1996).
Recently, software has become available that allows for LASSO (but as far as we know, not ridge) penalization for GLMMs (Groll & Tutz, 2014; Schelldorfer et al., 2014). Schelldorfer et al. (2014) implemented GLMM LASSO in anRpackage entitled glmmixedLASSO, and demonstrated the efficiency and accuracy of their algorithm using various simulations with both relatively low (e.g., 10 and 50) and very high numbers of covariates (e.g., 500 and 1500) in logistic and Poisson models. They note that the mixed aspect of GLMMs causes a problem for LASSO, as the shrinkage of regression coefficients can severely bias the estimation of the variance components. They address this issue with a two-stage approach: first the LASSO is used as a variable selection tool, and then in a second step an unpenalized model with the selected variables is fitted using a maximum likelihood method, to ensure accurate estimation of the variance components.