Metabolic response of lung cancer
cells to radiation in a
paper-based 3D cell culture system
The Harvard community has made this
article openly available. Please share how
this access benefits you. Your story matters
Citation Simon, Karen A., Bobak Mosadegh, Kyaw Thu Minn, Matthew R. Lockett, Marym R. Mohammady, Diane M. Boucher, Amy B. Hall, et al. 2016. Metabolic Response of Lung Cancer Cells to Radiation in a Paper-Based 3D Cell Culture System. Biomaterials 95: 47–59. doi:10.1016/j.biomaterials.2016.03.002.
Published Version 10.1016/j.biomaterials.2016.03.002
Citable link http://nrs.harvard.edu/urn-3:HUL.InstRepos:30353765 Terms of Use This article was downloaded from Harvard University’s DASH
Metabolic Response of Lung Cancer Cells to Radiation in a
Paper-Based 3D Cell Culture System
Karen A. Simon1, Bobak Mosadegh1,2,3, Kyaw Thu Minn1, Matthew R. Lockett1,4,Marym
R. Mohammady1, Diane M. Boucher5, Amy B. Hall5, Shawn Hillier5, Taturo Udagawa5,
Brenda K. Eustace5* and George M. Whitesides1,2*
1 Department of Chemistry and Chemical Biology, Harvard University, 12 Oxford Street,
Cambridge, MA 02138, USA.
2 Wyss Institute for Biologically Inspired Engineering, Harvard University, 60 Oxford
Street, Cambridge, MA 02138, USA.
3 Dalio Institute of Cardiovascular Imaging, Department of Radiology, Weill Cornell
Medical College, 413 E. 69th Street Suite BRB-108, New York, NY, 10021, USA
4 Department of Chemistry, University of North Carolina at Chapel Hill, 125 South Road,
Chapel Hill, NC 27599, USA
5 Vertex Pharmaceuticals Incorporated, 50 Northern Blvd., Boston, MA, 02210 USA
(*) Author to whom correspondence should be addressed:
Keywords:
Tumor Hypoxia, Radiation Response, 3D Cell Culture, Oxygen Gradients,
Abstract (100-200 word limit)
This work demonstrates the application of a 3D culture system, which is known as
Cells-in-Gels-in-Paper or CiGiP, in evaluating the response of lung cancer cells to ionizing radiation. This system has four attributes: (i) multiple layers of paper,
containing cell-embedded hydrogels, are assembled into a stack to form a thick (~800
µm) tissue-like construct, (ii) the metabolism of the cells, coupled with the boundary
conditions imposed by an impermeable holder, generate a gradient of oxygen and
nutrients that decreases monotonically in the stack, (iii) the construct has no peripheral
components (e.g., pumps, tubing), that fits easily in an irradiator, and (iv) the construct
can be disassembled into individual layers, allowing for the quantification of cellular
phenotypes based on their position within the stack. With increased distance from the
source of oxygenated media, cells show increased levels of hypoxia-inducible factor,
decreased proliferation, and reduced sensitivity to ionizing radiation. The multi-layer
culture setup for CiGiP also distinguished differences in the radiosensitivity of three
isogenic variants of A549 cancer cells, which have known differences in their metastatic
behavior in vivo. The CiGiP system can, therefore, capture aspects of radiosensitivity of
populations of cancer cells related to mass-transport phenomenon inaccessible in
1. Introduction
In the United States and many developed countries, the overall 5-year survival
rate of a patient with lung cancer is estimated to be between 15 to 20 % [1, 2]. One-third
of lung cancer patients are diagnosed at an advanced stage, and radiation therapy remains
a preferred strategy for targeting tumor cells because these cells are known to possess
compromised DNA repair machinery, and often proliferate at higher rates than normal
cells [3-5]. The mechanism by which cells die from radiation therapy is believed to result
from damage to DNA; ionizing radiation can damage DNA directly by inducing single-
or double-strand breaks, or indirectly by generating free radicals that subsequently react
with DNA [6-15]. While the ultimate goal of radiation therapy is cell death, cells can
respond to ionizing radiation in three ways: (i) repairing the damage directly; (ii)
undergoing cell cycle-arrest, which can lead to irreversible arrest (called senescence); or
(iii) inducing programmed cell death (apoptosis) [9, 16, 17].
Oxygen plays a significant role in radiation therapy and is believed to act as a
sensitizer for malignant cells to radiation. In contrast, hypoxic cells are often associated
with poor outcomes and tumor recurrence [18-22]. To support the metabolic needs of
cells for oxygen (O2), cells should be no more than 150 – 200 µm away from a capillary
[23-25]. Beyond this distance, cells receive inadequate concentrations of oxygen and
other molecules (e.g., glucose, autocrine factors) [26]. Subpopulations of cells with
varying phenotypes arise in the gradients of molecules that form within the tumor.
Well-oxygenated cells, which are closest to a well-perfused blood vessel, undergo aerobic
the decreased oxygen tensions by switching from aerobic to anaerobic metabolism. This
metabolic switch is mediated by hypoxia-inducible factor (HIF) [27-31], transcription
factors which regulate the expression of genes related to cancer cell survival such as
glycolysis, angiogenesis, and invasion/metastasis [27, 32-34]. Cells that adjust to these
hypoxic conditions in a tumor have also been associated with the ability to resist both
chemotherapy and radiotherapy [19, 22, 34-37]. Elucidating the mechanisms by which
cancer cells survive after radiation therapy is key to discovering novel therapies to
improve outcomes and prevent tumor recurrence for patients undergoing these treatments.
Current in vitro models in radiobiology evaluate cellular response based on
changes in either metabolism or proliferation following exposure to radiation. These
models are either cells grown in 2D as a monolayer, or in 3D as spheroids or embedded
in hydrogel slabs. While 2D cultures are easy to establish experimentally, they fail to
mimic many aspects of a tissue because the cells lack the structural features of a tissue:
the 3D contacts formed between adjacent cells; 3D contacts between cells and the
extracellular matrix; and 3D structural features that limit the mass transport of molecules
(e.g., oxygen, glucose, lactate, and carbon dioxide) within the culture environment [38,
39]. These factors are crucial to the response of cells to chemo- and radio-therapy [40].
Spheroids provide a more realistic 3D microenvironment for cells than monolayer
cultures do because: cells within the spheroids are able to participate in cell-to-cell
interactions, and spheroids can form a diffusion-limited environment in which cells
receive different concentrations of oxygen, other nutrients, or drugs as a function of their
studies with spheroids [41-44]. The analysis of spheroids, however, can be challenging
because: (i) dissociation of the intact spheroid into a suspension of single cells prevents
spatial analysis of the heterogeneity in the spheroid, (ii) histology requires fixation of
cells, thus preventing further culture of these cells, and (iii) the heterogeneity in the size
of the spheroids can affect the reproducibility of the assay (i.e., drug and radiation
assays).
To address the issues in 3D cultures for radiation biology, we adapted Cells-in
Gels-in-Paper, or CiGiP, [45-47] to evaluate the response of cells to increasing doses of ionizing radiation. CiGiP is a 3D cell culture system consisting of a stack of layers of
paper, which are patterned to contain hydrophilic zones surrounded with hydrophobic
borders. Cells suspended in a hydrogel are pipetted into these hydrophilic zones, and can
be cultured in the paper-based scaffolds for prolonged periods of time. CiGiP provides a
culture environment that mimics some of the features of tumor tissues including (i)
cell-cell and cell-cell-ECM interactions, and (ii) 3D structure that influences the transport of
molecules (e.g. oxygen, glucose, proteins and other waste products); these aspects are
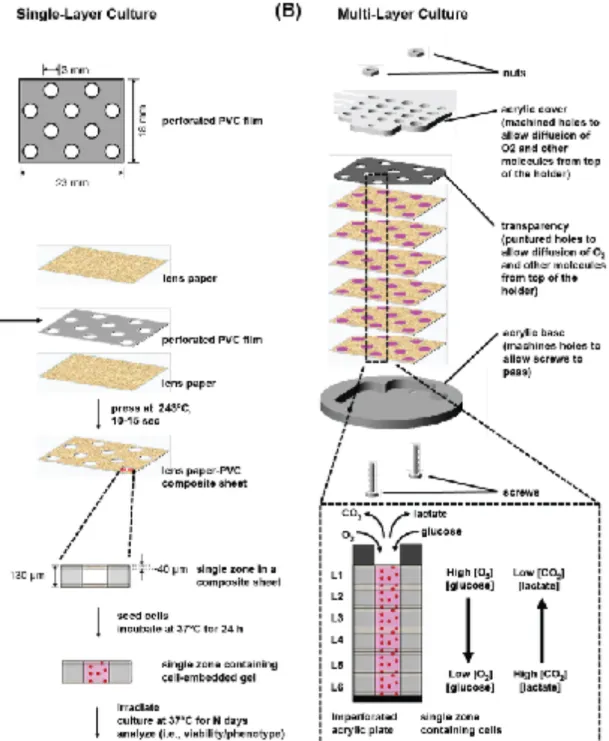
crucial to the viability of cells [45, 47, 48]. We used sheets of a paper-plastic construct
with a thickness of ~130 µm (Fig. 1A) to support the cell-laden gels. The sheets were
stacked to form thick (~800 µm), tissue-like constructs, which were placed in an acrylic
holder. The geometry of the holder allowed us to control access of fresh medium (e.g.,
oxygen, glucose, other nutrients) to the stack, thus generating monotonically decreasing
gradients—from top to bottom of the stack—not only of these nutrients, but also of the
the CiGiP system we used in this study forms an environment that mimics two features of
a poorly vascularized tumor in vivo: (i) Cells at the top of the stack are proximal to the
region of the holder containing a series of holes, which provide access to the source of
fresh medium; these cells experience an environment similar to cells in a tumor that are
near a blood vessel (i.e., in a normoxic environment). (ii) Cells at the bottom of the stack
do not have access to fresh medium; these cells experience an environment similar to
cells in a region of a tumor that is far from a blood vessel (i.e., in a hypoxic
environment). Isolation of the cells from the different regions of this tumor model do not
require histological sectioning–layers can be de-stacked at the end of an experiment
simply by peeling apart the layers of paper; this ability allows us to evaluate a variety of
phenotypes of the cells as a function of the distance from the source of medium (in ~130–
µm increments, based on the thickness of each sheet in the stack), and hence the
distance-dependent gradients (e.g., oxygen, nutrients, growth factors, waste products) formed in
the stack. In this work, we used multi-layer 3D culture to demonstrate that the
radiosensitivity of cells is driven by proliferation rate.
2. Materials and Methods
2. 1. Materials and Reagents
Polvinyl sheets with a thickness of ~130 µm were obtained from Warp Bros.
(Chicago, IL). Whatman 105 lens paper with a thickness of ~ 40 µm was purchased from
GE Healthcare Biosciences (Pittsburgh, PA). Poly(methyl methacrylate) (PMMA) were
holders used in this work. We purchased the A549 cells from American Type and Culture
Collection (Manasas, VA). Supplies for cell culture and cell labeling such as Dulbecco’s
Modified Eagle Medium (DMEM), penicillin-streptomycin, TrypLETM Express, and
Click-iT® EdU were purchased mostly from Life Technologies (Grand Island, NY). Fetal
bovine serum (FBS) was purchased from HyClone (Logan, Utah), Matrigel (growth
factor-reduced) was purchased from Corning (Tewksbury, MA), and RIPA buffer was
purchased from Teknova (Hollister, CA). For immunoblotting, primary antibodies were
purchased from Cell Signaling Technologies (Danvers, MA) and R&D Systems
(Minneapolis, MN); secondary antibodies and Odyssey® blocking buffer were purchased
from LI-COR Biosciences (Lincoln, Nebraska).
2.2. Fabrication of PVC-lens paper composite sheets
We used a Graphtec Craft ROBO Pro craft cutter (Irvine, CA) to cut the design in
the sheets of polyvinyl chloride (PVC); the pattern containing perforations (~ 3 mm in
diameter) was designed in Illustrator C4 (Adobe) and is available upon request. We used
a heat press to melt and sandwich the patterned sheet of polyvinyl chloride (PVC)
between two sheets of Whatman 105 lens paper (Fig. 1A). We pressed the sheets together
at 215 °C in three to four cycles of 10-15 seconds to form a single composite sheet (See
Fig. S-1). The thickness of the single-layer composite sheet is ~130 um. We routinely
patterned the composites to contain ten 3-mm holes, which are referred to as the “zones”
autoclaved composites were air-dried in a laminar flow hood, exposed to UV light for 1
hour, and then stored in a sealed sterile container.
2. 3. Cell culture conditions and seeding of cells into the composite sheets
We cultured all cell lines in vented tissue culture flasks in DMEM with 5% FBS
and 1% Penicillin-Streptomycin and then passaged them every 4-6 days until use. Unless
stated otherwise, the cultures were maintained in 5% CO2 at 37°C. For each experiment,
we detached the cells from the flasks by treatment with TrypLETM Express (5mins at
37°C), washed them in media, and then pelleted them by centrifugation at 1500 rpm. We
prepared a suspension of cells with cold Matrigel (4°C) at a concentration of 2,000 cells/
µL, unless stated otherwise. The suspension was kept on ice to avoid the gelling of
Matrigel. We spotted 1 µL of the suspension into each zone of the composite with a
micropipette and then incubated the composite into a 6-well plate containing warm
(37°C) media. The cold suspension wicks into the composite, fills up the zone, and then
forms a gel upon warming (37°C) in media. To ensure that the Matrigel gelled
completely, and that the cells recovered from being in a cold temperature, we incubated
the sheets with zones containing cell-embedded gels for at least 12 hours before
conducting further experiments such as stacking or exposure to radiation.
2.4. Fabrication of the PMMA holder and stacking of cell-containing composite sheets
The PMMA holders comprised of a perforated top piece with holes that
base, were custom machined (Figure S-1). Both pieces of the holders were also equipped
with threaded holes to fit screws, which not only guide the alignment of the individual
sheets of the composite, but also ensure the sheets are held in place after stacking. The
holders were placed in a glass petri dish and autoclaved. The holders were dried in a
laminar flow hood and kept in a sealed container until use.
Using the PMMA holder, we stacked the six sheets of the composite to prepare a
multi-layer 3D culture. We then incubated these multi-layer cultures in petri dishes
containing (37 °C) warm media. To ensure that the medium covered the top of the
multi-layer culture completely, we used a tip of the micropipette to remove any air bubbles,
which formed on top of the holders during stacking. Unless stated otherwise, we
incubated the multi-layer cultures for at least four days before irradiation to ensure a
gradient in oxygen and nutrients formed within the stack.
2.5. Irradiation
The samples were exposed to ionizing radiation using a GammaCell 40 Extractor
Cesium-137 irradiator, which emits radiation at the rate of 1Gy·min-1 (Best Theratonics,
Ontario, Canada ). The irradiated samples were incubated for an additional 6 to 7 days
before measurement of metabolic activity, senescence, and proliferation rates.
2.6. CellTiter-Glo® (CTG) Assay
Multi-layer cultures were de-stacked by disassembling the holder and separating the
temperature), lysed in 1mL RIPA buffer (10 min, at 4°C) on an orbital shaker (at ~160
rpm), and then diluted the lysate (1:10 by volume) with 1X PBS. We transferred the
diluted cell lysate (100 µL/well) into the wells of a black 96-well plate with a clear
bottom. We prepared the CTG reagent by following the manufacturer’s protocol. We
added CTG reagent (100 µL/well) into the wells containing the cellular lysates and
incubated them for 20 minutes, and measured the luminescence of the samples using a
Perkin Elmer Wallac Luminometer (Waltham, MA), or a BMG Labtech PHERAstar FS
microplate reader (Ortenberg, Germany). For each scaffold, we took eight measurements
(i.e., n = 8 wells) for CTG assay, calculated the average luminescence, and used this
average value in calculating for the % metabolic activity.
2.7. Senescence Assay
We recovered A549-GFP cells from the composite sheets by incubating the
samples in warm (37°C) Accumax for 30-45 minutes. Accumax degrades the Matrigel,
and releases the cells from the paper into the Accumax solution. The cells were pelleted
by centrifugation (~1500 rpm), and resuspended in culture medium (10,000 A549-GFP
cells/mL). We dispensed the resuspended cells into the wells of a 96-well plate (100 µL/
well) and cultured them overnight. We stained the senescent cells using Millipore
Cellular Senescence Assay Kit (Cat. KA002). Following the manufacturer’s suggested
protocol, we aspirated the media out of the wells, washed the wells in 1X PBS (5 min),
incubated the cells in the provided fixative solution (diluted to 1X, 15 min), washed the
-galactosidase staining solution in a CO2-free incubator (24 hours at 37°C). We aspirated
the staining solution and then washed the wells in 1X PBS (5 mins × 3). We collected
images of the samples using a bright field microscope and counted all the senescent cells,
which stained blue. We also collected images of the cells using a fluorescence microscope
and counted the total number of cells, which expressed GFP.
2.8. Proliferation Assay
We used Click-iT® EdU kit to label A549-GFP cells undergoing proliferation. In
brief, we incubated the composite sheets in culture medium containing 10 µM EdU
solution (24 hours at 37°C and 5% CO2). The EdU-labeled samples were then fixed with
4% paraformaldehyde for 20 minutes, washed with 3% (v/v) BSA in 1X PBS (5 mins ×
3), incubated in 0.5% (v/v) Triton X-100 (20 mins), washed with 3% (v/v) BSA in 1X
PBS (5 mins × 3), and incubated in Click-iT® reaction cocktail for 30 minutes. The
Click-iT® reaction cocktail, which contained Alexa Fluor® 594-conjugated azide, 4 mM copper
(II) sulfate was prepared based on manufacturer’s suggested protocol. The samples were
washed once with 3% BSA in 1X PBS (5 min) and kept in 1X PBS (4°C). The composite
sheets containing labeled cells were scanned with a Typhoon Gel Scanner. EdU was
scanned using LPG filter, 532 nm (excitation) / 615 nm (emission), PMT value of 400 V,
and resolution of 50 µm; GFP was scanned using 590 nm (excitation)/615(emission),
PMT value of 400 V, and resolution of 50 µm; GFP was scanned using BPB1 filter, 473
2.9. Western Blot
Multi-layer cultures were de-stacked by disassembling the holder and separating
the sheets with tweezers. Each sheet was washed in 1X PBS (5 min, room temperature)
and then lysed in 500 µL RIPA buffer (30 min, at 4°C) on an orbital shaker (at ~160 rpm).
We quantified the total protein content for each lysate using (bicichoninic acid) BCA
Assay, following manufacturer’s protocol. For each sample, we prepared the protein
solution containing approximately 0.5 µg/µL protein, 1X NuPAGE® sample reducing
buffer, and 1X NuPAGE® LDS sample buffer in 1X PBS. We heated the protein solutions
at 100°C for 10 mins and centrifuged them at 10,000 rpm (10 min at °C). We loaded 20
µL of the protein solution per lane in a NuPAGE® 4-12% Bis-Tris Gel and ran the gels
with 1X NuPAGE® MOPS SDS Running Buffer. The proteins were transferred
electrophoretically from the gel to a Bio-Rad Trans-Blot® TurboTM 0.2µm PVDF transfer
membrane using a Bio-Rad Trans-Blot® TurboTM transfer system. We blocked the
membranes with an Odyssey blocking buffer for 1h, incubated them in the primary
antibody solution containing anti-HIF-1α (diluted 1:1000), anti-CAIX (diluted to 1:200)
anti-GAPDH (diluted 1:1000) in blocking buffer (overnight at 4°C) on a slow rocking
platform. We washed the membranes containing the labeled bands with TBST (5 min × 3)
and incubated them in the secondary antibody solution containing IR Dye 680-conjugated
donkey anti-rabbit IgG (diluted 1:10,000) in blocking buffer (1 hour at 20°C). We imaged
the membranes using Odyssey CLX (LI-COR Biosciences) and analyzed them using
2.10. Immunoassay for Quantification of Levels in Cells
We seeded A549, A549-HGF, or A549-HGF-M cells into black-walled 96-well
plates with clear bottom at 2,000 cells/ well, and cultured overnight. We assayed the HGF
levels using a Quantikine® ELISA from R&D Systems which utilized a sandwich
immunoassay method, and followed the protocol recommended by the manufacturer. The
HGF microplate (i.e., a well plate pre-coated with monoclonal antibodies specific to
human HGF), assay diluent, wash buffer, HGF conjugate (polyclonal antibody specific to
HGF conjugated to horseradish peroxidase), substrate solution (solution of horseradish
peroxidase and chromogen tetramethylbenzdine) and stop buffer (2N sulfuric acid) were
all included in the kit. In brief, we transferred 50 µL of the media into the microplates
(HGF microplate) containing 150 µL assay diluent, incubated the media in the microplate
for two hours, washed the microplate with wash buffer four times, added the HGF
conjugate into the HGF microplate for two hours, washed the microplates four times,
incubated in substrate solution for 30 minutes, then added the stop solution. If the culture
medium contained HGF, the color of the solution in the microplate changes from blue to
yellow. The absorbance of the solutions was measured using Spectramax at 450 nm. The
absorbance read at 450 nm was corrected by subtracting the absorbance at 540 nm to
account for the optical imperfections of the well plate. The HGF concentration was
calculated from the best-fit line obtained from a standard curve.
3.1 Design of Paper-Based Composite to Support 3D Culture
Previously described scaffolds in the Cells-in-Gels-in-Paper (CiGiP) [46, 49-51] and Cells-in-Gels-in-Mesh (CiGiM) [48] culture systems used sheets of paper (or mesh) that were patterned to contain an array of hydrophilic regions separated by hydrophobic
borders. In this work, we used a scaffold that requires fewer steps to fabricate than the
paraffin film-patterned mesh sheet, but has a hydrophobic barrier that prevents the lateral
diffusion of oxygen more efficiently than wax-printed paper [46, 48]. We fabricated a
composite material by sandwiching a ~130 µm-thick sheet of polyvinyl chloride (PVC),
perforated with an array of holes (3 mm in diameter), between two sheets of Whatman
105 lens paper (Fig. 1A). We chose sheets of lens paper because it is thin (~ 40 µm in
thickness) and contains a large void volume (~70 %). Using a heated press (~215°C), we
melted the PVC plastic into the paper layers to form a single composite sheet. The
perforated spaces in the PVC formed cylindrical regions (referred to as “zones”) in which
we seeded the cells. We routinely patterned the composites to contain ten zones; these
zones allowed for replicates in a single experiment, and provided a convenient means of
aligning the cell-embedded gels during the stacking process. We sterilized the composite
sheets using an autoclave.
3.2. Modulation of Oxygen Availability in Cells Supported on Composite Sheets
Gradients of nutrients (e.g., oxygen, glucose), waste products (e.g., CO2, lactate),
and secreted factors form monotonic gradients in the individual layers and throughout the
which cells in each layer consume the available nutrients and produce waste products; (ii)
the number of layers in the stack determines the characteristic thickness over which the
transport of molecules will occur; and (iii) the rate of diffusion of molecules into the
sheets (from medium, or from adjacent layers) by diffusive mass transport [52]. In a
single-layer composite sheet (Fig. 1A) cells receive adequate amounts of oxygen and
nutrients because molecules can diffuse efficiently from the bulk medium into the zones
of the composite from both sides of the layer. This configuration, which we refer to as
“single-layer culture” (Fig. 1A), is comparable to the region of the tumor near a
functional blood vessel and contains well-oxygenated cells. In a stack of composite
sheets containing cell-embedded gels, a custom-built acrylic holder keeps the sheets in
conformal contact. The holder consists of two main parts: (i) a solid bottom plate, which
blocks the mass transport of soluble factors at the bottom of the stack; and (ii) the top
plate, which was machined with an array of holes corresponding to the zones in the
composite. The top plate provides access of the oxygenated media to the top of the stack.
In this work, we prepared multi-layer stacks of six composite sheets, each containing
cell-embedded gels. For convenience, we refer to these layers as L1, L2, L3, L4, L5, and
L6, where L1 is the topmost layer, and is in contact with the oxygenated media. We refer
to cultures in this multiple layer configuration as “multi-layer cultures” (Fig 1B).
3.3. Sensitivity to Radiation Decreases with Increasing Cellular Densities
To determine if the density of cells in single-layer cultures affects their response
densities, exposed them to ionizing radiation, and measured the reduction in metabolic
activities of the samples as a result of irradiation. We seeded each zone by spotting the
suspensions of cells in Matrigel with a micropipette onto the top sheet of lens paper and
allowing the suspension to wick into the entire scaffold; zones contained concentrations
of A549 cells ranging from 2,000 cells/zone to 80,000 cells/zone. We cultured the cells
overnight and irradiated these samples with doses ranging from 0 to 16 Gray in a
cesium-137 irradiator. One Gray (Gy) is a measure of absorbed dose of radiation in the
international system (SI) of units, and is defined as the amount of energy absorbed by a
kilogram of matter in J kg-1; for an irradiator delivering a dosage of 1 Gy · min-1, we
exposed samples for either 2 or 16 mins to receive dosages of 2 Gy or 16 Gy,
respectively. We measured the metabolic activity of the cells six days post-irradiation
using the CellTiter-Glo® (CTG) assay, which quantifies the level of ATP present in cells
[53]. The sensitivity of cells to radiation (Eq 1 and 2) decreased with increasing seeding
density of cells (Fig. 2A). We compared the metabolic activities of an irradiated sample
and a non-irradiated sample; the zones in both samples were seeded at the same densities.
Six days post-irradiation, the metabolic activity of samples seeded at 2,000 cells/zone
decreased by up to 81% (values ranged from 78% to 85% for n = 3 scaffolds) when
irradiated with 16 Gy. The metabolic activity of samples seeded at a density of 80,000
cells/zone irradiated with the same dose decreased by less than 29% (values ranged from
26% to 35% for n = 3 scaffolds). These results suggest cells seeded at higher densities are
more resistant to radiation and single-layer cultures can accommodate high seeding
3.4. Increases in Cellular Density Decrease Cellular Proliferation
Exposure to ionizing radiation can damage DNA [3, 6, 7, 54, 55], and the
continued replication of unrepaired and defective DNA can result in cellular death [55].
We hypothesized that the reduced sensitivity of cells to radiation for increasing seeding
densities correlated with the rate in which these cells proliferate. To test this hypothesis,
we seeded A549 cells at a density of 2,000 cells/zone or 100,000 cells/zone in the
single-layer composite sheets, and cultured the single-layers for seven days. We then incubated the
samples in media containing 5-ethynyl-2´-deoxyuridine (EdU), a thymidine analog that
intercalates into the DNA of cells undergoing replication [56], to label proliferating cells.
We then fixed and visualized the EdU–labeled cells with Alexa Fluor® 488-conjugated
azide [56]. Confocal fluorescence micrographs (Fig. 2B) revealed a higher fraction of
proliferating cells in single-layer cultures seeded at low density than those seeded at high
densities. This result is consistent with the hypothesis that radiation-induced damage to
cells can be enhanced by increasing the population of cells undergoing proliferation.
3.5. Radiation-Resistant Cells in Oxygen-Rich Environments are Mostly
There are at least two possible explanations for the metabolically active cells that
remain after irradiation with as much as 16 Gy: (i) the surviving cells were senescent at
the time of irradiation, or became senescent after irradiation [57], or (ii) the surviving
cells retain properties of “cancer stem cells” that allow them to repair DNA damage
during irradiation [58-61]. To characterize cells appearing to survive high doses of
radiation in well-oxygenated (i.e., single-layer) cultures, we cultured A549-GFP in
single-layer composites (seeded at 2,000 cells/zone) overnight, irradiated them with doses
ranging from 0 to 16 Gy, and then incubated the irradiated cells with either (i) EdU, or
(ii) X-Gal (5-bromo-chloro-3-indolyl-β-D-galactopyranoside), a chromogenic substrate
for β-galactosidase, a marker of senescent cells.
3.5.1 Most of the surviving cells do not proliferate
To approximate the ratio of the number of proliferating cells to the total number
of cells that survived irradiation, we compared the fluorescence intensities of
EdU-labeled cells (proliferating A549 cells) and GFP (surviving A549 cells). The graph in Fig.
2C shows this ratio decreased with higher dosages of radiation. This result indicates that
the surviving cells in the cultures exposed to at least 8 Gy were non-proliferating, or that
they have lost their ability to proliferate.
3.5.2. Most of the surviving cells are senescent
To determine if the surviving cells were senescent, we incubated the cells in
galactosidase, a senescence-associated enzyme, to generate a by-product that readily
dimerizes to form a blue precipitate [62]. Counting blue-colored cells in the single-layer
scaffolds can be difficult with bright-field microscopy [45, 48] because the cellulose
fibers of the paper layers scatter light. To count the number of senescent cells more
accurately, we recovered the cells from the paper by enzymatically degrading the
Matrigel with Accumax, resuspending the cells in media, and dispensing the suspension
of cells into 96-well plates (1,000 cells/zone). We then cultured the recovered cells for 48
hours before staining with X-Gal. Fluorescence and bright-field images (Fig. 2D) showed
two indications that a fraction of cells were senescent [62, 63]. (i) The fraction of X-gal
positive cells increased with increasing dosage of radiation. The graph in Fig. 2D
indicates that the number of senescent cells (i.e., % XGal positive cells) increased with
increasing radiation dosage; the average fraction of senescent cells increased from 8 %
(values ranged from 5 % to 18 % for n = 3 scaffolds) in non-irradiated cultures to 82 %
(values ranged from 72 % to 83 % for n = 3 scaffolds) in cultures irradiated at 16 Gy. (ii)
The size of the cells increased with radiation dosage, also indicating a senescent
phenotype (Fig. 2D) [62, 63]. The majority of cells that survived radiation dosages of at
least 8 Gy, therefore, were senescent. Although this result does not preclude the presence
of a subpopulation of cancer stem cells, the existence of this subpopulation was not
experimentally validated.
3.6. The Availability of Oxygen and Nutrients Influence Radiation Sensitivity in
To determine if cells cultured in layers of the multi-layer stack have different
sensitivities to irradiation, we assembled in parallel two sets of 3D cell culture in stacks
—one set of irradiated stacks (i.e., treated stacks), and one set of non-irradiated stacks
(i.e, control stacks), irradiated the stacks, and measured the reduction in the metabolic
activities of each layer of the stacks as a result of irradiation. We prepared each stack by
seeding 2,000 A549 cells/zone in the composite sheets, culturing the sheets overnight as
single layers, and then assembling multi-layer stacks composed of six layers. We cultured
the stacks for four days (Fig. 3A) before exposing the treated stacks with 8 Gy to ensure a
gradient of oxygen formed in the stacks. Each stack was cultured for an additional seven
days post-irradiation before they were de-stacked and analyzed using CTG assay (Fig
3B). Unless stated otherwise, radiation experiments for all multi-layer cultures were
carried out as described above.
We evaluated the radiation response of cells in the stacks by comparing the
metabolic activity of each layer from the irradiated stack with its corresponding layer
from the non-irradiated stack (e.g., we compared the number of metabolically-active cells
from L1 of the irradiated stack with the number of metabolically-active cells from L1 of
the non-irradiated stack). The reduction in metabolic activity in layers that responded to
radiation was calculated using Equations 2 and 3.
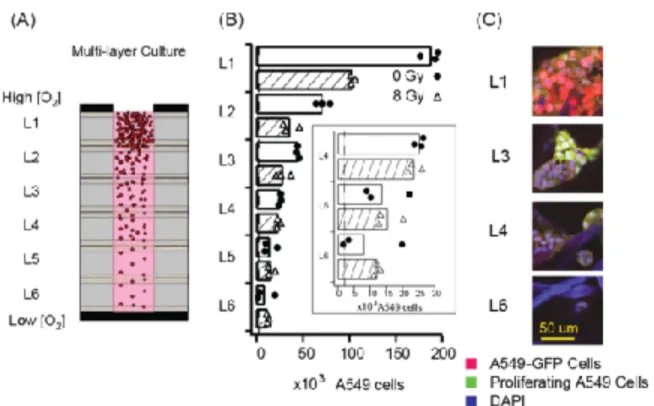
We found that the metabolic activity of cells in layers closest to the source of
stack did not decrease (Fig. 3B). The metabolic activity of the cells in L1 and L2
decreased by 48% (values ranged from 35 % to 59 % for n = 6 scaffolds). The metabolic
activity in L3 decreased by 37% (values ranged from 17 % to 52% for n = 3 scaffolds).
No significant decrease was observed in L4 and L5. The responsiveness of the cells in L6
to irradiation is unclear because the mean is smaller than about twice the standard error
(i.e., 1.96 × standard error) for L6 of the non-irradiated stack (Table S-1a)[64]. These
results are consistent with the response observed in solid tumors in vivo: cells in close
proximity to blood vessels (i.e., < 200 µm) respond to radiation, and cells residing
beyond this distance, which is believed to be a hypoxic environment, are likely
insensitive to irradiation [32, 65-67].
We hypothesize the insensitivity of these cells to radiation is due to decreased
proliferation caused by the deprivation of oxygen: cells in the uppermost layers
consumed most of the oxygen diffusing into the stack, and consequently, deprived cells in
the lower layers of the stack of the oxygen required to support proliferation. To verify this
hypothesis, we labeled the proliferating cells with EdU in the non-irradiated multi-layer
culture of A549-GFP cells after 11 days of culture. Confocal images of the stained layers
showed qualitatively a similar observation; the proliferation of cells is highest in L1 and
is lowest in L6 (Fig 3C).
3.7. Hypoxia Markers Expressed in Cells Increases with the Distance of Cells from the
Our irradiation data for the multi-layer stacks showed that the sensitivity of cells
to ionizing radiation decreased with increasing distance from the source of the
oxygenated medium. To verify the cells were experiencing different oxygen tensions, we
measured the expression of two markers for hypoxia in each of the six layers of the
multi-layer 3D culture: (i) hydroxy-HIF-1α, the predominant form of HIF-1α in cells when
oxygenated (upon de-stacking) [68], and (ii) carbonic anhydrase 9 (CAIX), a HIF-1
inducible protein [69-71]. We stacked six sheets of lens paper-PVC composite containing
overnight cultures of A549 (seeded at 2,000 A549 cells/zone) in an acrylic holder,
cultured the stack for 4 days, disassembled the stacks into separate layers, and analyzed
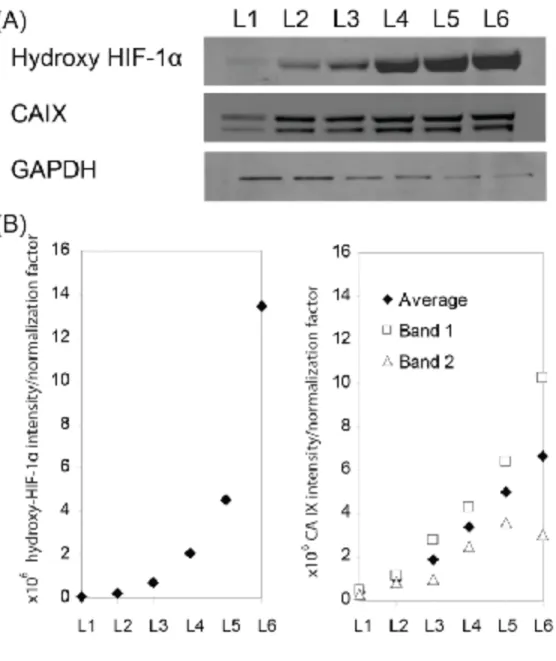
lysates for expression of hydroxy-HIF-1α and CAIX. To account for differences in total
protein content in each lysate, we used glyceraldehyde 3-phosphate dehydrogenase
(GAPDH) as a control to normalize the signal of hydroxy-HIF-1α and CAIX to the total
protein content. Table S-3 lists the brand and specificity of primary antibodies, and the
secondary antibody used for immunoblotting. Images of the membrane from the Western
blot showed an increase in the intensity of hydroxy-HIF-1α and CAIX band from L1 to
L6 (Fig. 4A). The ratio of the intensities of the bands of hydroxy-HIF-1α to GAPDH also
increased from L1 to L6 (Fig. 4B). These results support our assumptions about
multi-layer 3D cultures when nutrients, oxygen specifically, can only diffuse from one side of
the cultures: The cells receive decreasing levels of oxygen, resulting in lower rates of
proliferation than the cells receiving adequate oxygen, and therefore show resistance to
3.8. Multi-layer Cultures Provide a System that can Distinguish Differences in
Radiation Response of Cell Lines that Secrete Different Levels of Hepatocyte Growth
Factor
We compared the radiation sensitivity of three isogenic cell lines, the parental
A549 cell line and two variants expressing different levels of hepatocyte growth factor
(HGF): A549 cells that overexpress HGF (A549-HGF), and a sub-clone of A549-HGF
cells that was collected from a metastatic tumor in the lung of a xenografted mouse
(A549-HGF-M). The parental A549 cells is known to be less metastatic in vivo than the
other two A549 variants [49]. Using sandwich-based ELISA, we found that the A549
parental cell line did not secrete a detectable level of HGF, while both A549-HGF and
A549-HGF-M secreted significant levels of HGF (Table 1). HGF is known to increase
cellular migration and proliferation [72, 73]. When cultured in a monolayer (Fig. 5A) or
when cultured in a single-layer composite sheet (Fig. 5B), the three lines of A549 cells
responded similarly to increasing dosages of radiation.
We prepared two sets of stacks for each cell line; one set was irradiated, and
another set was not irradiated. We compared the metabolic activity of each layer of the
stack seven days post-irradiation. Response to radiation is indicated by the reduction in
the viability in the layer of the irradiated stack from its corresponding layer of the
non-irradiated stack. When cultured in the multi-layer stacks, cells that released the most HGF
responded the least to irradiation (Fig. 5C): (i) A549-HGF-M cells, independent of their
location in the stack, have no clear response to radiation (Tables S-2e,f); (ii) A549-HGF
media) with 18 % in reduction in metabolic activity (ranging from 13 % to 30 % for n =3
scaffolds) (Tables S-2c,d) ; and (iii) wild-type A549 cells have a clear response in L1
through L3 (a distance of ~400 µm away from the source of fresh media) (Tables S-2a,b).
We hypothesized that the different HGF levels in the three cell lines attributed to the
observed differences in radiosensitivity by affecting the proliferation or migration rate of
the cells.
To better understand the effects of migration and proliferation during culture, we
analyzed the irradiated multi-layer stacks of A549-HGF-M at shorter time-points. The
metabolic activity of cells in the upper layers showed an observable decrease in viability,
two days and four days post-irradiation (Fig. 6A); and by day six post-irradiation, the
number of viable cells in each layer of the stack matches that of a stack that was not
irradiated. These results support our hypothesis that after irradiation, cells can repopulate
by proliferating rapidly, and/or migrating from the lower layers of the stack to the upper
layers of the stack; both events might account for the apparent unresponsiveness of
A549-HGF-M cells to radiation seven days after irradiation.
To decouple the contribution of migration from proliferation in multi-layer
cultures of A549-HGF-M cells, we separated the layers with sheets of polycarbonate
filters with 0.20 µm diameter pores; these pores prevented the migration of cells to
adjacent layers during culture, but allowed diffusion of molecules (e.g., oxygen and
glucose) into the stack. The graph in Fig. 6B indicates that blocking migration does not
we observed in long-term cultures of A549-HGF-M cells was due to proliferation, and
not migration.
These results, therefore, demonstrate that multi-layer cultures can serve as an in
vitro system for studying biological processes such as radiation response, while taking
into account factors that are native to tumor biology such as limitations of mass transport
and migration of cells.
4. Discussion
The paper-based cell culture system we describe in this work offers many
advantages over the monolayer or spheroid cultures currently used in radiation studies
because: (i) millimeter-thick cultures can be generated by simply stacking the single-layer
composite sheets; (ii) cells in the different layers of the culture can receive a gradient in
nutrients, waste products, and drugs by restricting the diffusion of media from one side of
the stack; (iii) each sheet in the stack can contain different types of cells and/or gels; (iv)
the multi-layer stack can be sectioned easily by peeling the layers apart and does not
require histology equipment; (v) the separated sheets can be analyzed optically or through
the use of enzymatic assays; and (vi) the sheets can be patterned using the fabrication
method described above to create multi-zone patterns that can be adapted for
high-throughput assays [46, 48, 51].
Using this system, we were able to demonstrate in vitro, that decreasing levels of
oxygen can reduce the proliferation of non-small cell lung cancer cells, and consequently,
hypoxia-inducible factor and CAIX with increasing distance from the source of oxygen
and media can also be observed in this system; a trend also observed in tumors in vivo.
Since HIF-1α in re-oxygenated tumors only has a half-life of less than one minute [74],
and cells within the stacks get re-oxygenated upon de-stacking, we expect that most of
the HIF-1α expressed in cells, even at the lower regions were hydroxylated [68]. It is
therefore not surprising that the expression of hydroxy-HIF-1α is lowest in L1, and
highest in L6, as HIF-1α is targeted for degradation following hydroxylation and
ubiquitination [27-30]. These results are in agreement with the widely held view that
gradients of oxygen present in a tumor directly affect the sensitivity of the cells to
radiation, but emphasize that the presence of these oxygen gradients are as, if not more,
influential post-treatment than during treatment.
The current disadvantage of the system is that any kind of analysis requires the
system to be disassembled, and consequently the gradients in the stack to be destroyed, if
multiple measurements are taken over time. Incorporating sensors into the layers, for
example, printing electrodes to measure oxygen concentration or pH, can be an approach
to monitor cellular activities in the different layers without disassembling the stack, and
hence keeping the fidelity of the molecular gradients formed in the stack. Integrating a
sensing system to the 3D culture system that could quantify oxygen concentration within
the stack will enable direct assessment of the influence of oxygen levels on cellular
phenotype.
We believe this approach can be further used to evaluate the response of different
in the rates of proliferation and migration of the cells within the population. The
dynamics would be particularly interesting when studying the heterogeneous populations
of cells found in the tumor environment (e.g., cancer stem cells and stromal cells). For
example, we have used paper-based 3D culture to model an orthogonal system—cardiac
ischemia, and study the interactions that arise between cardiomyocytes and cardiac
fibroblasts [47]. The study of the interaction between tumor cells with stromal cells,
co-cultured in this multi-layer culture system, is among our group’s current work. We
believe this system also has the potential to be used as an in vitro assay for evaluating
drugs that target hypoxic cells, or to evaluate the resistance of cells to radiation over long
periods (i.e., weeks) post-treatment.
5. Conclusion
This work describes a paper-based 3D culture system that can distinguish the
sensitivity of cells to ionizing radiation, within gradients of small molecules of oxygen,
nutrients, and autocrine factors, using a single setup. These gradients are also present in
tumors in vivo, and recapitulating these factors in vitro, may more accurately predict
tumor response to therapeutic treatments than conventional 2D and 3D culture systems.
Using this system, we were able to demonstrate in vitro that cellular proliferation,
and sensitivity to radiation decrease with monotonically-decreasing gradients of oxygen
and nutrients. This system therefore provides a unique ability to evaluate and distinguish
the response of different cellular populations—rather than measure one collective cellular
required equipment, will enable users from a broad-range of disciplines to adopt this
technology in their own radiation studies.
Acknowledgements
This work was funded in part by Vertex Pharmaceuticals Incorporated. We thank
References
[1] Cancer Facts and Figures 2014. In: Society AC, editor. Atlanta: American Cancer Society; 2014.
[2] Jemal A, Siegel R, Ward E, Murray T, Xu J, Smigal C, et al. Cancer statistics, 2006. CA Cancer J Clin. 2006;56:106-30.
[3] Jackson SP, Bartek J. The DNA-damage response in human biology and disease. Nature. 2009;461:1071-8.
[4] Begg AC, Stewart FA, Vens C. Strategies to improve radiotherapy with targeted drugs. Nat Rev Cancer. 2011;11:239-53.
[5] Barnett GC, West CML, Dunning AM, Elliott RM, Coles CE, Pharoah PDP, et al. Normal tissue reactions to radiotherapy: towards tailoring treatment dose by genotype. Nat Rev Cancer. 2009;9:134-42.
[6] Pouget JP, Douki T, Richard MJ, Cadet J. DNA damage induced in cells by gamma and UVA radiation as measured by HPLC/GC-MS and HPLC-EC and Comet assay. Chem Res Toxicol. 2000;13:541-9.
[7] Ward JF. DNA damage produced by ionizing radiation in mammalian cells: identities, mechanisms of formation, and reparability. Prog Nucleic Acid Res Mol Biol. 1988;35:95-125.
[8] Biaglow JE. The effects of ionizing radiation on mammalian cells. J Chem Educ. 1981;58:144.
[9] Houtgraaf Jaco H, Versmissen J, van der Giessen Wim J. A concise review of DNA damage checkpoints and repair in mammalian cells. Cardiovasc Revasc Med. 2006;7:165-72.
[10] Schuller P, Puttmann S, Mucke R, Senner V, Schafer U, Kisters K, et al. From the radiolysis of water to the role of trace elements in radiobiology and clinical radiation therapy: Following a logical chain. Trace Elem Electrolytes.
2001;18:186-92.
[11] Anastassopoulou J. Free radicals in biology and medicine. Asian Chem Lett. 1998;2:1-6.
[12] Jeggo P, Lavin MF. Cellular radiosensitivity: How much better do we understand it? Int J Radiat Biol. 2009;85:1061-81.
[13] Lieber MR. Pathological and physiological double-strand breaks: Roles in cancer, aging, and the immune system. Am J Pathol. 1998;153:1323-32.
[14] Reiter RJ, Guerrero JM, Garcia JJ, Acuna-Castroviejo D. Reactive oxygen intermediates, molecular damage, and aging; relation to melatonin. Ann N Y Acad Sci. 1998;854:410-24.
[15] Valerie K, Yacoub A, Hagan MP, Curiel DT, Fisher PB, Grant S, et al. Radiation-induced cell signaling: inside-out and outside-in. Molecular Cancer Therapeutics. 2007;6:789-801.
[17] Lans H, Marteijn JA, Vermeulen W. ATP-dependent chromatin remodeling in the DNA-damage response. Epigenetics Chromatin. 2012;5:4.
[18] Brown JM, Giaccia AJ. The unique physiology of solid tumors: opportunities (and problems) for cancer therapy. Cancer Res. 1998;58:1408-16.
[19] Brown JM, Wilson WR. Exploiting tumour hypoxia in cancer treatment. Nat Rev Cancer. 2004;4:437-47.
[20] Harrison LB, Chadha M, Hill RJ, Hu K, Shasha D. Impact of Tumor Hypoxia and Anemia on Radiation Therapy Outcomes. Oncologist. 2002;7:492-508.
[21] Harada H. How Can We Overcome Tumor Hypoxia in Radiation Therapy? J Radiat Res (Tokyo). 2011;52:545-56.
[22] Nordsmark M, Overgaard M, Overgaard J. Pretreatment oxygenation predicts radiation response in advanced squamous cell carcinoma of the head and neck. Radiother Oncol. 1996;41:31-9.
[23] Thomlinson RH, Gray LH. The histological structure of some human lung cancers and the possible implications for radiotherapy. Br J Cancer. 1955;9:539-49. [24] Groebe K, Vaupel P. Evaluation of oxygen diffusion distances in human breast cancer xenografts using tumor-specific in vivo data: role of various mechanisms in the development of tumor hypoxia. Int J Radiat Oncol Biol Phys. 1988;15:691-7. [25] Schumacker PT, Samsel RW. Analysis of oxygen delivery and uptake
relationships in the Krogh tissue model. J Appl Physiol. 1989;67:1234-44. [26] Hanahan D, Weinberg RA. The hallmarks of cancer. Cell. 2000;100:57-70. [27] Semenza GL. HIF-1: upstream and downstream of cancer metabolism. Curr Opin Genet Dev. 2010;20:51.
[28] Hirota K, Semenza GL. Regulation of hypoxia-inducible factor 1 by prolyl and asparaginyl hydroxylases. Biochem Biophys Res Commun. 2005;338:610-6.
[29] Jaakkola P, Mole DR, Tian Y-M, Wilson MI, Gielbert J, Gaskell SJ, et al. Targeting of HIF-α to the von Hippel-Lindau Ubiquitylation Complex by O2-Regulated Prolyl Hydroxylation. Science. 2001;292:468-72.
[30] Maxwell PH, Wiesener MS, Chang GW, Clifford SC, Vaux EC, Cockman ME, et al. The tumour suppressor protein VHL targets hypoxia-inducible factors for oxygen-dependent proteolysis. Nature. 1999;399:271-5.
[31] Wang GL, Jiang BH, Rue EA, Semenza GL. Hypoxia-inducible factor 1 is a basic-helix-loop-helix-PAS heterodimer regulated by cellular O2 tension. Proc Natl Acad Sci U S A. 1995;92:5510-4.
[32] Tatum JL, Kelloff GJ, Gillies RJ, Arbeit JM, Brown JM, Chao KS, et al. Hypoxia: importance in tumor biology, noninvasive measurement by imaging, and value of its measurement in the management of cancer therapy. Int J Radiat Biol. 2006;82:699-757.
[33] Semenza GL. Tumor metabolism: cancer cells give and take lactate. J Clin Invest. 2008;118:3835-7.
[35] Gray LH, Conger AD, Ebert M, Hornsey S, Scott OC. The concentration of oxygen dissolved in tissues at the time of irradiation as a factor in radiotherapy. Br J Radiol. 1953;26:638-48.
[36] Aebersold DM, Burri P, Beer KT, Laissue J, Djonov V, Greiner RH, et al. Expression of hypoxia-inducible factor-1alpha: a novel predictive and prognostic parameter in the radiotherapy of oropharyngeal cancer. Cancer Res.
2001;61:2911-6.
[37] Vaupel P, Mayer A. Hypoxia in cancer: significance and impact on clinical outcome. Cancer Metastasis Rev. 2007;26:225-39.
[38] Griffith LG, Swartz MA. Capturing complex 3D tissue physiology in vitro. Nat Rev Mol Cell Biol. 2006;7:211-24.
[39] Kim JB. Three-dimensional tissue culture models in cancer biology. Semin Cancer Biol. 2005;15:365-77.
[40] Tung YC, Hsiao AY, Allen SG, Torisawa YS, Ho M, Takayama S.
High-throughput 3D spheroid culture and drug testing using a 384 hanging drop array. Analyst. 2011;136:473-8.
[41] Mehta G, Hsiao Amy Y, Ingram M, Luker Gary D, Takayama S. Opportunities and challenges for use of tumor spheroids as models to test drug delivery and efficacy. J Controlled Release. 2012;164:192-204.
[42] Olive PL, Durand RE. Drug and radiation resistance in spheroids: cell contact and kinetics. Cancer metastasis reviews. 1994;13:121-38.
[43] Weaver EM, Hummon AB. Imaging mass spectrometry: From tissue sections to cell cultures. Adv Drug Del Rev. 2013;65:1039-55.
[44] Minchinton AI, Tannock IF. Drug penetration in solid tumours. Nat Rev Cancer. 2006;6:583-92.
[45] Derda R, Laromaine A, Mammoto A, Tang SKY, Mammoto T, Ingber DE, et al. Paper-supported 3D cell culture for tissue-based bioassays. Proc Natl Acad Sci U S A. 2009;106:18457-62, S/1-S/9.
[46] Derda R, Tang SKY, Laromaine A, Mosadegh B, Hong E, Mwangi M, et al. Multizone paper platform for 3D cell cultures. PLoS One. 2011;6:e18940.
[47] Mosadegh B, Dabiri BE, Lockett MR, Derda R, Campbell P, Parker KK, et al. Three-Dimensional Paper-Based Model for Cardiac Ischemia. Adv Healthc Mater. 2014;3:1036-43.
[48] Simon KA, Park KM, Mosadegh B, Subramaniam AB, Mazzeo AD, Ngo PM, et al. Polymer-based mesh as supports for multi-layered 3D cell culture and assays. Biomaterials. 2014;35:259-68.
[49] Mosadegh B, Lockett MR, Minn KT, Simon KA, Gilbert K, Hillier S, et al. A paper-based invasion assay: Assessing chemotaxis of cancer cells in gradients of oxygen. Biomaterials. 2015;52:262-71.
[51] Deiss F, Matochko WL, Govindasamy N, Lin EY, Derda R. Flow-Through Synthesis on Teflon-Patterned Paper To Produce Peptide Arrays for Cell-Based Assays. Angew Chem, Int Ed. 2014;53:6374-7.
[52] Grodzinsky AJ, Kamm RD, Lauffenburger DA. ‘Quantitative Aspects of Tissue Engineering: Basic Issues in Kinetics Transport and Mechanics: Academic Press, London; 1997.
[53] Crouch SPM, Kozlowski R, Slater KJ, Fletcher J. The use of ATP
bioluminescence as a measure of cell proliferation and cytotoxicity. J Immunol Methods. 1993;160:81-8.
[54] Biaglow JE. The effects of ionizing radiation on mammalian cells. J Chem Educ. 1981;58:144-56.
[55] Cohen-Jonathan E, Bernhard EJ, McKenna WG. How does radiation kill Cells? Curr Opin Chem Biol. 1999;3:77-83.
[56] Salic A, Mitchison TJ. A chemical method for fast and sensitive detection of DNA synthesis in vivo. Proc Natl Acad Sci U S A. 2008;105:2415-20.
[57] Campisi J, d'Adda di Fagagna F. Cellular senescence: when bad things happen to good cells. Nat Rev Mol Cell Biol. 2007;8:729-40.
[58] Baumann M, Krause M, Hill R. Exploring the role of cancer stem cells in radioresistance. Nat Rev Cancer. 2008;8:545-54.
[59] Baumann M. Selective inhibition of the epidermal growth factor tyrosine kinase by BIBX1382BS improves growth delay but not local control after fractionated irradiation in human FaDu squamous cell carcinoma in nude mice. Int J Radiat Biol. 2003;79:1547-559.
[60] Hill RP, Milas L. The proportion of stem cells in murine tumors. Int J Radiat Oncol Biol Phys. 1989;16:513-8.
[61] Al-Hajj M, Wicha MS, Benito-Hernandez A, Morrison SJ, Clarke MF. Prospective identification of tumorigenic breast cancer cells. Proc Natl Acad Sci USA. 2003;100:3983-8.
[62] Dimri GP, Lee X, Basile G, Acosta M, Scott G, Roskelley C, et al. A biomarker that identifies senescent human cells in culture and in aging skin in vivo. Proc Natl Acad Sci U S A. 1995;92:9363-7.
[63] Chen J, Goligorsky MS. Premature senescence of endothelial cells: Methusaleh's dilemma. Am J Physiol Heart Circ Physiol. 2006;290:H1729-39.
[64] Altman DG, Bland JM. Standard deviations and standard errors. BMJ : British Medical Journal. 2005;331:903-.
[65] Vaupel P. Tumor microenvironmental physiology and its implications for radiation oncology. Semin Radiat Oncol. 2004;14:198-206.
[66] Varlotto J, Stevenson MA. Anemia, tumor hypoxemia, and the cancer patient. Int J Radiat Oncol Biol Phys. 2005;63:25-36.
[68] Snell CE, Turley H, McIntyre A, Li D, Masiero M, Schofield CJ, et al. Proline-Hydroxylated Hypoxia-Inducible Factor 1α (HIF-1α) Upregulation in Human Tumours. PLoS ONE. 2014;9:e88955.
[69] Swietach P, Hulikova A, Vaughan-Jones RD, Harris AL. New insights into the physiological role of carbonic anhydrase IX in tumour pH regulation. Oncogene. 2010;29:6509-21.
[70] Parks SK, Chiche J, Pouyssegur J. pH control mechanisms of tumor survival and growth. J Cell Physiol. 2011;226:299-308.
[71] Brahimi-Horn MC, Chiche J, Pouysségur J. Hypoxia and cancer. J Mol Med. 2007;85:1301-7.
[72] Sadiq AA, Salgia R. MET as a possible target for non-small-cell lung cancer. J Clin Oncol. 2013;31:1089-96.
[73] Maulik G, Shrikhande A, Kijima T, Ma PC, Morrison PT, Salgia R. Role of the hepatocyte growth factor receptor, c-Met, in oncogenesis and potential for
therapeutic inhibition. Cytokine Growth Factor Rev. 2002;13:41-59.
[74] Yu AY, Frid MG, Shimoda LA, Wiener CM, Stenmark K, Semenza GL.
!
Figure 2.Radiation response of single-layer cultures of A549-GFP cells (A) Scheme showing a zone of a single-layer culture (left) and graph showing the response of single-layer cultures that were seeded at different densities (right). The radiation response, represented by the reduction in
the metabolic activity of cells, was measured using the luminescence-based CellTiter-Glo®
(CTG) assay. Data represent the ratio of the luminescence between irradiated to non-irradiated samples for n = 3 scaffolds. The luminescence value for each scaffold is an average of eight measurements (see supporting information for details of CTG assay) (B)Confocal fluorescence images of A549 cells stained with Click-iT® EdU Alexa Fluor® 488. Both images were taken at
the same magnification. (C) Confocal fluorescence images of A549 cells stained with Click-iT®
EdU Alexa Fluor® 594. The scale bar for all the images are found on the sample irradiated at 16
Gy—the top scale bar is for images at low magnification, while the bottom one is for images at
high magnification. Graph showing the ratio of proliferating cells with surviving A549-GFP cells. The intensities of Alexa Fluor® 594 (proliferating A549-GFP cells) and GFP (surviving
A549-GFP cells) were measured using a Typhoon scanner. Error bars represent the standard deviation for n = 10 zones. (D) Fluorescence (top) and bright field (bottom) images of A549-GFP cells labeled for senescence-associated β-galactosidase activity. All images were taken at the
same magnification. Graph showing the percentage of senescent cells (stained with blue) with
!
Figure 3. Radiation Response of Cells in Multi-layer Cultures of A549 Cells (A) Scheme representing a column of cells in a zone of the multilayer stack. Blocking the bottom of the stack with a plate impermeable to gases and small molecules limits the diffusion of molecules to the top of the stack. (B) Graph summarizing the number of metabolically-active cells in multi-layer culture of A549 cells from L1 to L6. Circular and triangular markers represent values obtained for each stack; bars represent the average for 3 stacks. The luminescence value for each scaffold is an average of eight measurements (see supporting information for details of CTG assay). (Inset) Enlarged graph for the viability of multi-layer cultures from L4 to L6. The broken lines
indicate the seeding density of cells (2,000 cells/zone) in each layer. (C) Confocal fluorescence images of A549 cells in a non-irradiated, multi-layer culture showing decrease in the density of cells, and decrease in the incorporation of the proliferation stain, EdU (Click-iT® EdU Alexa
!
Figure 4. Hydroxy-HIF1-α and CAIX Expression of A549 Cells in Multi-layer Cultures Using Western Blot (A) Images of blots of A549 lysates carried out for hydroxy-HIF-1α, CAIX and GAPDH (loading control). Lysates were collected from multi-layer cultures that were cultured for four days and then disassembled into separate layers. CAIX is a dimeric protein, and
!
!
Figure 6. Radiation response of A549-HGF-M in Multi-layer Culture(A) Viability of multi-layer cultures of A549-HGF-M measured at different time points. (B) Viability of multi-layer cultures of A549-HGF-M with polycarbonate filters (pore diameter = 0.20 µm to block
Table 1. HGF Levels Released from Overnight Cultures of A549 and A549-derived Lines