The Effect of Retiree Migration on
Regional Job Quality
Paul Liu
Master’s Project
Department of City and Regional Planning
University of North Carolina, Chapel Hill
Abstract
As the baby-boom generation continues to retire in large numbers, the migration of retirees to new areas in search of a better quality of life has become an increasingly visible
Acknowledgements
Table of Contents
1. Introduction ... 4
2. Background and Literature Review ... 5
2.1 Effect of Retiree In-Migration on Regional Employment Levels ... 6
2.2 Effect of Retiree In-Migration on Regional Job Quality ... 8
2.3 Other Factors Influencing the Job Quality Impact of Retiree In-Migration ... 10
2.4 Analytical Strategies ... 11
3. Methodology ... 12
3.1 Empirical Context ... 12
3.2 Research Design ... 13
3.3 Database Construction ... 16
4. Results ... 17
4.1 Summary Statistics ... 18
4.2 Regression Results ... 20
4.3 Comparing the Impact between 55-65 and 65+ Age Cohorts ... 25
4.4 Comparing the Impact across Regions and County Types ... 25
4.5 Limitations ... 27
5. Discussion ... 28
5.1 Retiree Integration ... 28
5.2 Considerations for Retirees Aging in Place ... 30
1. Introduction
In many areas of the United States, the number of retirees is growing relative to other age cohorts as the baby boom generation – Americans born between 1946 and 1964 – reach retirement age. The Federal Reserve Bank of St. Louis projects that the number of
Americans turning 65 will peak in the early 2020s, with significant implications for regional labor markets and economic development more broadly (Vandenbrouke 2019). One potential implication is retirees’ impact on regional job quality. Because retirees do not participate in the labor force but nevertheless consume a region’s goods and services, some have argued that retirees’ consumption patterns drive demand for industries and
occupations, typically in the service sector, where wages and job quality are low (Stallman et. al. 1999).
Furthermore, the migration of retirees has been increasing at least as rapidly as their total population. It is well documented that large numbers of the newly-retired migrate to new regions in search of pleasant climates, recreational opportunities, and well-developed retirement communities, such as those found in the Sun Belt (Sastry 1992). Owing to these migration trends, some local governments have viewed attracting retirees as a source of local economic development even though the full impact of retiree in-migration is not
well-understood (Serow 2003). As such, a better understanding of retiree migration’s effect on local job quality would further inform policy decision-making in communities that are experiencing high retiree in-migration or are considering retiree in-migration as an economic development strategy.
The aim of this project is to provide an econometric analysis, at the county level, of the effect of retiree migration on job quality in the United States. The project seeks to answer the question: “Does retiree in-migration increase the share and number of low-wage jobs in a county and thereby decrease its job quality?” Unlike previous studies, which used regional input-output models to simulate the employment impact of retiree migration in specific localities, this econometric analysis directly measures retiree migration’s effect on low-wage service sector employment at the national scale using publicly available data. This project, which employs an ordinary least squares and instrumental variables research design, finds a positive and significant relationship between retiree migration and job growth in low-wage service industries. However, as I will discuss later, retiree migration can also bring a host of economic and community development opportunities on which local governments should capitalize.
Types of Retiree Migration
Before turning to the literature, it is important to clarify the type of migration that is the focus of this project. The elderly migration literature distinguishes three types of retiree migration. The first type, called amenity-seeking migration, involve younger, healthier, wealthier, and relatively well-educated retirees who migrate to locations deemed attractive for their amenities. These amenities can include natural (mountains, lakes, rivers), cultural, climate-related, or simply the presence of a welcoming retiree community. The second, called assistance-driven migration, is made when the health of the retiree or their spouse deteriorates and assistance is needed with activities of daily living. Assistance migrants tend to be older than the typical amenity-seeking migrant, and moves are usually involuntary. The third type of move is into a long-term care facility (Das et al. 2009; Sastry 1992).
This project focuses on the first type of migration, i.e. amenity-seeking migration, and how it impacts regional job quality. While assistance-driven migration also presents
important implications for regional labor markets, these implications are beyond the scope of this project. Thus, the term retiree migration will refer solely to amenity-seeking
migration in this report.
2. Background and Literature Review
In recent years, the idea of using retiree migration as a source for regional economic development has increasingly gained traction with local governments. Proponents of retiree attraction policies generally argue that retired in-migrants increase demand for local goods and services, thereby expanding the economic base and creating jobs, new income, and tax revenues at a relatively low public service cost (Mullins and Rosentraub 1992). These in-migrants have also been argued to have a stabilizing effect on regional economies, since their retired status imply a steady income stream that are less dependent on local economic
conditions (Selig Center 2013). For rural areas lacking the wide range of economic
development options available to metropolitan regions, the prospect of attracting retirees for community and economic revitalization has been especially popular. In the 1990’s, for instance, the USDA actively promoted retiree attraction policies as a means for struggling rural communities to “stabilize local populations, provide jobs for young people, maintain local retail businesses, diversify local economies, add to the tax base to maintain
infrastructure and services, and reinvigorate local institutions” (Reeder 1998). Its rationale was that retiree attraction can facilitate deindustrializing rural areas’ transition to a service sector economy, thereby stemming the leakage of local retail and service activity to urban service centers (Reeder 1998).
migration, cautioning that the intended economic impact “depends heavily on the level of programmatic responsibility and fiscal authority possessed by the government in question” (Serow 2003). Even if retiree in-migrants create new jobs through their consumption activity, the jobs created seem to fall in low-wage service industries such as retail and restaurants (Deller 1995; Glasgow and Reeder 1990).
Responding to the need for a more comprehensive understanding of the benefits, drawbacks, and risks of retiree attraction policies, researchers have sought to quantify and dissect this impact using several methodologies. In the process, their studies also test the economic theory explaining how this impact is supposed to occur. This literature review provides an integrated summary of the empirical findings thus far and the economic theory informing the research. It also investigates potential factors moderating retiree migration’s labor market impact, and it lastly reviews and critiques the methodologies used in the literature.
2.1 Effect of Retiree In-Migration on Regional Employment Levels
Regarding the labor market impact of retiree in-migrants on destination regions, the literature generally agrees that local employment increases as retirees enter an area. Using an input-output model simulation for Florida, Sastry (1992) estimated that one new job is created for every 2.5 elderly in-migrants. Deller (1995) conducted a similar analysis for Maine, finding that “for every 100 new in-migrating retirees 55 jobs would be created” (Deller 1995). At the local level, Stallman et. al (1999) found that 0.42 jobs are created for every retired in-migrant into a small rural region in Wisconsin, while Serow and Haas’s (1992) analysis of the Asheville, NC region found this impact to be 0.58 jobs created. Additionally, Day and Bartlett’s (2000) correlation analysis on the Texas Hill Country found relatively high correlations between retiree in-migration and employment in the service, medical, financial, real estate, and construction sectors. Glasgow and Reeder (1990)
furthermore noted that, among nonmetropolitan counties nationwide, counties classified as retirement destinations experienced significantly higher employment growth than non-retirement counties1. Thus, research attempting to quantify the employment impact of
retiree in-migration have found remarkably similar impacts, i.e. roughly one-half job per every retired in-migrant, regardless of the level of analysis or methodological technique (Serow 2003).
The mechanics driving this impact can be explained, at least in part, by demand-side economics. Essentially, an influx of retirees to a region increases demand for certain types of goods and services consumed by the new residents. To satisfy this new demand,
employment levels must increase. Because retirees themselves are inactive in the labor market, new jobs are filled by increases in local labor force participation, in-migration of workers from outside the region, and existing workers working longer hours (Deller 1995; Sastry 1992). Indeed, Greenwood and Hunt (1984) find empirical evidence of follow-up migrations of workers to retirement destination regions, a phenomenon which creates an
additional induced impact on labor demand. The literature consequently suggests not only a positive relationship between migration and employment but also a mutually reinforcing one (Sastry 1992).
Table 1: Comparative Results from Empirical Estimates of
Retirement Migration’s Impact on Local Employment2
Author Method Jobs Createdper Retiree
Deller (1995) Simulation of 5,000 migrants aged 65 to 69 per year to Main between 1992 and 2000 using the REMI
input-output model 0.555
Sastry (1992) Simulation of historical migration to Florida between 1975 and 1980 using the RIMS II input-output model 0.409
Day & Bartlett (2000) Correlation analysis of 1965-70, 1975-80, and 1985-90 migration of 34 Texas “Hill Country” counties N/A
Stallman, Deller, & Shields (1999)
Simulation of 500 retired migrant households aged 65-74 and 500 aged 75+ to three rural Wisconsin counties
using the Wisconsin Economic Impact Modeling System 0.336
Shields, Stallman, & Deller (1999)
Simulations of 1,000 retired migrant households (500 low income and 500 high income) to three rural
Wisconsin counties 0.508
Shields, Deller, & Stallman (2001)
Simulations of 1,000 migrant households (500 households and 500 elderly) to three rural Wisconsin
counties 0.338
Serow & Haas (1992) Interviews with retired migrants in seven North Carolina counties 0.582
Within this mutual causality framework, Sastry (1992) argues that retiree migration enhances and amplifies the feedback effects between migration and employment. First, retired in-migrants inject new money into the local economy since their existing wealth and the transfer payments they receive (e.g. Social Security, Medicare, etc.) both originate outside the region. This injection essentially represents an expansion of the local economic base, and the expenditures of retired in-migrants act as a direct, exogenous impact on local output and employment (Deller 1995; Sastry 1992). In other words, dollars expended locally by retired in-migrants would circulate into the local economy as additional money from outside, which according to export base theory is the key driver for regional economic growth.
Second, retired in-migrants have a relatively high propensity to purchase locally-produced goods and services (Sastry 1992). Their dollars expended stay in the regional
2 Table 1 is a replication of an original table in Serow (2003): Economic Consequences of Retiree Concentrations: A Review of North American
economy rather than “leak” outside the region, which would occur if one consumes outside the region. Elderly consumption therefore are thought to generate a greater economic impact for a region, all else equal, than non-elderly consumption (Sastry 1992). In his
analysis of the direct, indirect, and induced effects3 of the employment impact in Florida due
to elderly in-migration, Sastry (1992) finds that employment creation is greater as a result of elderly in-migration than as a result of alternative exogenous stimuli, such as a government subsidy to existing residents. This is because the consumption patterns of elderly in-migrants tend to involve industries with stronger linkages to local economic activity, thereby creating greater indirect and induced effects on the local economy that in turn leads to comparatively higher employment levels (Sastry 1992).
In short, the empirical literature generally finds evidence for a positive and mutually reinforcing relationship between retiree migration and total regional employment. Demand-side economics and the export-base theory of economic development, which seek to
describe the mechanics through which this relationship plays out, further predicts that retiree migration impacts local employment directly, enhances the feedback loop between non-retirement migration and employment, expands the export base, and increases demand for locally-produced goods and services.
2.2 Effect of Retiree In-Migration on Regional Job Quality
Evaluating the total number of jobs created as a result of retiree in-migration is only one aspect of the labor market impact. Equally important for regional economic
development is the quality of jobs created. Though the exact definition of job quality is subjective, the Organization for Economic Cooperation and Development (OECD) defines job quality in terms of earnings quality (i.e. wages and other forms of compensation such as health insurance), labor market security, and the quality of the working environment (OECD 2016). As such, job quality has significant welfare implications and plays a key role in
regional labor market dynamics.
The literature generally agrees that job quality has declined over the long run, to the extent that “severe labor market problems [experienced today]…are rooted not in the
shortage of jobs, or in the quality of workers themselves, but in the quality of jobs employers offer” (Howell and Kalleberg 2019). Additionally, the consequences of low job quality – low wages, rising job insecurity, and the likely growth in nonstandard work arrangements – have been “linked to a large number of social economic problems, such as family fragmentation, poverty and inequality, and poor individual well-being” (Howell and Kalleberg 2019). Thus, developing a stable and high-wage employment base as well as the workforce capable of filling high-quality jobs is just as important for economic developers, if not more so, than job creation itself.
3In the fields of export-base theory and economic impact analysis, a direct effect is defined as the activity resulting from the
How does job quality relate to the typology of occupations and industry sectors? Which occupations and industries have, on average, higher job quality and which tend to have lower-quality jobs? Answering these questions is critical to understanding the quality of jobs generated by retiree in-migration. Research into the job quality of different sectors and occupations generally, but not always, use wages as a proxy for job quality since it is
straightforward and data is readily available. Research using wages as a proxy for job quality find that low-wage jobs tend to concentrate in wholesale and retail trade and in hotels and restaurants. “These sectors account for…just under one-third of all low-wage jobs in the United States” (OECD 2001).
Because an industry sector employs a range of job types (e.g. the retail trade sector employs cashiers, store managers, and CEOs), it is also helpful to examine which
occupations are predominantly low-wage. Nationally, the three largest occupations are retail salespersons (4.4 million jobs with mean hourly wage of $13.61), food preparation workers (3.7 million jobs with mean hourly wage of $10.64), and cashiers (3.6 million jobs with mean hourly wage of $11.17). These three occupations alone comprise roughly one-third of the nation’s low-quality jobs4 (BLS 2018). As such, the data suggests that low-quality jobs, at
least in terms of wages, are associated with the trade, restaurant, and hospitality sectors and are disproportionately represented by retail and food workers.
It is these sectors and occupations that, according to the literature, make up a large share of the jobs created by retiree in-migration (Sastry 1992; Deller 1995; Serow and Haas 1992). Deller’s (1995) input-output simulation of retiree in-migration’s labor market impact on three rural Wisconsin counties found that the “sector with the single largest increase in employment is retail,” while eating and drinking establishments and construction also experienced significant job growth (Deller 1995). In particular, he found that roughly one out of every two jobs created belonged to the retail, eating and drinking places, and
construction sectors (Deller 1995). Sastry’s (1992) simulation on Florida yielded similar results: retail trade, personal services, eating and drinking places, and construction (both new and maintenance-related) accounted for 43% of all jobs created statewide as a result of retiree in-migration (Sastry 1992). In his review of the literature on the economic impact of retiree attraction policies, Reeder (1998) concludes that retiree attraction creates a mix of jobs, ranging from highly skilled medical jobs to unskilled retail jobs, but most of these new jobs tend to be created in low-skilled and low-wage occupations (Reeder 1998).
To some extent, the relationship between retiree in-migration and low-quality job growth is due to the spending patterns of the in-migrants. This is because the types of jobs created are logically a reflection of the types of goods and services consumed. In-migrants’ consumption activities tend to focus on service industries, particularly retail, which “typically has lower average annual earnings and requires lower skill levels than [new jobs] in goods-producing sectors.” (Glasgow and Reeder 1990; Reeder 1998). Thus, the corresponding creation of service industry jobs is to be expected.
4 Using methodology developed by Boushey et al. (2007), a low-quality occupation is defined as paying a mean hourly waged of $14.70
Another factor driving retiree migration’s propensity to create low-quality jobs is the amount of economic activity leaking to other areas. Some communities, especially rural ones, lack the full range of goods and services and the residents skilled in professions demanded by retirees, leaving retirees (and others) with no option but to spend a portion of their money elsewhere. For example, rural retirement areas lacking healthcare services cannot keep retirees’ healthcare spending from leaving the local economy nor reap the economic benefits of that spending. Typically, the activity which rural communities do capture involve low-skill service sector establishments such as grocery stores, gas stations, and restaurants (Reeder 1998).
In summary, the literature suggests that retiree in-migration generally downgrades regional job quality because a large proportion of jobs created appears to belong to industries and occupations associated with low-quality jobs. Despite retiree migration’s positive association with overall employment growth, further research at the sectoral and occupational levels suggests that much of this growth occurs in low-skill and low-wage industry sectors.
2.3 Other Factors Influencing the Job Quality Impact of Retiree In-Migration
It should be noted that the degree of retiree migration’s economic impact depends on a wide variety of factors, many of which vary between regions. For example, retirees moving to metropolitan areas may have a different impact on employment levels and job quality than those moving to nonmetropolitan areas. Additionally, the level of geographic aggregation used in the literature (e.g. county vs. state) may yield different economic impacts.
To date, only Das et al. (2009) has explored the spatial variability of retiree
migration’s economic impacts. Their research focused on three Arkansas counties that are considered popular retirement destinations but are highly dissimilar both in terms of county economic structure and the economic status of in-migrating retirees (Das et al. 2009). They find that counties with larger economies and a more diverse industrial structure benefit from greater impacts due to more opportunities to purchase goods and services as well as the relative affluence of their in-migrants. Conversely, in-migration to the rural county exhibited a lower impact due to less spending opportunities (thus driving leakage) and the
“blue-collar” profile of its in-migrants, who relocated there primarily for the lower cost of living (Das et al. 2009). Das et el. (2009) further find that the aggregation of study regions results in significantly different economic impacts, which is expected given the input-output modelling system used. Overall, their research shows that retiree migration’s economic impact is dependent on both the economic structure of the destination region and the socioeconomic profiles of the in-migrants themselves.
Another factor seldom discussed in the literature is retirees’ non-labor market activities which nevertheless impact regional economies. For example, many retirees
advisors or participants in local government, providing expertise and input reflecting their abilities and needs (Reeder 1998). The economic impact of these activities cannot be
measured by traditional input-output models, which only examines retiree spending, and the total economic impact resulting from retiree in-migrants may thus be underestimated in much of the literature.
Lastly, the economic impact of retiree migration is subject to changing preferences and long-term socioeconomic trends. Some cities in the United States have experienced a back-to-the-city movement in recent years, with population and capital investments arriving in certain urban cores at unprecedented rates (Hyra 2015). While senior migration continues to flow to traditional retirement destinations outside of urban core areas (Brookings 2019), future generations of retirees may have different locational and spending preferences. Thus, the relationship between retiree migration and regional economies is dynamic in nature and subject to long-term change.
2.4 Analytical Strategies
The primary methods researchers use to quantify the economic impact of retiree migration are 1) observational studies between migration and selected economic outcomes at a spatially aggregated level and 2) economic impact simulations using input-output models.
Observational studies include Glasgow and Reeder’s (1990) national comparison of retirement and non-retirement rural counties and Day and Bartlett’s (2000) correlation analysis on the relationship between retirement migration to the Texas hill country and employment growth (Serow 2003). While these studies offer detailed measures of
association between retirement migration and a number of social and economic indicators, determining a causal relationship is beyond the scope of these studies.
Simulations using input-output models offer a more comprehensive and versatile method for quantifying the causal impact of retiree in-migration. Essentially, input-output models characterize a regional economy by the implicit structural relationships between all industries in the economy. Their main advantage lies in their ability to exploit the structural interdependencies within an economy and thus capture the indirect and induced effects of retiree migration. Furthermore, they provide detailed information at the industry level, thereby enabling researchers to examine the industries impacted most by retiree migration (Sastry 1992). Nevertheless, input-output models suffer from several weaknesses, including an inability to accommodate more dynamic processes within regional economies, the
assumption that economic impacts materialize instantaneously, and the assumption that consumption and technology patterns which influence regional industrial structure remain constant (Sastry 1992). These limitations should caution researchers on the accuracy of input-output models.
migration’s economic impact. Researchers’ hesitation to use an econometric methodology may be due to the difficulty in estimating migration’s impact in general. The problem of endogeneity owing to reverse causality, selection bias, and omitted variable bias is pervasive in decisions to migrate, and the lack of a counterfactual poses a barrier to separating
migration’s impact on job quality from other factors. Using ordinary least squares
regression, therefore, would likely produce biased estimates. However, OLS is still a viable method if one has reason to believe that the bias is sufficiently small (McKenzie and Sasin 2007).
In recent years, the migration impact literature has turned to more advanced econometric techniques, such as instrumental variables and propensity score matching, to work around these barriers to valid estimation. The mechanics of instrumental variables estimation is discussed in the next section, but a powerful instrument used correctly can eliminate problems of endogeneity, omitted variables, and measurement error (McKenzie and Sasin 2007). Thus, the application of this method to estimate retiree migration’s impact can provide a novel addition to the empirical literature.
3. Methodology
This section explains the empirical context motivating the research design and
presents the modelling approach used to estimate the impact of retiree migration on regional job quality. It also describes the process of constructing the database on which the
econometric analysis is conducted. 3.1 Empirical Context
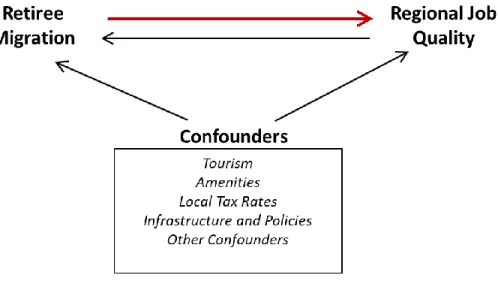
This project uses both an ordinary least squares (OLS) and an instrumental variables (IV) research design to estimate the causal effect of retiree migration on job quality. The instrumental variables approach, also referred to as two-stage least squares (TSLS), is a method employed by researchers in a wide range of fields to address issues of endogeneity, omitted variable bias, and measurement error that can produce biased estimates in OLS. In this case, OLS estimation of retiree migration’s impact is complicated by other factors that influence both regional labor markets and retiree migration, thus confounding the results. For instance, a region with a high level of natural and cultural amenities not only attracts retired in-migrants but also tourists. Both groups likely affect the region’s labor market composition, so regressing low-wage service employment on retiree in-migration without accounting for tourism would bias and invalidate the estimated impact. One solution is to control for potential confounders within the OLS model. However, identifying all
The IV approach works around this problem by identifying a variable, called an instrument, which is highly correlated with the endogenous independent variable (retiree in-migration) and uncorrelated with the dependent variable (low-wage service sector
employment) except through its relationship with the endogenous variable.
Econometricians refer to the first condition as the strength of an instrument and the second as its validity. The second condition, also known as the exclusion restriction,is particularly important in establishing the instrument as an exogenous regressor. In theory, a valid instrument correctly applied yields unbiased estimates of a causal relationship. In practice, however, identifying a valid instrument is extremely difficult since instrument validity cannot be tested under most circumstances. Moreover, usage of an invalid instrument that is also weakly correlated with the independent variable often produces estimates that are much more biased than those obtained through OLS (Moulton 2019). Because researchers cannot test instrument validity (except under special conditions), they typically rely on theory and conceptual arguments to justify their choice of instruments.
3.2 Research Design
Figure 1: Endogeneity Issues in Estimating the Effect of Retiree Migration on Regional Job Quality
The ideal approach to address the endogeneity problem and to identify the causal effect of interest is through a randomized controlled trial. In this case, retiree migrants would be randomly assigned to regions that have different job quality levels but are identical in every other respect. Because this method is neither ethical nor realistic, the project attempts to address the endogeneity problem through the instrumental variables approach discussed earlier.
I now discuss the details of this project’s research design and the variable selection process. The main independent variable is the county in-migration rate of the over 55 age cohort between 2000 and 2010, and the main dependent variable is the change in low-wage service industry jobs in terms of their total employment share between 2001 and 2011. Because a significant share of retired in-migrants is between the ages of 55 and 65, classifying retired in-migrants as those aged 55 and over is more consistent with the literature than using the official retirement age of 65. Additionally, I assume that the full labor market impact of a retired in-migrant is realized one year after their move, hence the one-year lag between the migration period and the timeframe used to measure its impact on employment.
moved to the area in the past are unlikely to be correlated with current wage shocks (Lozano and Steinberger 2010).
In a similar vein, retired migrants’ tendency to move to areas with existing concentrations of retirees (Sastry 1992) make the pre-migration elderly share of the regional population a plausible instrument. While the pre-migration elderly’s population share does influence the structural composition of a county’s labor market, it is unlikely that this share affects change in the labor market mix ten years later. Because the dependent variable relates precisely to this change 10-20 years after the instrument is measured, this choice of instrument should, conceptually, resolve issues associated with endogeneity and omitted variables.
However, one cannot discount the possibility that the 1990 elderly population share’s impact on low-wage employment growth lingers into the 2000-2010 period. If this is indeed the case, then a county’s 1990 elderly population share would not be a valid instrument, given its direct influence on the dependent variable, and the resulting TSLS estimates would invariably be biased. Readers should therefore interpret results derived from IV with caution, keeping in mind that estimates are valid only if the exclusion restriction holds.
Equation (1) summarizes the OLS modeling approach to measure the impact of retiree migration:
Ordinary Least Squares (OLS):
ΔLW Service Emp. Share01-11 =α + β1Ret. Mig. Rate00-10 + γ00 +δ00-11+ ε (1)
The OLS model regresses the change in low-wage service jobs’ employment share between 2001 and 2011 on the migration rate of the over 55 cohort between 2000 and 2010. The model also includes γ00, a set of geographic and socioeconomic controls in 2000, and δ00-11, a
set of controls measuring socioeconomic change between 2000 and 2011. Essentially, γ00
controls for a select group of county characteristics just before migration begins while δ00-11
controls for changes in those characteristics during the migration period. The term εis the county-specific error and represents variation in the dependent variable not captured by the model.
Equation (2) summarizes the instrumental variables (TSLS) modeling approach: Two-Stage Least Square (TSLS):
𝑅𝑒𝑡. 𝑀𝑖𝑔𝑟𝑎𝑡𝑖𝑜𝑛 𝑅𝑎𝑡𝑒̂ 00-10 = η + θ1Elderly Share90 + γ00 +δ00-10 + μ (2)
Δ LW Service Emp. Share01-11=α + β1𝑅𝑒𝑡. 𝑀𝑖𝑔. 𝑅𝑎𝑡𝑒̂ 00-10 + γ00 +δ00-11 + ε
The first stage of a TSLS model regresses the 55+ migration rate between 2000 and 2010 on the instrument, i.e. elderly population share in 1990, and the control variables. The second stage regresses low-wage service jobs’ employment share on the predicted migration rate obtained from the first stage and the controls.
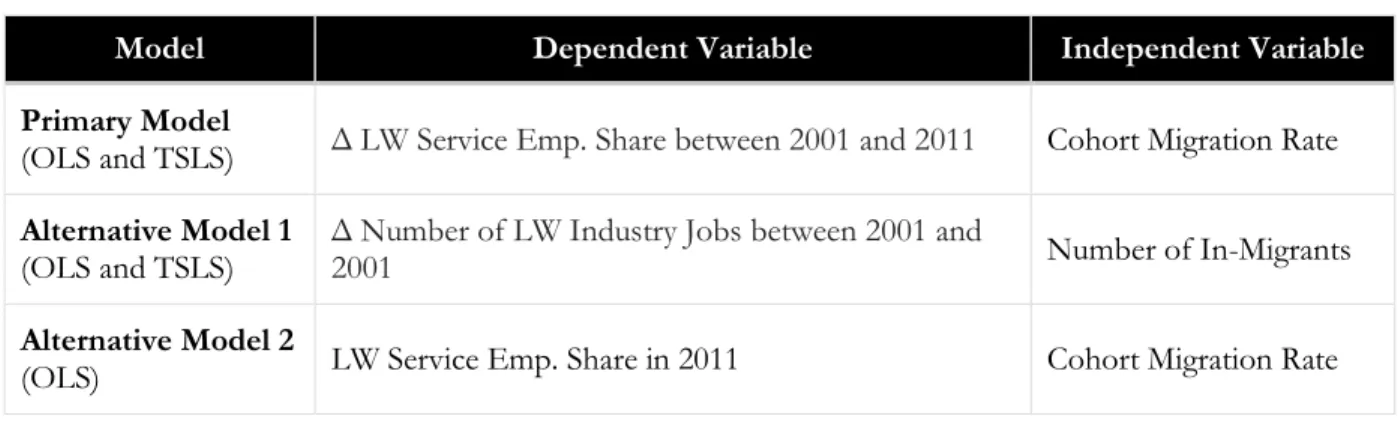
Alternative Model 1 re-operationalizes the dependent variable as the change in number of jobs in low-wage service industries and the independent variable as the number of retired in-migrants. This enables the estimation of the number of jobs created from each additional migrant, which is the metric commonly used in the literature. Alternative Model 2 re-operationalizes the dependent variable as the post-migration share of total employment taken by low-wage service industry jobs. Because this model’s dependent variable is the post-migration low-wage service sector share rather than the change in that share during the migration period, there is little justification for using TSLS.
Table 2: Primary and Alternative Model Specifications
Model Dependent Variable Independent Variable
Primary Model
(OLS and TSLS) Δ LW Service Emp. Share between 2001 and 2011 Cohort Migration Rate
Alternative Model 1
(OLS and TSLS) Δ 2001Number of LW Industry Jobs between 2001 and Number of In-Migrants
Alternative Model 2
(OLS) LW Service Emp. Share in 2011 Cohort Migration Rate
To test the hypothesis that younger migrants create a disproportionately greater impact on low-wage service employment, the three model specifications are run specifically for the 55–65 cohort and again for the 65+ cohort. The models are also run by Census Region and county type since retiree migration’s impact is likely heterogeneous based on geography and the level of regional development.
3.3 Database Construction
This analysis uses a variety of publicly available data sources to construct the database on which the models are run. Migration data is obtained from the County-Specific Net
Migration data file created by the Center for Demography and Ecology at the University of Wisconsin-Madison. The authors of the file applied a form of the Cohort Survival
Projection Method using the 2000 and 2010 Censuses to obtain county-level net migration estimates.
merchandise stores, and food and beverage establishments. They also include consumer and business service industries such as personal care services, nursing care facilities, and home maintenance and repair. A third category classified as low-wage service is the recreation sector, which includes museums, gambling establishments, tour operators, spectator sports, and amusement parks. In order to qualify as a low-wage service industry, the average annual wage in that industry must additionally be below $25,000 in 2001.
The control variables are the presence of natural amenities, population, educational levels, race, income, home values, poverty rate, unemployment rate, unemployment rate change between 2000 and 2011, and GDP change between 2000 and 2011. Additionally, nine Census Division dummy variables and three county type dummy variables were included as controls to account for geographic heterogeneity. The three county types are Central City (counties containing a central city), Metro Outlying (counties that lie in an MSA but do not contain a central city), and Rural (nonmetropolitan counties).
Natural amenities are measured by the USDA’s Natural Amenities Index, which “measures the physical characteristics of a county area that enhance the location as a place to live. The scale was constructed by combining six measures of climate, topography, and water area that reflect environmental qualities most people prefer” (McGranahan 1999). The index assigns counties a score between 1 and 7 based on these characteristics.
Socioeconomic controls are obtained from the 2000 and 2010 Censuses through Social Explorer. GDP data is collected from the Bureau of Economic Analysis’ data portal. Census Division and county type dummy variables were obtained from the USDA and BLS, respectively.
The last step in constructing the database is to merge the various datasets using the county FIPS code as the common identifier. After merging, the final database contains migration, employment, geographic, and socioeconomic data for 3,211 counties in all 50 states and the District of Columbia. Although a small number of counties were dropped during the merge process due to discrepancies between data sources and county boundary changes between 2000 and 2010, this number is negligible in relation to the overall sample size.
4. Results
4.1 Summary Statistics
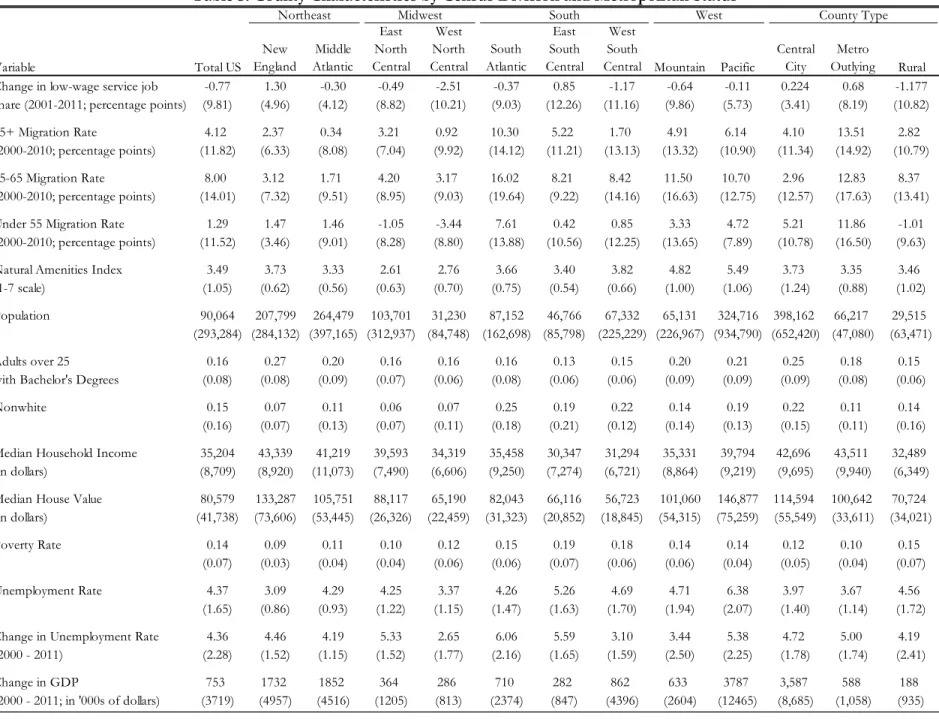
Table 3 presents summary statistics of changes in low-wage service employment, senior migration rates (segmented by age cohort), and various geographic and
socioeconomic variables that can potentially confound both senior migration and labor market conditions. Segmenting these variables by Census Division and metropolitan status, it becomes clear that senior migration rates are much higher in the South and West
compared to those in the Northeast and Midwest. Moreover, counties characterized as “Metro Outlying” (i.e. suburban) exhibit senior migration rates that are three times higher than both rural counties and counties containing with central cities.
Table 3 also illustrates the higher level of migration activity exhibited by the 55-65 cohort compared to the 65+ cohort. Nationally, this “young-old” population migrated twice as much as the 65+ cohort, and their migration activity overwhelmingly concentrated in the South and West. Migrants aged 55-65 are also more likely to move to rural counties and less likely to move to counties containing central cities compared with migrants over 65.
Interestingly, Census Divisions with high senior migration rates also experienced high in-migration from non-seniors. These regions score higher on the Natural Amenities Index relative to other parts of the country, but are not noticeably different on other indicators. Suburban counties, where senior migration rates are the highest, exhibit a slightly lower poverty rate and contain less minorities than central city and rural counties. However, this difference is not statistically significant.
Table 3: County Characteristics by Census Division and Metropolitan Status
Northeast Midwest South West County Type
Variable Total US
New England Middle Atlantic East North Central West North Central South Atlantic East South Central West South
Central Mountain Pacific
Central City
Metro
Outlying Rural Change in low-wage service job -0.77 1.30 -0.30 -0.49 -2.51 -0.37 0.85 -1.17 -0.64 -0.11 0.224 0.68 -1.177 share (2001-2011; percentage points) (9.81) (4.96) (4.12) (8.82) (10.21) (9.03) (12.26) (11.16) (9.86) (5.73) (3.41) (8.19) (10.82)
65+ Migration Rate 4.12 2.37 0.34 3.21 0.92 10.30 5.22 1.70 4.91 6.14 4.10 13.51 2.82 (2000-2010; percentage points) (11.82) (6.33) (8.08) (7.04) (9.92) (14.12) (11.21) (13.13) (13.32) (10.90) (11.34) (14.92) (10.79)
55-65 Migration Rate 8.00 3.12 1.71 4.20 3.17 16.02 8.21 8.42 11.50 10.70 2.96 12.83 8.37 (2000-2010; percentage points) (14.01) (7.32) (9.51) (8.95) (9.03) (19.64) (9.22) (14.16) (16.63) (12.75) (12.57) (17.63) (13.41)
Under 55 Migration Rate 1.29 1.47 1.46 -1.05 -3.44 7.61 0.42 0.85 3.33 4.72 5.21 11.86 -1.01 (2000-2010; percentage points) (11.52) (3.46) (9.01) (8.28) (8.80) (13.88) (10.56) (12.25) (13.65) (7.89) (10.78) (16.50) (9.63)
Natural Amenities Index 3.49 3.73 3.33 2.61 2.76 3.66 3.40 3.82 4.82 5.49 3.73 3.35 3.46 (1-7 scale) (1.05) (0.62) (0.56) (0.63) (0.70) (0.75) (0.54) (0.66) (1.00) (1.06) (1.24) (0.88) (1.02)
Population 90,064 207,799 264,479 103,701 31,230 87,152 46,766 67,332 65,131 324,716 398,162 66,217 29,515 (293,284) (284,132) (397,165) (312,937) (84,748) (162,698) (85,798) (225,229) (226,967) (934,790) (652,420) (47,080) (63,471)
Adults over 25 0.16 0.27 0.20 0.16 0.16 0.16 0.13 0.15 0.20 0.21 0.25 0.18 0.15 with Bachelor's Degrees (0.08) (0.08) (0.09) (0.07) (0.06) (0.08) (0.06) (0.06) (0.09) (0.09) (0.09) (0.08) (0.06)
Nonwhite 0.15 0.07 0.11 0.06 0.07 0.25 0.19 0.22 0.14 0.19 0.22 0.11 0.14
(0.16) (0.07) (0.13) (0.07) (0.11) (0.18) (0.21) (0.12) (0.14) (0.13) (0.15) (0.11) (0.16)
Median Household Income 35,204 43,339 41,219 39,593 34,319 35,458 30,347 31,294 35,331 39,794 42,696 43,511 32,489 (in dollars) (8,709) (8,920) (11,073) (7,490) (6,606) (9,250) (7,274) (6,721) (8,864) (9,219) (9,695) (9,940) (6,349)
Median House Value 80,579 133,287 105,751 88,117 65,190 82,043 66,116 56,723 101,060 146,877 114,594 100,642 70,724 (in dollars) (41,738) (73,606) (53,445) (26,326) (22,459) (31,323) (20,852) (18,845) (54,315) (75,259) (55,549) (33,611) (34,021)
Poverty Rate 0.14 0.09 0.11 0.10 0.12 0.15 0.19 0.18 0.14 0.14 0.12 0.10 0.15 (0.07) (0.03) (0.04) (0.04) (0.06) (0.06) (0.07) (0.06) (0.06) (0.04) (0.05) (0.04) (0.07)
Unemployment Rate 4.37 3.09 4.29 4.25 3.37 4.26 5.26 4.69 4.71 6.38 3.97 3.67 4.56 (1.65) (0.86) (0.93) (1.22) (1.15) (1.47) (1.63) (1.70) (1.94) (2.07) (1.40) (1.14) (1.72)
Change in Unemployment Rate 4.36 4.46 4.19 5.33 2.65 6.06 5.59 3.10 3.44 5.38 4.72 5.00 4.19 (2000 - 2011) (2.28) (1.52) (1.15) (1.52) (1.77) (2.16) (1.65) (1.59) (2.50) (2.25) (1.78) (1.74) (2.41)
Change in GDP 753 1732 1852 364 286 710 282 862 633 3787 3,587 588 188
Figure 2: Net Migrants Aged 55-74 per 100 Individuals between 2000 and 20105
4.2 Regression Results
Table 4 presents the first stage IV results for the primary and alternative models, where the elderly population share in 1990 serves as the instrument for senior migration ten years later. The high F-statistic and R2 in all three models strongly suggest that elderly
population share in 1990 is a sufficiently strong instrument.
Table 4: F-Statistics and R2 Coefficients from First-Stage IV Regressions
Model First Stage F-Statistic(Prob>F) First-Stage R2
Primary Model (TSLS) 170.78 (0.00) 0.56
Alternative Model 1 (TSLS) 110.38 (0.00) 0.45
Alternative Model 2 (TSLS) 170.78 (0.00) 0.56
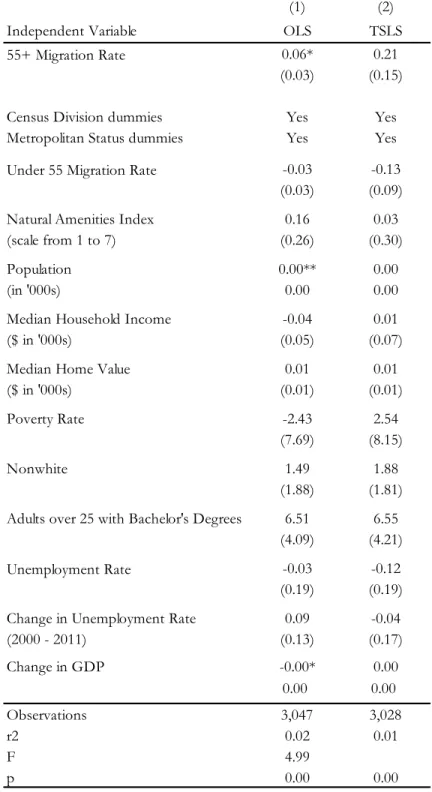
Table 5 presents the primary model results of the OLS and TSLS analyses for the 55+ cohort. The OLS estimates show a positive and significant relationship between senior migration and the relative change in low-wage service employment. Because the dependent variable is the change in relative employment share held by the low-wage service sector
between 2001 and 2010, the estimates can be interpreted as the additional growth in the low-wage service share of total employment attributable to one percentage point increase in the 55+ migration rate. For instance, Column (1) shows that a percentage point increase in the migration rate leads to a 0.06 percentage point increase in the change of this share. If low-wage service employment in a county comprise 10% of total employment in 2001 and increased to 15% in 2011, for instance, then a one percentage point increase in the 55+ migration rate would increase this share by an additional 0.06% to 15.06% in 2011.
The TSLS estimates are substantially larger than OLS but not statistically significant. Despite this seemingly large difference between the multivariate OLS and TSLS estimates (0.06 vs. 0.21), the Hausman test fails to conclude that there is a statistical difference
between the two estimates. Therefore, OLS is chosen over TSLS because it generally yields more efficient estimators, and Column (1) is regarded in this analysis as the primary estimate of senior migration’s impact on low-wage service employment share. Essentially, failure to reject the null hypothesis in the Hausman test implies that the suspected endogeneity which motivated the IV approach is negligible. Thus, this study returns to the OLS framework as the basis of its main finding: one percentage point increase in the migration rate accelerates the growth in low-wage service industries’ share of total employment by 0.06 percentage points.
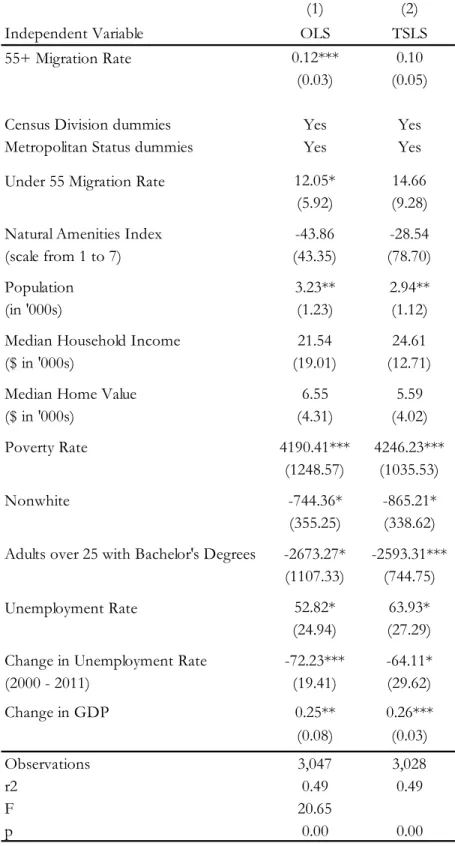
Table 6 shows the results of Alternative Model 1, which recoded the low-wage service employment variable as the change in the number of low-wage service jobs (as opposed to change in share of total employment in the primary model) and the independent variable into the number of 55+ in-migrants (instead of the cohort migration rate). As Column (1) shows, the 55+ migration estimates under multivariate OLS are positive and significant – every additional 55+ migrant accelerated the change in the number of low-wage service employment by an additional 0.12 jobs. This is notably less than the 0.41 jobs per in-migrant found by Sastry (1992), but Sastry focused on the state of Florida whereas the estimate here represents the average impact, at the county level, for the entire United States. Furthermore, the TSLS estimate (0.10) is remarkably close to that of the OLS and is
significant at 90% confidence.
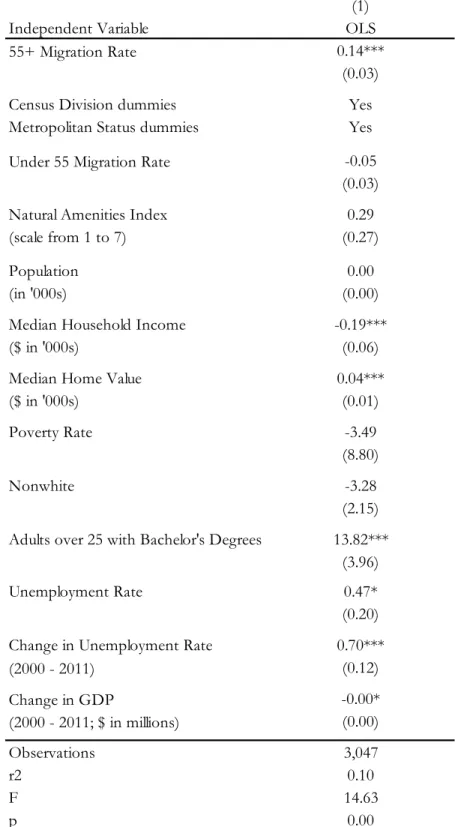
Table 7 shows the results of Alternative Model 2, which recoded low-wage service employment as the low-wage service sector share in 2011 rather than the change in this share between 2000 and 2011. Again, the OLS estimate of 0.14 is highly significant, implying that, all else equal, a one percentage point increase in a county’s 55+ migration rate boosts low-wage service industries’ share of total employment by 0.14 percentage points post-migration. As mentioned in Section 3, Alternative Model 2 is not suitable for a TSLS analysis.
instrumental variables approach is unnecessary, and that OLS alone is sufficient for obtaining an unbiased estimate of senior migration’s effect on low-wage employment.
Table 5: Change in Employment Share of Select Low-Wage Service Employment
(1) (2)
Independent Variable OLS TSLS 55+ Migration Rate 0.06* 0.21
(0.03) (0.15) Census Division dummies Yes Yes Metropolitan Status dummies Yes Yes Under 55 Migration Rate -0.03 -0.13
(0.03) (0.09) Natural Amenities Index 0.16 0.03 (scale from 1 to 7) (0.26) (0.30)
Population 0.00** 0.00
(in '000s) 0.00 0.00
Median Household Income -0.04 0.01
($ in '000s) (0.05) (0.07)
Median Home Value 0.01 0.01
($ in '000s) (0.01) (0.01)
Poverty Rate -2.43 2.54
(7.69) (8.15)
Nonwhite 1.49 1.88
(1.88) (1.81) Adults over 25 with Bachelor's Degrees 6.51 6.55
(4.09) (4.21) Unemployment Rate -0.03 -0.12 (0.19) (0.19) Change in Unemployment Rate 0.09 -0.04
(2000 - 2011) (0.13) (0.17)
Change in GDP -0.00* 0.00
(2000 - 2011; $ in millions) 0.00 0.00
Observations 3,047 3,028
r2 0.02 0.01
F 4.99
p 0.00 0.00
Table 6: Change in Number of Select Low-Wage Service Sector Jobs
(1) (2)
Independent Variable OLS TSLS
55+ Migration Rate 0.12*** 0.10
(0.03) (0.05)
Census Division dummies Yes Yes
Metropolitan Status dummies Yes Yes
Under 55 Migration Rate 12.05* 14.66
(5.92) (9.28)
Natural Amenities Index -43.86 -28.54
(scale from 1 to 7) (43.35) (78.70)
Population 3.23** 2.94**
(in '000s) (1.23) (1.12)
Median Household Income 21.54 24.61
($ in '000s) (19.01) (12.71)
Median Home Value 6.55 5.59
($ in '000s) (4.31) (4.02)
Poverty Rate 4190.41*** 4246.23***
(1248.57) (1035.53)
Nonwhite -744.36* -865.21*
(355.25) (338.62)
Adults over 25 with Bachelor's Degrees -2673.27* -2593.31***
(1107.33) (744.75)
Unemployment Rate 52.82* 63.93*
(24.94) (27.29)
Change in Unemployment Rate -72.23*** -64.11*
(2000 - 2011) (19.41) (29.62)
Change in GDP 0.25** 0.26***
(2000 - 2011; $ in millions) (0.08) (0.03)
Observations 3,047 3,028
r2 0.49 0.49
F 20.65
p 0.00 0.00
Table 7: Effect of 55+ Migration on Low-Wage Service Sector Share of Employment in 2011
(1)
Independent Variable OLS
55+ Migration Rate 0.14***
(0.03)
Census Division dummies Yes
Metropolitan Status dummies Yes
Under 55 Migration Rate -0.05
(0.03)
Natural Amenities Index 0.29
(scale from 1 to 7) (0.27)
Population 0.00
(in '000s) (0.00)
Median Household Income -0.19***
($ in '000s) (0.06)
Median Home Value 0.04***
($ in '000s) (0.01)
Poverty Rate -3.49
(8.80)
Nonwhite -3.28
(2.15)
Adults over 25 with Bachelor's Degrees 13.82***
(3.96)
Unemployment Rate 0.47*
(0.20)
Change in Unemployment Rate 0.70***
(2000 - 2011) (0.12)
Change in GDP -0.00*
(2000 - 2011; $ in millions) (0.00)
Observations 3,047
r2 0.10
F 14.63
p 0.00
4.3 Comparing the Impact between 55-65 and 65+ Age Cohorts
To test the hypothesis that younger migrants create a disproportionately greater impact on low-wage service employment, the three abovementioned analyses are conducted separately for the 55–65 and 65+ cohorts. Column (1) of Table 8 presents the estimated impact of each cohort from OLS regressions. Panel A compares the two cohorts in terms of their migration rates’ effects on the growth in low-wage service industries’ total job share. Panel B compares in terms of migration rate’s effect on the low-wage service industries’ job share in 2011, i.e. one year after the migration period. Panel C compares the cohorts in terms of how the number of in-migrants affect the number of jobs in low-wage industries.
The migration rates of those over 65 have a larger impact on the low-wage service share of total employment than those between 55 and 65 (Panel B). On a migrant-to-job basis (Panel C), however, in-migrants between 55 and 65 create substantially more jobs than their counterparts over 65. These findings bring up the issue of selection bias, since they suggest that more 55-65 migrants are moving to areas with more diversified (and perhaps larger) economies while the 65+ cohort seem to move to areas where low-wage service employment is more sensitive to senior migration (e.g. rural areas). While this scenario may not be the only explanation for the findings, they lend support to Das et. al.’s (2009)
conclusion that different types of migrants self-select their destination areas based on their own demographic and socioeconomic profiles.
4.4 Comparing the Impact across Regions and County Types
Columns (2) through (8) in Table 8 further breaks down senior migration’s impact on low-wage service employment by Census Region and county type. The combined 55+ cohort generate a larger impact in the South and West, where large numbers of retirees already live, relative to the Northeast and Midwest. Furthermore, counties with central cities tend to exhibit greater increases in low-wage service sector employment from retiree
Table 8: Comparison of Senior In-Migration's Impact on Job Quality by Age Cohort, Region, and County Type
(1) (2) (3) (4) (5) (6) (7) (8)
Region County Type
All Counties Northeast Midwest South West Central City Metro Outlying Rural A. Change in Low-Wage Service Emloyment Share
55-65 Migration Rate 0.03 -0.05 -0.08 0.04 0.08 0.04 0.02 0.02
(0.02) (0.13) (0.06) (0.02) (0.06) (0.03) (0.04) (0.02)
65+ Migration Rate 0.05* 0.05 -0.02 0.05 0.13* 0.06 0.02 0.05
(0.02) (0.10) (0.06) (0.03) (0.05) (0.04) (0.04) (0.03)
Combined (55+) 0.06* 0.01 -0.06 0.06 0.16* 0.08 0.02 0.05
(0.03) (0.15) (0.07) (0.03) (0.07) (0.05) (0.05) (0.03)
B. Low-Wage Service Employment Share in 2011
55-65 Migration Rate 0.07*** -0.03 -0.09 0.07* 0.16** 0.08** 0.08 0.07**
(0.02) (0.09) (0.06) (0.03) (0.05) (0.03) (0.05) (0.03)
65+ Migration Rate 0.12*** 0.19** 0.08 0.10** 0.14* 0.10** 0.07* 0.11***
(0.02) (0.06) (0.06) (0.03) (0.06) (0.03) (0.04) (0.03)
Combined (55+) 0.12*** 0.15 0.05 0.12** 0.22*** 0.14*** 0.11* 0.13***
(0.03) (0.09) (0.07) (0.04) (0.06) (0.04) (0.05) (0.03)
C. Change in Number of Low-Wage Service Industry Jobs
No. of in-migrants aged 55-65 0.29*** -0.21 0.3 0.32*** 0.29*** 0.31*** 0.17** 0.17***
(0.04) (0.24) (0.25) (0.05) (0.05) (0.05) (0.06) (0.04)
No. of in-migrants aged 65+ 0.16** -0.1 -0.21 0.27*** 0.26*** 0.16* 0.19*** 0.18***
(0.06) (0.09) (0.16) (0.05) (0.06) (0.07) (0.04) (0.05)
Combined (55+) 0.14*** -0.08 -0.06 0.16*** 0.14*** 0.12*** 0.10*** 0.10***
(0.03) (0.07) (0.11) (0.02) (0.03) (0.03) (0.02) (0.02)
4.5 Limitations
Several issues potentially limit the internal and external validity of the analytical results. First, the classification of low-wage service sector employment by industry ignores the fact that each industry fields many occupations, not all of them low-wage. Nevertheless, all jobs that fall in a low-wage service industry are regarded as low-wage service employment in this analysis. BLS does publish employment data by occupation through its Occupation Employment Statistics (OES) program, but this data is not available at the county level.
Second, selection bias still seems to be an issue despite controlling for counties’ geographic and socioeconomic characteristics. The finding that migration rates of the 65+ cohort affect low-wage service shares more than those of the 55-65 cohort and that this relationship is reversed on a migrant-per-job basis suggests that endogeneity within the model still exists. The source of this problem is the heterogeneity of retired in-migrants, which I attempted to address by analyzing the 55-65 and 65+ cohorts separately and by interacting the migration variable with geographic and county type dummies. However, other heterogeneous features moderating retired in-migrants’ labor market impact likely exist. Thus, if endogeneity indeed persists, the internal validity of this analysis would be significantly weakened.
Third, the relatively small number of control variables used in this analysis may contribute to endogeneity and omitted variable bias. In particular, most of the controls account for heterogeneity between counties at the start of the migration period, but only two variables (unemployment rate change and GDP change) address contemporaneous time shocks and trends occurring during the migration period. These two controls are likely insufficient in addressing all contemporaneous shocks that might bias the results.
Fourth, this analysis implicitly assumes that almost all migrants over 55 are retired and thereby affect regional labor markets solely through their consumption activities. If in fact a notable percentage of these migrants continue to work in their new communities, the analysis would by definition be endogenous. This is because the migrant’s entry into the regional labor market would bias the share of low-wage service employment downward if the migrant’s job is not part of the low-wage service sector and upward if it is.
Fifth, the cohort projection method used to construct the migration data prevents this analysis from examining how the timing of migration affects regional employment. Retired in-migrants who moved in 2001, for instance, are given the same weight as those who moved in 2009 even though the earlier migrants have more time to impact the labor market. Additionally, the analysis fails to capture the impact of migrants who moved to a county during the migration period but moved elsewhere before the end of the period. Such a migrant would be counted in the county where they reside in the period’s end, and the employment impact from their intermediate moves during the period would go unmeasured. This flaw is another source of bias in the analysis.
county-to-county migration data for each year between 1991 and 2011, but this data only segments migrants by income levels and not by age cohort (though age breakdowns are available in IRS’s state-to-state migration files).
5. Discussion
The findings of this analysis should provide local governments with a better view on the benefits and drawbacks of retiree in-migration. Namely, retired in-migrants do spur job creation in destination communities, but the new jobs appear to be low in quality and pay. For communities where a lack of quality jobs is already an issue, an influx of retirees can further entrench low-wage labor into a key fixture of the local economy. However, migrating retirees also bring with them a host of opportunities to their new communities, some of which local governments can use to mitigate some of the negative consequences associated with in-migration. If local governments can realize the potential benefits of retiree in-migrants while planning ahead to deal with the expected consequences, communities may very well enjoy a net positive impact from retiree in-migration. 5.1 Retiree Integration
One potential strategy for local governments is to leverage the tax revenue generated by retirees to fund local economic development efforts, such as workforce development, employer recruitment, and entrepreneurship support. Retired in-migrants add to the local tax base, and the property and sales taxes collected from them represent an opportunity to mitigate the adverse economic and environmental impacts associated with in-migration. For example, the additional tax revenue can subsidize job training programs for low-wage
workers as part of a broader strategy to upskill the local labor force. It can also fund small business loans and innovation grants to grow quality jobs from within the community, or help form incentive packages to attract jobs from the outside. In short, local governments should take advantage of retirees’ positive fiscal impact to address their communities’ economic development challenges.
opportunities. These social networks, in turn, offer retirees access to additional volunteering opportunities in a mutually reinforcing cycle (Tang 2015).
The key lesson here, that many retirees need and want to be active, opens up a wealth of opportunities for local governments to create a mutually beneficial relationship between retired in-migrants and their receiving communities. Retirees, for example, can help educate and train younger people at local schools and community colleges, thereby contributing to local workforce development. They can also volunteer their time at community institutions and participate in local government decision-making. The fact that retired amenity-seeking migrants tend to be relatively wealthier and more educated should make them valuable assets to communities struggling with challenging economic conditions. The expertise and ideas these retirees bring should be valued, and local governments should invite retired
in-migrants to participate in the economic development planning and implementation process. To this end, local governments can invest in facilities and programs that facilitate an active and engaged senior community. Public libraries and community centers provide a welcoming space for retirees to gather, while parks and other recreational facilities offer opportunities not only for physical activity but also social interaction. Beyond facilities, local governments and community leaders should develop pipelines and programs which connect retirees (and other non-labor force participants) to volunteer opportunities and part-time work. These leaders, furthermore, should work with employers and organizations to enhance volunteer and employment programs with the goal of integrating retirees into the local economy. This integration is especially important for rural and underdeveloped areas, since their lack of the goods, services, and amenities retirees desire often result in a leakage of economic activity to surrounding areas. If communities can successfully induce retirees to spend more time and money locally, a goal which is greatly aided by senior-oriented facilities and programs, it is likely that a portion of the economic activity which would otherwise have leaked out stays in the community.
Despite the economic development potential of the abovementioned strategies, successful execution depends in large part on the social and political dynamics between retired in-migrants and existing residents. Reeder (1992) notes that retired in-migrants may have their own political agendas regarding land use issues and local government spending and taxes that are sometimes at odds with the receiving community’s. For example, retirees have been found to be less supportive of economic development spending when they believe that this might detract from their quality of life (Reeder 1998). The issue of housing affordability is also a source of tension in many destination areas, as places experiencing rapid retiree in-migration and/or have a limited land supply (e.g. Asheville, NC) may
experience housing demand increases to such an extent that existing residents would not be able to purchase or rent housing units locally (Reeder 1998). Solutions to these issues are not always straightforward, but proactive planning and action on the part of local
5.2 Considerations for Retirees Aging in Place
Longer-term, as retired in-migrants age, local governments will be confronted with less retiree spending activity and more public service costs (Mullins and Rosentraub 1992). Mullins and Rosentraub (1992) find that local government spending increases across almost all categories as the elderly age and not only in health services as one would expect. The authors theorize that seniors’ preferences shift from private spending to public goods consumption as they age, a shift which may be driven by “fears concerning social isolation, fiscal dependency, personal safety, a loss of mobility,” and other factors that threaten their ability to live independently (Mullins and Rosentraub 1992).
Local governments should plan ahead for higher future expenditures and invest in the infrastructure and jobs that accommodate the needs of older retirees. Places with large numbers of retirees may even explore the development of retirement communities that offer assisted living units and nursing care facilities. Rural areas, however, would be challenged to access the labor and fund the infrastructure needed to care for large numbers of older retirees, which may result in waves of assistance-driven migration back to urban and suburban areas where healthcare services are more available. Thus, the fiscal benefits created by retired in-migration may only be true in the short-term, and the net fiscal impact in the long run may be zero or even be negative.
As mentioned earlier, however, retired in-migrants’ potential impact extends beyond the fiscal or economic impacts generated through their spending activities. In a community where retiree integration has succeeded, the less active and older retirees would have already made substantial contributions to their community as volunteers, educators, advisors, workers, and local citizens, having engaged with and helped shape social and economic life through their non-monetary activities. This contribution is no less important, and may be even more significant, than their monetary contributions to the local tax base or the economic base. The reason is that economic development spurred by this type of activity can gradually lead to structural change in a local economy and alter the socioeconomic trajectory of a community. If, instead, one limits the analysis of retiree in-migration solely to fiscal or labor market impacts, one ignores the full range of economic development
possibilities local governments can cultivate when retirees move to their communities.
6. Conclusion
This project explores the impact of retiree migration on regional job quality using an econometric research design. Overall, it finds that retiree migration has a positive and significant impact on employment growth in low-wage service industries. Furthermore, this impact varies depending on the type of retired migrant as well as the geographic
within the literature that retiree in-migration increases overall employment levels but decreases job quality.
For policy-makers seeking to better understand the benefits, costs, and opportunities of retiree migration on local economies and communities, the findings highlight the
importance of employing a proactive strategy that realizes the potential benefits of retiree in-migration while mitigating some of its adverse consequences. Though retirees’ consumption patterns may stimulate demand for low-wage service sector labor, their ability to contribute to economic and community development cannot be overlooked. Policies that promote an active retiree population which is economically and socially integrated into the community can endow struggling regions with a valuable asset to help them achieve long-term
development goals.
For researchers seeking to further investigate the impact of retiree migration, this project provides a methodological foundation for more robust econometric analyses. Future research should address problems with selection bias and search for additional instruments to resolve the issues with internal validity experienced in this project. The use of panel data techniques, moreover, can yield a finer and more robust analysis than standard OLS or IV, but researchers would need to obtain time-series migration and occupational employment data at the county level. Lastly, researchers should consider qualitive research methods, such as case studies and interviews, to study the intangible socioeconomic impacts of retire in-migrants and the processes through which those impacts occur.
The need for a comprehensive understanding of retiree migration’s impact on local communities has never been more relevant. The large-scale migration of baby-boomers in search of a better quality of life has been ongoing for some years, but the early 2020’s is the time when baby-boomers entering retirement age will peak. After the baby-boomers, future generations of retired migrants will make their own impact on local communities.
References
Bureau of Economic Analysis. GDP by County and Metro
CAINC30__ALL_AREAS_1969_2018. 2018. https://www.bea.gov/data/gdp/gdp-county-metro-and-other-areas
Bureau of Labor Statistics. Quarter Census of Employment and Wages. 2001. https://www.bls.gov/cew/downloadable-data-files.htm
Card, David. "Immigrant inflows, native outflows, and the local labor market impacts of higher immigration." Journal of Labor Economics 19, no. 1 (2001): 22-64.
Das, Biswa R., Daniel V. Rainey, and Wayne P. Miller. "Spatial Variability of Economic Impacts: Examining a Hypothetical Retiree In-migration Policy." Journal of Regional
Analysis and Policy 39, no. 1100-2016-89705 (2009).
Day, Frederick A., and Jon M. Barlett. "Economic impact of retirement migration on the Texas Hill Country." Journal of Applied Gerontology 19, no. 1 (2000): 78-94. Deller, Steven C. "Economic impact of retirement migration." Economic Development
Quarterly 9, no. 1 (1995): 25-38.
Federal Reserve Bank of St. Louis. “How Many People Will Be Retiring in the Years to Come?” St. Louis Fed. Federal Reserve Bank of St. Louis, June 6, 2019.
https://www.stlouisfed.org/on-the-economy/2019/may/how-many-people-will-be-retiring-in-the-years-to-come.
Glasgow, Nina, and Richard J. Reeder. "Economic and fiscal implications of
nonmetropolitan retirement migration." Journal of Applied Gerontology 9, no. 4 (1990): 433-451.
Greenwood, Michael J., and Gary L. Hunt. "Migration and interregional employment redistribution in the United States." The American Economic Review 74, no. 5 (1984): 957-969.
Howell, David R., and Arne L. Kalleberg. "Declining job quality in the United States: Explanations and evidence." RSF: The Russell Sage Foundation Journal of the Social Sciences 5, no. 4 (2019): 1-53.
Humphreys, M. H., and B. D. Kochut. "Golden Rules: Evaluating Retiree-Based Economic Development in Georgia." Selig Center for Economic Growth, Terry College of Business, University of Georgia. https://www. terry. uga.
Hyra, Derek. "The back-to-the-city movement: Neighbourhood redevelopment and processes of political and cultural displacement." Urban Studies 52, no. 10 (2015): 1753-1773.
Lozano, Fernando A., and Michael D. Steinberger. "Empirical methods in the economics of international immigration." Handbook of Research Methods in Migration (2012): 163-185.
McGranahan, David A. Natural amenities drive rural population change. No. 1473-2016- 120765. 1999.
Moulton, Jeremy. Instrumental Variables (Lecture Slides for HPM/PLCY 882: Advanced Panel Data Methodology). 2019
Mullins, Daniel R., and Mark S. Rosentraub. "Fiscal pressure? The impact of elder recruitment on local expenditures." Urban Affairs Quarterly 28 (1993): 337-354. OECD, Sep. "How good is your job? Measuring and assessing job quality." (2016): 79-139.
Organisation for Economic Co-operation and Development. OECD Employment Outlook: June 2001. Organisation for Economic Co-operation and Development, 2001.
Reeder, Richard J. Retiree-attraction policies for rural development. No. 741. US Department of Agriculture, Economic Research Service, 1998.
Sasin, Marcin J., and David McKenzie. Migration, remittances, poverty, and human capital: conceptual and empirical challenges. The World Bank, 2007.
Sastry, M.L. (1992), Estimating the Economic Impacts of Elderly Migration: An Input‐ Output Analysis. Growth and Change, 23: 54-79.
doi:10.1111/j.1468-2257.1992.tb00572.x
Serow, William J. "Economic consequences of retiree concentrations: A review of North American studies." The Gerontologist 43, no. 6 (2003): 897-903.
Serow, William J., and William H. Haas. "Measuring the economic impact of retirement migration: The case of western North Carolina." Journal of Applied Gerontology 11, no. 2 (1992): 200-215.
Shields, Martin, Judith I. Stallmann, and Steven C. Deller. "Simulating the economic and fiscal impacts of high-and low-income elderly on a small rural region." Review of Regional Studies 29, no. 2 (1999): 175-196.
transition to retirement. Policy Press, 2005.
Stallmann, J. I., S. C. Deller, and M. Shields. “The Economic and Fiscal Impact of Aging Retirees on a Small Rural Region.” The Gerontologist 39, no. 5 (January 1999): 599– 610. https://doi.org/10.1093/geront/39.5.599.
Tang, Fengyan. "Retirement patterns and their relationship to volunteering." Nonprofit and Voluntary Sector Quarterly 45, no. 5 (2016): 910-930.