ROAD TO SERF-DURHAM: EXAMINING THE DECLINE OF THE AFRICAN-AMERICAN ENTREPRENEURSHIP
ECOSYSTEM IN THE UNITED STATES (PAST, PRESENT, AND FUTURE)
Henry Clay McKoy, Jr.
A dissertation submitted to the faculty at the University of North Carolina at Chapel Hill in partial fulfillment of the requirements for the degree of Doctor of Philosophy in the Department
of City and Regional Planning.
Chapel Hill 2018
Approved by: Meenu Tewari
Nichola J. Lowe
Roberto G. Quercia
William M. Rohe
ii
© 2018
iii ABSTRACT
Henry Clay McKoy, Jr.: Road to Serf-Durham: Examining the Decline of the African-American Entrepreneurship Ecosystem in the United States (Past, Present, and Future)
(Under the direction of Meenu Tewari)
Business ecosystems are gaining in attention in contemporary scholarship. Historically,
research has focused on how firms compete against other firms, how industries compete against
other industries, or how markets compete against other markets (Moore, 1993; Mason & Brown,
2014). Attention is now turning to how business ecosystems compete against other business
ecosystems. This dissertation introduces the concept of community economic ecosystem to the
body of business and entrepreneurship ecosystem literature as a central component of
understanding economic development, and applies it to study race as a contextual variable within
entrepreneurial ecosystems and their outcomes.
The first paper asks whether minority entrepreneurs have achieved parity with their
shares of the national population in terms of business formation, growth and expansion. The
findings suggest that America’s various business ecosystems seem to have moved from de jure
segregation to de facto segregation, as opposed to fuller integration. While the overall diversity
of the business ecosystem is changing rapidly, the business success ecosystem might not be
iv
The second paper asks what impact would the location of black entrepreneurs in minority
entrepreneurial hubs, such as Atlanta, Georgia and Durham, North Carolina have on the relative
economic equity of those populations compared to other racial groups in the area. The findings
suggest that even in communities with relatively sizable black populations, high levels of black
formal human capital, black experiential human capital, black wealth, black entrepreneurial
spirit, and black political leadership, the economic outcomes for the black community still lag
behind other communities.
The final paper asks whether entrepreneurship provides a viable means for advancing
mutually beneficial economic outcomes for black Americans – individually and collectively; and
whether it ever has. A reinterpretation of Durham’s historic Hayti community, from the end of
the Civil War to the end of the Civil Rights Era, illustrates that this racial enclave was able to
utilize strategic upbuilding to construct a “group economy” effective at combating overt
discrimination, relying on the institutional anchoring of their community via financial,
v
vi
ACKNOWLEDGEMENTS
First and foremost, I am a man of great faith. So, I want to thank God for the mercies
bestowed upon me, not only during this chapter of my life, but throughout my life.
It is impossible to undertake and complete a journey like this without the help, patience,
and guidance of a great many people. I want to begin by thanking my advisor, Meenu Tewari,
who served as a steady and patient guide for me throughout this process. Because of her I will
always remember to ask the question – “under what conditions did something occur?” –
recognizing that component is as much a part of the narrative as what actually occurred.
Likewise, I would like to sincerely thank each of my dissertation committee members – Nichola
Lowe, Roberto Quercia, Bill Rohe, and Jim Johnson. Each of them brought a unique perspective
to this work that would have otherwise been missing.
I thank Nichola specifically for the enthusiasm in my work, and expressing joy in
learning new things, even while suggesting additional perspectives that I should consider. I
thank Roberto specifically for always offering sage advice, while reminding me to write not only
for the audience who already knows the background literature, but also for the audience that does
not know it. I thank Bill specifically for asking the hard questions that often forced me to
reconsider a strategy of research or presentation of material. I thank Jim specifically for his
vii
Ownership (SBO) datasets from the U.S. Census Bureau. These data literally changed the course
of my thinking, my research, my dissertation, and likely my future. Each committee member
challenged me to be better than I was.
Thank you to Dr. Mark Little and the Kenan Institute of Private Enterprise at the
University of North Carolina at Chapel Hill for awarding me with the 2016 KIPE Fellowship to
work with Jim. I am forever grateful for that. I also want to thank Dr. Deborah Gallagher of
Duke University, who provided her input early in this process as a member of my program
committee.
I would also like to thank my program cohort – Kirstin Frescoln, Chaosu Li, and Mathew
Palmer – who served as my extended family especially during those early years of coursework.
The dinner conversations and academic decompression sessions will always be special times for
me. I also thank the many other UNC DCRP students, faculty, and staff who made my journey
through the program engaging and enlightening. I could not imagine a better “school” family.
Next, I want to thank my “home” family. I want to offer the greatest thanks to my wife
of 22 years, and mate of 25 years, Euba – and my two children, Jamila Anne and Jalen Anthony.
They made all of this relatively painless by always giving me whatever space I needed to work
and explore. I also want to thank my siblings – Lisa Anne, Linda Denise, Henrietta Elise (she is
going to be mad I used her first name), Tiana Sharise, and Franklin Earl. Growing up in a big
family allows for endless hours of learning how to debate and craft an argument. So, thanks for
the early training. Thank you specifically to the Core IV. Being a little brother has not been bad
at all. I appreciate your ongoing collective encouragement that has always given me the
viii
I want to thank my parents, Henry Clay McKoy, Sr. and Belinda Odessa Jones McKoy.
My dad spent 35 years serving America as an enlisted man in the United States Army. He
fought, so that I could have the freedoms to pursue my dreams. As for my mother, this
manuscript is dedicated to her. She did not live to see any part of this journey, passing away in
March 2007. Yet, I still think about her every single day, and she continues to provide me with
daily inspiration and drive to succeed, even in the face of challenges. She was an entrepreneur at
the end of her life before sickness sidelined her. I owe some, or maybe all, of my entrepreneurial
spirit to her. My mother is also the reason that this acknowledgement is so long.
I received an incredible honor in March 2006 when I was inducted into the University of
North Carolina (Chapel Hill) Sports Hall of Fame. In my humility, I chose not to give a speech
that night. I should have. I thought I had plenty more platforms to utilize for my appreciations,
in the years ahead, when I made the decision. What I did not account for was that all of the
people that I appreciate might not be around in those years ahead. A year later she was gone.
My mother is the largest embodiment of that missed opportunity to thank the people that I loved
for what they contributed to my success – specifically her. I said I would never make that
mistake again. This extended acknowledgement is a fulfillment of that promise.
Finally, I want to thank the African and African-American diaspora beginning with my
grandparents and direct ancestors. As I learn more about my history through the ancestry work
of my oldest sister, it has made me appreciate them all even more. They lived during some of
the periods that I covered in this manuscript. Throughout this work, I talk about understanding
“context.” They lived during times, and under conditions, that are hard for me still to imagine
ix
Both of my grandmothers, Lucy and Minnie, were domestic housekeepers who worked
for upper middle-class white families. My paternal grandfather, Jasper, was a sharecropper. My
maternal Robert Jones, was at one time, one of the leading black farmers in Cumberland County,
North Carolina. Born in 1892, he eventually owned over 100 acres of land, had both black and
white workers, and was a wealthy man during his time. I never got to meet him, as he was
deceased before I was born – and by the time I was born, that wealth was gone and all that
remained were the few acres that I grew up on – but I hear that he was a heckuva entrepreneur.
One additional thanks to all the individuals, lives, and stories that I discovered during my
research journey. They had to endure discrimination, racism, and hostilities unfathomable to me,
but that were necessary for me to be able to sit here and pen these words today. I thank them for
their stories. If they could achieve what they did during their times, I have no reason not to keep
striving for a better future for “Africans in America.” With that, I cannot conclude without
thanking all of the current African diaspora, here in America, and abroad, that still suffer daily
indignities, pain, hardships, discrimination, hostilities, and even death, for no other reason than
being black.
Kermit the Frog once sang the words:
“It’s not easy being green.”
Well, he should try being black. Or more accurately, black and blue. The jazz standard
“Black and Blue,” composed by Fats Waller with lyrics by Harry Brooks and Andy Razaf, and
later made famous by jazz legend Louis Armstrong, ends with the line:
“How will it end? /Ain’t got a friend/ My only sin is in my skin/What did I do to
x
As I said at the beginning, I am a man of great faith – so I am eternally hopeful that we as
a community of people will get to where we need to. I do not know how it will end. However, I
hope that this work helps along that path; and honors the struggles of those who came before me,
xi
TABLE OF CONTENTS
LIST OF TABLES... xv
LIST OF FIGURES ... xvii
LIST OF ILLUSTRATIONS...xviii
INTRODUCTION ... 1
Background... 3
Empirical Context – Black Entrepreneurship, Wealth and Economic Equity... 8
Three Papers………... 12
REFERENCES... 18
PAPER 1: DO ECOSYSTEMS SEE COLOR?... 21
Introduction ... .21
Critical Background and Context... 23
Empirical Strategy & Analysis... 27
Findings………... 29
Parity Analysis………... 31
xii
Conclusions and Implications for Future Research... 36
Acknowledgement... 38
REFERENCES... 39
PAPER 2: MEASURING THE EQUITY OF DIVERSE COMMUNITY ECONOMIC ECOSYSTEMS: A COMPARATIVE ANALYSIS OF TWO OF AMERICA’S LEADING BLACK ENTREPRENEURIAL HUBS, ATLANTA AND DURHAM... 42
Introduction ... 42
Empirical Strategy and Methodology: The HEPI... 45
Testing and Applying the HEPI to Atlanta, GA and Durham, NC... 54
A-priori Expectations ... 63
Findings ... 66
Discusssion………... 73
Conclusion………... 78
REFERENCES... 83
PAPER 3: THE RISE AND FALL OF HAYTI: A REINTERPRETATION OF BLACK DURHAM’S COMMUNITY ECONOMIC ECOSYSTEM, 1865-1958... 88
Introduction ... 88
Middlemen, Cultures, and Enclaves: The Scholarship on Black Entrepreneurship.…….91
xiii
The Rise of Hayti………... 103
The Five C’s of Hayti ... 106
The Decline of the Hayti Ecosystem... 129
Conclusions: Lessons from Hayti... 137
REFERENCES... 144
CONCLUSION... 149
Contributions... 154
Limitations………... 155
Implications for Future Research ... 157
REFERENCES... 162
EPILOGUE... 164
The Past Matters ... 164
Contemporary Context ... 169
The Road to Serf-Durham ... 173
REFERENCES... 177
APPENDIX A: REPRESENTATIVE ENTITIES IN DURHAM’S HAYTI DISTRICT ECOSYSTEM, 1865-1958... 180
xiv
APPENDIX C: HAYTI COMMUNITY ECONOMIC ECOSYSTEM
UPBUILDING PROCESS ... 197
xv
LIST OF TABLES
PAPER 1 ... 21
Table 1. Absolute and Relative U.S. Population Change, 2007-2012………...……29
Table 2. Shifts in Shares of Total Population by Race/Ethnicity, 2007-2012………….……….29
Table 3. Changes in U.S. Small Business Ownership by Race/Ethnicity, 2007-2012…………..30
Table 4. Shifts in Shares of Business Ownership of Firms With and Without Paid Employees, 2007-2012……….……….30
Table 5. Race/Ethnic Equity/Disparity Quotients Using Whites as Reference Group, 2007-2012………..………32
PAPER 2...42
Table 1. HEPI Variables………....49
Table 2. HEPI Share Calculation Table……….…50
Table 3. U.S., Atlanta, and Durham Areas Population, Firm, Revenue, and Poverty Share by Race/Ethnicity, 2012………...………..66
Table 4. Over-/Under-representation U.S., Atlanta, and Durham Areas Population, Firm, Revenue, and Poverty Share by Race/Ethnicity, 201.……….….68
Table 5. Indexed Equity Quotient (IEQrace) for U.S., Atlanta, and Durham Areas by Race/Ethnicity, 2007, 2012………...…….72
xvi
Table 7. Economic Ecosystem Equity Gap Score for U.S., Atlanta, and Durham Areas by
Race/Ethnicity, 2007, 2012………...….75
Table 8. Absolute and Relative U.S. Population Change, 2007-2012………...78
Table 9. Changes in U.S. Small Business Ownership by Race/Ethnicity, 2007-2012…………..78
Table 10. Hygioeconomic Composite Score for U.S., Atlanta, and Durham Areas by Race/Ethnicity, 2012……….81
PAPER 3...88
Table 1: Community Economic Ecosystem Framework (Description)……….…..101
xvii
LIST OF FIGURES
PAPER 2...42
Figure 1. Hygioeconomic Index………....71
Figure 2. Hygioeconomic Ecosystem Equity Gap for U.S., Atlanta, and Durham Areas by Race/Ethnicity, 2007, 2012………....77
PAPER 3...88
xviii
LIST OF ILLUSTRATIONS
PAPER 3...88
Illustration 1: Individual and Institutional Anchor Relationships………...….117
Illustration 2: Community Economic Ecosystem Interactions………....120
INTRODUCTION
Business ecosystems are gaining in attention in contemporary scholarship. Historically,
research has focused on how firms compete against other firms, how industries compete against
other industries, or how markets compete against other markets (Moore, 1993; Mason & Brown,
2014). That examination is now turning to how business ecosystems compete against other
business ecosystems. A major goal of this dissertation is to introduce the concept of the
community economic ecosystem to the growing body of business and entrepreneurship ecosystem
literature as a central component of understanding economic development. Like other economic
ecosystems, community economic ecosystems also compete against one another.
The concept of the business ecosystem is well-known. A business ecosystem is a
network of organizations – including suppliers, distributors, customers, and competitors –
involved in the delivery of a specific product or service through both competition and
cooperation (Moore, 1993). The concept of a community economic ecosystem is a broader one
than that of an entrepreneurship or business ecosystem. The community economic ecosystem
includes greater interactions across a wider range of diverse and varied community members. In
2
solely in business and entrepreneurial ecosystems. The interactions tend to be built around trust,
mutual benefits, and a desire for collective achievements.1
The foundational idea of this dissertation began with the discovery of data – and the
desire to better understand those data. Following the release of the US Census Bureau’s most
recent Survey of Business Ownership data (2012), interesting patterns and trends related to
minority entrepreneurship emerged. More specifically, enormous entrepreneurial disparities
between whites and each of the other major American racial groups (blacks, American Indians,
Hispanics) were identified, save perhaps Asians (McKoy & Johnson, 2018). The
African-American entrepreneurial ecosystem lagged in every category of success, except in the growth
rate, where they were among the leading racial groups in starting new firms. This led to the
question of “Why does black entrepreneurship look the way it does in contemporary America?”
This question became the spine of a 2.5-hour event (originally scheduled for only 90-minutes) on
a Spring 2017 evening in Durham, North Carolina’s old Hayti community – once the leading
black entrepreneurial hub in America (Butler, 1991; 2005; Brown, 2008). That event became the
basis of the three specific papers around which this dissertation was structured.
3 Background
On Thursday, June 15, 2017, in Durham, North Carolina, more than 300 people gathered
inside a modest community sanctuary during the early evening to discuss the future of local
economic development. The event was being hosted by the Durham Committee on the Affairs of
Black People, a civic and political organization founded in 1935 for the betterment of the local
black community (DCABP, 2018). This assemblage included a diverse population of local
public officials, political candidates, elected officials, citizens and residents. The diversity of
those in attendance included race/ethnicity, gender, income, education, age, local neighborhood,
4
the only diverse context of the event. At least three additional aspects would contextually frame
the evening’s conversation.
First, the gathering was being presented as part of the local Juneteenth series of events.
Juneteenth is the annual holiday celebrated by some communities to commemorate the date
when the last American slaves learned of their independence on June 19, 1865 (Juneteenth,
2018). President Lincoln’s Emancipation Proclamation went into effect on January 1, 1863, but
it took more than two years for the news of freedom to reach blacks in Texas. Durham holds
annual events during the week of Juneteenth.
Next, the location of the event was historically significant. The event was being held in
the sanctuary of the Hayti Heritage Center, a cornerstone of the once bustling Hayti District. The
name “Hayti” referred to Durham’s historically black community renowned for its robust black
entrepreneurialism in the century following slavery. At various times during this period,
Durham became alternatively known as “the capital of the Black Middle Class,” “the City on the
Hill for Blacks,” “Black Wall Street,” location of the most African-American millionaires per
capita in the United States, and home to hundreds of black businesses, including the largest
black-owned business in the world (Brown, 2008). However, in June 2017, the Hayti District
was not even a shell of itself. Partly because of broader economic trends following social
integration, the construction of a highway through the heart of the district, and global economic
forces, Hayti was no longer a social and economic marvel. An area once home to numerous
keystone institutions had very few remaining community anchors. The Hayti Heritage Center
was one of those few remaining institutions from the prior century – actually, the nineteenth
5
Finally, the gathering was presented as a moderated discussion about the next phase of
economic development and investment in Durham. If an American-Tobacco-anchored
downtown and a robust black entrepreneurial ecosystem had been economic cornerstones of late
nineteenth and early twentieth century Durham, both had crumbled by the end of that century.
However, since the beginning of the new century, significant capital investments had provided a
second life for the downtown. Additional capital supported economic development growth in
other areas of Durham, specifically in the northern and southern geographies. South Square,
Northpoint, New Hope Commons, and Southpoint, were all new or upgraded development
projects consisting of various mixes of retail, residential, and commercial anchors. Still, no area
saw the type of public and private capital investment as did downtown Durham, estimated at
over $1.2 billion (DDI, 2018). The return on investment had been significant. Durham was now
being mentioned alongside entrepreneurial hubs like Austin, Boston, San Francisco, and even
Silicon Valley (Moretti, 2012). Some rankings placed it as the best place in America for
entrepreneurship.
While northern, southern, and downtown Durham had each received significant capital
investments for economic development, east Durham had received virtually none. East Durham
was the historically black and low-income area, which had seen little change in the previous
decade of surrounding growth, except that it had become browner and poorer. But because of
that surrounding growth, gentrification was now becoming a reality (White, 2016). Areas once
the exclusive domain of only the poorest citizens of the community were now being purchased
for hundreds of thousands of dollars; primarily by those relocating from northern or western
states. The lack of affordable housing in Durham, as well as the demographics of who should
6
moving to Durham annually, many of them educated and white, the central questions were who
the next phase of Durham would be built for, who would benefit, and who would be left behind?
In short, the question of the night was who would the future of Durham belong to?
The title of the Hayti event was “Building a Durham Economy that Works for All.” Over
the course of 2.5 hours, the moderated conversation advanced sequentially across three
discussions – covering Durham’s economic past, present, and potential future.
Discussion #1
The Past: For some, learning about the past, particularly the rise of Durham’s Black Wall
Street in the midst of the segregated Jim Crow south, was a source of great fascination, pride and
joy. For others, the eventual decline and decay of the Hayti District evoked sorrow, pain and
ultimately, anger. Many of the African-Americans, when hearing about (or recalling) the
freeway construction that leveled Hayti nearly six decades prior, and its intentionality, expressed
sentiments of anger at what the community had lost, and under what circumstances. At times, all
these emotions seemed simultaneously present in the room. Whatever the past state of Durham,
it was no longer a black mecca of economic progress or prosperity.
Discussion #2
The Present: Referencing the most recent United States Census Survey of Business
Owners (SBO) data (2007, 2012), and other community indicators, many in attendance at Hayti
seemed surprised at Durham’s current economic and social conditions. Among the most
shocking findings from the data was that Durham’s black entrepreneurial population had grown
much slower than other major cities in North Carolina, and the state overall. From 2007 to 2012,
7
but only 14 percent in Durham (SBO, 2007, 2012). More surprising, not only did Durham rank
lower than major metropolitan statistical areas (MSAs) like Charlotte, Raleigh, Greensboro, and
Winston-Salem, among others, in black entrepreneurial growth, but also lower than the much
smaller, and more rural, community of Rocky Mount. Furthermore, though Durham’s black and
white populations were essentially equal numerically, blacks while significantly
underrepresented in business, were significantly overrepresented in poverty. For a city that
professed a desire to be the most diverse entrepreneurial hub in the world (Graves-Manns &
Klein, 2015), and aspired to work equally for all, these facts challenged Durham’s core belief of
itself – as an equitable community.
Discussion #3: The Future
The Future: If the “past” and “present” discussions created the most dissention in the
sanctuary, as attendees sought to assign fault and blame for the current state of black Durham,
the “future” discussion created the most bewilderment. Though eight distinguished panelists
representing the public, private, philanthropic, academic, and community sectors shared their
insights and knowledge, none offered definitive solutions to the locally identified challenges.
Even the most vocal audience members appeared at a loss about how to reverse Durham’s
inequitable trends. Imagining an economy that worked for all appeared easier than designing
one. Nearly everyone in the room that evening agreed that Durham’s economic development
ecosystem was not functioning for all. But no one seemed able to offer concrete solutions. For
many, there seemed to be broader forces at work that the community could only hope to slow,
but not stop completely. The oldest members of the audience, and many blacks who knew its
8
Empirical Context – Black Entrepreneurship, Wealth and Economic Equity
Surface level data, news reports and the popular press would suggest that there has never
been a better time to be a minority entrepreneur. According to the Survey of Business Owners
(2012), minority entrepreneurship rose 39 percent from 2007 to 2012, while white
entrepreneurship barely bulged, and contracted in some areas (Arora, 2016). This would suggest
that numerically, minorities writ large, are moving closer to entrepreneurial parity with their
white counterparts, which is a prerequisite for economic parity. As their buying power continues
to rise, the minority population would seemingly be poised to support this rising class of
entrepreneurs birthed from their own communities – helping them grow and scale to new
heights. These broader demographic winds of change would seem to facilitate a shift from
entrepreneurial headwinds to entrepreneurial tailwinds for communities of color. However, the
condition on the ground seems considerably different; at least for some minority populations.
Minority entrepreneurs and their associated populations do not all seem to be succeeding at the
same rate in America.
Data from the most recent Survey of Business Owners (2012) reports the tremendous
ongoing gap between sales, revenue and profits of minority-owned and non-minority-owned
firms. This gap is usually associated with the difference between firms with paid employees and
those without paid employees. American firms in 2012 recorded $33.5 trillion in revenue.
Ninety-seven percent of that revenue, or $32.5 trillion, was earned by firms with paid employees,
with the remaining percentage being earned by firms without employees. No entrepreneurial
population in this context is as underrepresented as African-Americans. Black entrepreneurs
have significantly less sales and employees than their counterparts. Data suggests this could be
9
businesses. Austin (2016) suggests that increases in formal human capital (i.e., education),
experiential human capital (i.e., work and managerial experience), and wealth (i.e., financial
capital) increases entrepreneurial success, as does immigrant status. Yet, even as
African-Americans have seen gains in those areas, their entrepreneurial success seems to be declining.
Though some would suggest that overt racism is a driving factor of the entrepreneurial success
gap, others would argue that following the election, and reelection of America’s first
African-American President, that the United States is a post-racial society (Holmes, 2015). The truth is
likely more complicated.
Research shows the wealth gap between white and black families continues to be
significant, with whites possessing about 13 times the wealth of blacks (Kochhar & Fry, 2014).
This gap is larger than it was when Martin Luther King, Jr. delivered his “I Have a Dream”
speech, over a half-century ago, in 1963; when Lyndon Johnson signed the last of the major civil
rights legislation, the Fair Housing Act, in 1968 (Rothstein, 2017); and when Richard Nixon, in
the 1970s, launched his black capitalism initiative (at least in name) and declared that the
“American private enterprise” via black entrepreneurship would “[open] the full range of
business opportunity to all by removing the inherited and institutional barriers to entry”
(Baradaran, 2017).
President Lyndon Johnson’s work with King, and other leaders of the Civil Rights
Movement to advance the rights of black citizens, followed by President Richard Nixon’s black
capitalism initiative, laid the foundation for some black entrepreneurial progress. However, it
was a paradoxical progress. Social and economic integration turned out to be largely one way,
with capital flowing out of black communities and businesses into white establishments that had
10
substance, creating vague political promises, with no mandates and no appropriations
(Baradaran, 2017). However, one of the unintended consequences of Nixon’s efforts might have
been to create the beginnings of a broader entrepreneurial confidence in the black business
community that they could do business with the white community – or more accurately, that the
white community would do business with blacks. However, Mehrsa Baradaran (2017) in The
Color of Money argues convincingly that such two-way economic integration ultimately never
occurred, leaving contemporary black America in financial straits.
Historical and contemporary social and economic policy has severely impacted the racial
wealth gap. Centuries of federal, state, and local laws allowed whites to accumulate wealth,
while blacks were barred from doing so (Rothstein, 2017). The utilization of housing as the
primary, and sometimes exclusive, means of black wealth showed its limit during the Great
Recession as the housing crisis hit, wiping out much of the wealth that many African-Americans
owned compared to their counterparts who had additional ownership in other assets, such as
stocks and small businesses (Kaufman, 2014, 2017). More recently, the December 2017
American tax overhaul is likely to further the wealth gap between whites and blacks, as the
benefits accrue to large corporations and higher worth individuals and families.
Durham might be a microcosm of the outright failure (at worst), or severe limitations (at
best), of targeted minority economic development policy and practice implemented since the
Civil Rights Era to overcome larger historical institutional forces working against some
non-white entrepreneurs. In Durham, though 18.3 percent of the overall population is in poverty,
nearly half of those in poverty are black (46.5 percent), and over 80 percent are people of color
(ACS, 2015). Among Durham’s children, age 0-8, of those classified as low-income, 57 percent
11
African-American population seems to suffer from the same overrepresentation-among-the-poor
as those in Durham. Furthermore, national economic mobility research suggests that in
contemporary times, it is exceedingly difficult for an individual to rise above their economic
birth status (Mitnik & Grusky, 2015). This would suggest that the growth in minority
entrepreneurship, specifically black entrepreneurship, is not translating into individual and
community wealth. This combination of factors is troubling. Even as America is on pace to
become a majority-minority population by 2044 (CPC, 2014), newly published research predicts
that if current trends persist, median black family wealth will reach zero by the year 2053, and
Latino wealth is expected to follow by the year 2073 (Collins et. al., 2017). This means that half
of all US blacks and Latinos will have wealth below zero. If most Americans are actively
becoming poorer, this is a national competitiveness issue. In short, as minorities are increasing
their share of the overall population, and increasing their share of the ownership class
(seemingly) at an even faster rate, they are becoming poorer. The question is “why?”
The aim of this dissertation is to extend the Hayti Center conversation in hopes of gaining
a better understanding of the past, present, and future state of the African-American economic
condition, specifically through the lens of black entrepreneurship. The notion that
entrepreneurship is the engine that stimulates economic growth, economic development,
employment and competitiveness in global markets is supported by various research evidence
(Raposo et. al., 2011). Thus, any discussion of black economic development, growth, and
competitiveness in present or future times must include an analysis of black entrepreneurship.
To understand the truth behind the data, this dissertation will use black American entrepreneurs
as the primary reference group, and Durham, North Carolina as the primary reference
12
community across the United States. The fact that it was happening in Durham, once the leading
black entrepreneurial community in America, was telling. Thus, the questions loom large: After
155 years of physical freedom and black Emancipation, is the black community – individually
and collectively – a free people, relative to whites and some of its other societal counterparts?
Can a poor race of people be considered free in a land of wealth? Some would say, “no.”
The following pages of this dissertation will seek to answer these questions, and several
others, in hopes of gaining insights into the present-day African-American condition; as well as,
the community’s relationship to entrepreneurship as a viable means for social and economic
advancement.
The Three Papers
This dissertation is organized as a collection of three papers that are linked across some
common themes. First, each paper applies a community economic ecosystem lens – with
business and entrepreneurial activities at the center of each analysis. Next, each paper also
shares the theme of race as the central contextual variable, with a particular focus on the
African-American business and entrepreneurial community’s relative performance compared to other
racial groups. Race is one of the variables around which community economic ecosystems
compete against one another. Finally, each paper focuses on Durham, North Carolina – the
leading black entrepreneurial, business, and community hub for a century after the American
Civil War. The scope of the three papers of this dissertation progressively narrows, like an
inverted pyramid, going from a broad national focus in Paper 1 to a two case comparison in
13
In Paper 1 – Do Ecosystems See Color?, McKoy and Johnson (2018) report on the trends
identified from shifts in the American Community Survey (ACS) and Survey of Business Owner
(SBO) data between 2007 and 2012 for the five major American racial/ethnic groups: whites,
blacks, American Indians, Asians, and Hispanics. Data from these two surveys allow for the
creation of a cross-sectional snapshot of changes in small business activity for a range of
race/ethnic groups during and in the immediate aftermath of the Great Recession, the second
worst economic downturn in history (Johnson, 2013). Paper 1 compares the population and
ownership shares of the five main racial groups to measure absolute and relative growth or
decline within each assessed category over the study period.
The goal of Paper 1 is to answer the following research questions: (1) Have the recent
efforts to create more inclusive entrepreneurial ecosystems in America resulted in more equitable
business outcomes for traditionally under-represented minority groups? That is, have minority
entrepreneurs achieved parity with their shares of the national population in terms of business
formation, growth and expansion? Additional questions answered by extension include: (2)
Does a higher firm growth rate automatically equate to business parity and equity for one group
relative to another? (3) Even if the data reflect a positive trend, how positive is it for any
particular group? Finally, (4) if all entrepreneurs and businesses operate under the same business
ecosystem, what accounts for the difference in growth rate? A new quantitative measurement,
the Race/Ethnic Equity/Disparity Quotient was developed to answer these questions, using
whites as the reference group. To answer these questions, Paper 1 draws upon two U.S. Census
Bureau databases: The American Community Survey (ACS) and the Survey of Business Owners
14
The findings of Paper 1 suggest that despite recent efforts to create inclusive
entrepreneurial and business ecosystems, minority business owners made little progress towards
achieving equity or parity with white business owners – and African-American entrepreneurs
actually lost ground.
The second paper is entitled Measuring the Equity of Diverse Community Economic
Ecosystems: A Comparative Analysis of Two of America’s Leading Black Entrepreneurial Hubs,
Atlanta and Durham. Paper 2 builds on Paper 1 to understand economic parity at the community
economic ecosystem level. The primary goal of Paper 2 is to introduce a new tool for measuring
and quantifying community economic ecosystem equity: the Hygioeconomic [Equity/Parity]
Index (HEPI). The paper tests the HEPI through a comparative analysis of two hubs of black
entrepreneurship: Durham and Atlanta. Durham was the leading entrepreneurial hub from the
end of the Civil War until the end of the Civil Rights era; and Atlanta has been the leading
entrepreneurial hub since.
In addition to testing HEPI, Paper 2 also extends the work of McKoy and Johnson (2018)
from Paper 1 in several ways. First, whereas Paper 1 focused exclusively on the relationship
between racial groups and firms with or without paid employees, Paper 2 adds two additional
economic components to the earlier quantitative assessment – firm revenues and levels of
community poverty. Second, Paper 2 extends Paper 1’s questions related to the impact of
ongoing efforts by public and private entities around entrepreneurial equity by asking: (1) How
will actors know an equitable/inequitable community economic ecosystem when they see it?
That is, how can economic inequity/equity be quantified beyond anecdotal and qualitative
evidence? (2) How will one know when parity has been achieved; and (3) assess how far a
15
and entrepreneurial ecosystems are faring better or worse relative to others, across geographies
and racial groups, among other factors? And specifically, (5) Do blacks, and Hispanics, have
less economically equitable – and weaker – community economic ecosystems relative to other
racial groups in the United States? (6) Do Durham and Atlanta both have more equitable
community economic ecosystems for blacks, on average, than the United States as a whole?
And finally, (7) does Atlanta have a more equitable community economic ecosystem for blacks
than Durham? Paper 2 draws upon ACS and SBO data and uses the HEPI towards answering
these questions concurrently.
In the third paper, The Rise and Fall of Hayti: A Reinterpretation of Black Durham’s
Community Economic Ecosystem, 1865-1958, I focus specifically on Durham, North Carolina’s
black Hayti community. Paper 3 traces the origins and trajectory of Hayti, as a segregated black
community comprised of former slaves and black freedmen/women, to examine the evolution of
its social structures and institutional development, under the racial hostilities of the day.
Building on the previous work of the Theory of Middleman Minorities (Bonacich, 1973; Turner
& Bonacich, 1980) and the Theory of the Afro-American Middleman (Butler, 1991; 2005), Paper
3 reinterprets the unique path of community economic ecosystem upbuilding, and institutional
anchoring, that Hayti had to follow as a result of being forced on an economic detour (i.e.,
segregation). I employ a longitudinal, historical analysis approach as my methodological
strategy to reveal this process.
The primary goal of Paper 3 is to reinterpret Hayti through the community ecology lens,
specifically through the Five C’s process-oriented framework that I develop. Paper 3 examines
the rise and fall, and potential rise again, of Hayti utilizing the Five C’s ecosystem lens. The
16
feedback loops are incorporated and embedded into the process of community upbuilding and
inclusion. If entrepreneurship is viewed just as individuals who succeed, and not at what that
success does for the community, it misses out on an important dynamic of growth and economic
development that builds wealth but also builds community. Hayti was more than a collection of
successful individuals and organizations. Each entity in the Hayti ecosystem affected and was
affected by the others, creating a constantly evolving relationship in which each entity must be
flexible and adaptable to survive, while dealing with the racial context of being black in
post-Civil War America. Paper 3 seeks to fill two gaps evident in the Hayti literature. Those two
gaps are: reinterpreting the what of Hayti, and the how it came to be.
Paper 3 also aims to answer a series of foundational research questions related to the
sociology of entrepreneurship: (1) Does entrepreneurship provide a viable means for advancing
mutually beneficial economic outcomes for black Americans? (2) Has it ever? Also, (3) does
entrepreneurship provide a means of strengthening black communities in the United States via
economic development? (4) Again, has it ever? Another set of questions guiding Paper 3’s
inquiry includes those from Bonacich (1973), Turner (1980), and Butler (1991; 2005): (5) How
do ethnic groups succeed in America in the face of systematic discrimination and prejudice?
And, (6) how is a degree of economic security carved out of a society which is hostile to the
group?
In Paper 3, the lessons from Hayti’s rise and fall have the potential to provide the
contemporary framework needed to build the relationships and institutions that can produce a
more expansive entrepreneurship in the twenty-first century. By gaining a better understanding
of what made this nineteenth and twentieth century black enclave thrive, broader knowledge can
17
Minority entrepreneurs and businesses continue to face discrimination that constrains
their ability to succeed in a hyper-competitive global marketplace (Johnson, Burthey, & Ghorm,
2008; McKoy & Johnson, 2018). More specifically, America’s various business ecosystems
seem to have moved from de jure segregation to de facto segregation, as opposed to full
integration. In order to move forward today, we need a more institutionalized reading of
entrepreneurship, that cuts across narrow enclaves and melds the growth of the
African-American community with the growth of the wider economy. These three papers, each in their
own way, helps to explore the role of black entrepreneurship in anchoring wider growth in the
18
REFERENCES
Alexander, M. (2010). The New Jim Crow: Mass Incarcerations in the Age of Colorblindness. New York, NY: The New Press.
Arora, R. (2016, April 15). The American dream is still alive: Survey. Retrieved from http://www.cnbc.com.
Austin, A., and Center for Global Policy Solutions. (April 2016). The Color of
Entrepreneurship: Why the Racial Gap among Firms Costs the U.S. Billions. Washington, DC. Baradaran, M. (2017). The Color of Money: Black Banks and the Racial Wealth Gap.
Cambridge, MA: Harvard University Press.
Beckert, S. and Rockman, S. (editors). (2016). Slavery’s Capitalism: A New History of American Economic Development. Philadelphia, PA: University of Pennsylvania Press.
Boston, T. D. and Boston, L. (2007). Secrets of Gazelles: The Differences Between High Growth and Low Growth Businesses Owned by African Americans. The Annals of the American
Academy of Political and Social Science, Volume 613, September.
Brown, L. (2008). Upbuilding Black Durham: Gender, Class, and Black Community
Development in the Jim Crow South. Chapel Hill, NC: The University of North Carolina Press. Butler, J.S. (1991; 2005). Entrepreneurship and Self-Help among Black Americans: A
Reconsideration of Race and Economics, Revised Edition. New York, NY: SUNY Press. Carolina Population Center (CPC). NC in Focus: Minority Population Share, 2014. www.demography.cpc.unc.edu. Retrieved on September 15, 2017.
Collins, C., Asante-Muhammed, D., Nieves, E., and Hoxie, J. (2017, September 11). “The Road to Zero Wealth: How the Racial Wealth Divide is Hollowing Out America’s Middle Class.” A report from the Institute for Policy Studies. Washington, DC. Available at https://www.ips-dc.org/report-the-road-to-zero-wealth/.
Downtown Durham, Inc. (DDI). For Investors: Introduction. Available at
https://www.downtowndurham.com/for-investors/. Retrieved on January 6, 2018. Durham Committee on the Affairs of Black People (DCABP). History. Available at https://www.dcabp.org/dcabp. Retrieved on January 6, 2018.
Durham County Government (DCG). 2015 State of the County Health Report. Available at http://healthydurham.org/health-data. Retrieved on January 6, 2018.
Graves-Manns, T and Klein, A. (2015, December 17). “How a start-up hub made good on diversity goals.” USA Today. Available at
https://www.usatoday.com/story/tech/columnist/2015/12/17/american-underground-durham-north-carolina-entrepreneurs-diversity-talib-graves-manns-adam-klein/77439972/.
19
Johnson, Jr., J. H., Burthey, III, G., and Ghorm, K. (2008). “Economic Globalization and the Future of Black America.” Journal of Black Studies, Vol. 38, No. 6. Available at
http://journals.sagepub.com/doi/abs/10.1177/0021934706290981?journalCode=jbsa. Johnson, Jr., J. H., (2015, October 10). “A Shifting Entrepreneurial Landscape in North Carolina.” News and Observer. Available at http://www.newsobserver.com/opinion/op-ed/article38451810.html.
Juneteenth. History. Available at https://www.juneteenth.com/history.htm. Retrieved on January 6, 2018.
Kaufman, A.C. (2017, December 6). “Black-White Wealth Gap Has Reached 24-Year High.” Huffington Post. Available at https://www.huffingtonpost.com/2014/12/12/racial-wealth-gap_n_6317202.html.
Kochhar, R. and Fry, R. (2014, December 12). “Wealth inequality has widened along racial, ethnic lines since end of Great Recession.” Pew Research Center. Available at
http://www.pewresearch.org/fact-tank/2014/12/12/racial-wealth-gaps-great-recession/. Mason, C. and Brown, R. (2014). “Entrepreneurial ecosystems and growth oriented entrepreneurship.” Final Report to OECD, Paris 30 (1), pp. 77-102.
McKoy, Jr., H. C. and Johnson, Jr., J. H. (2018). “Do Business Ecosystems See Color?” International Journal of Social Ecology and Sustainable Development, Volume 9, No. 3, July-September 2018, pp 80-91.
Mitnik, P.A. and Grusky, D.B. (July 2015). Economic Mobility in the United States. A report from the Pew Charitable Trusts and the Russell Sage Foundation. Available at
https://web.stanford.edu/~pmitnik/EconomicMobilityintheUnitedStates.pdf.
Moore, J.F. (1993). Predators and prey: A new ecology of competition. Harvard Business Review, 71(3), 75-86.
Moretti, E. (2012). The New Geography of Jobs. New York, NY: Houghton Mifflin Harcourt. National Venture Capital Association (NVCA). (2016). “Building A More Inclusive
Entrepreneurial Ecosystem.” Available at https://nvca.org/wp-content/uploads/delightful-downloads/2016/07/NVCA-2016-Diversity-Report.pdf.
Piore, M. and Sabel, C. (1984). The Second Industrial Divide: Prospects for Prosperity. New York, NY: Basic Books.
Porter, M.E. (1990). “New Global Strategies for Competitive Advantage.” Planning Review, 18 (3), pp. 4-14.
Raposa, M., Smallbone, D., Balaton, K., and Hortovanyi, L. (editors). (2011). Entrepreneurship, Growth and Economic Development: Frontiers in European Entrepreneurship Research. Cheltenham, UK: Edward Elgar Publishing, Inc.
Rothstein, R. (2017). The Color of Law: A Forgotten History of How Our Government Segregated America. New York, NY: Liveright Publishing.
20
U.S. Census Bureau. (2012, 2007). American Community Survey. Washington, DC. Retrieved from www.census.gov.
U.S. Census Bureau. (2012, 2007). Survey of Business Owners 2007-2012. Washington, DC: U.S. Department of Commerce.
U.S. Senate. Landmark Legislation: Civil Rights Act of 1875. www.senate.gov. https://www.senate.gov/art/art_hist_home.htm. Retrieved on October 1, 2017.
White, G.B. (2016, March 31). “The Downside of Durham’s Rebirth.” The Atlantic. Available at
21 PAPER 1:
Do Business Ecosystems See Color?2
INTRODUCTION
The popular press is replete with stories that highlight the personal characteristics of
successful entrepreneurs. By contrast, scholarly research, while acknowledging the role of
personal traits, has devoted considerable attention to the role social stratification plays in
facilitating or constraining entrepreneurial success (see, for examples, Bates, Jackson, &
Johnson, 2007). Social stratification results from institutional processes that partition society
into advantaged and disadvantaged groups (Davis & Moore, 1945; Hatt, 1950; Tumin, 1953;
Buckley, 1958; Spilerman, 2000). The accumulation of power and resources by the advantaged
group over time reinforces these processes.
Research reveals that social stratification and entrepreneurship interact in at least three
ways (Robinson et al., 2007). First, entrepreneurship can be a means of social mobility for
individuals and families. Second, entrepreneurship can address the challenges of a fractured
society and offer opportunities for innovative approaches to solve problems. Third, the status of
22
an individual or group within a socially stratified society has significant influence on the
entrepreneurial process undertaken by the individual or group.
Historically, advantaged and disadvantaged groups alike have developed group-focused
entrepreneurial ecosystems, with an eye toward either maintaining competitive advantage or
combatting or circumnavigating institutional barriers to entrepreneurial success. During periods
of both de jure and de facto racial segregation, these ecosystems were made up of trusted,
mutually reinforcing, multi-sectoral, group-specific relationships, which were designed to
facilitate, support, and advance entrepreneurship as an economic development strategy. More
recently, as immigration has driven population growth and increased diversity in America
(Johnson, 2010), concerted efforts have been undertaken to develop more inclusive
entrepreneurial ecosystems rooted in the principles of social justice and equity (National Venture
Capital Association, 2016).
The goal of this paper is to answer the following research question: Have these more
inclusive entrepreneurial ecosystems created equitable business outcomes for traditionally
under-represented minority groups? That is, have minority entrepreneurs achieved parity with their
shares of the national population in terms of business formation, growth and expansion? To
answer these questions, this research draws upon two U.S. Census Bureau databases: the
American Community Survey (ACS), which monitors demographic trends on an annual basis,
and the Survey of Business Owners (SBO), which surveys U.S. small business activity every five
years.
The most recent SBO was administered in 2012, which means the previous survey was
conducted in 2007. Data from these two surveys allow for the creation of a snapshot of changes
23
broad range of race/ethnic groups (Johnson, 2013). Dubbed the worst economic downturn since
the Great Depression, the Great Recession idled 8.4 million workers driving the unemployment
rate to 10% in 2009, up from 4% in 2007 (Johnson, 2015). However, a Kauffman Foundation
report on entrepreneurial activity during the Great Recession argued that, “Rather than making
history for its deep recession and record unemployment, 2009 might be remembered as the year
business ups reached their highest levels in 14 years—even exceeding the number of
start-ups during the peak 1999-2000 tech boom” (Kauffman News Release, 2010).
Other studies refute this research finding (see Shane, 2011), but the authors believe the
SBO is more reliable than the databases used in these earlier studies for assessing changes in
business activity during this tumultuous period. Moreover, the issue of equity (or the lack
thereof), which has become the soup du jour when describing desired outcomes for racial
minorities, is the primary focus in this study. To determine if minority entrepreneurs have
achieved demographic parity, and by extension if inclusive entrepreneurial ecosystems are
achieving desired business outcomes, ACS data on 2007-2012 population change by
race/ethnicity are juxtaposed with 2007-2012 SBO data on changes in business activity by
race/ethnicity.
CRITICAL BACKGROUND AND CONTEXT
A typical business ecosystem includes both well-established firms and new
entrepreneurial ventures (Zahra & Nambisan, 2012). These networks of interacting firms evolve
over a long process, defining relationships among industry players, with entrepreneurial insights
interacting with strategic thinking to create, shape, navigate, and exploit business ecosystems.
Research emphasizes the importance of context, suggesting that each entrepreneurial ecosystem
24
role of race as a contextual variable is critical to understanding how both entrepreneurial and
business ecosystems evolved in the past and the present.
Owing to patterns of racial segregation, in both housing and business, commercial
ecosystems distinguished by race and ethnicity have existed in America since at least the late
nineteenth century. Under the Civil Rights Act of 1875, racial discrimination in public
accommodations such as hotels, railroads, jury pools, and theaters was prohibited
(www.history.house.gov). Less than a decade later, in 1883, the U.S. Supreme Court ruled that
the Act was invalid because it addressed “social” as opposed to “civil” rights (www.senate.gov).
This ruling provided legal cover for individual discrimination, specifically white against black,
by noting that the Fourteenth Amendment protected people against violations of their civil rights
by states, but not against the actions of individuals and private businesses
(www.history.house.gov).
Thus, a business-owner could discriminate based on race. This ruling laid the
groundwork for state legislatures throughout the South to legalize racial segregation in all public
places, from schools to hospitals to restaurants (Wormser, 2002). These so-called Jim Crow
laws ended the notion of a New South in the years following Reconstruction. Furthermore, the
Plessy v. Ferguson decision, in 1896, upheld this doctrine and made famous the notion of
separate but equal (www.senate.gov). The segregated world was rarely, if ever, equal.
Segregated black communities emerged across the United States, separate and genuinely
unequal, from their white counterparts. However, several black communities of this era created
and sustained, for a time, robust entrepreneurial and business ecosystems. The U.S. Census
reported that black businesses increased from over 17,000 in 1890 to over 70,000 in 1926 (Hunt
25
were among the most notable communities where the black business ecosystem competed
effectively against the white ones. Black citizens never had to leave their community to
purchase goods and services—unless they elected to do so (Bell, 2002).
These black business ecosystems were usually in close proximity to white ecosystems.
In such situations, whites sometimes ventured into the black community for business services,
some black businesses had white employees, and blacks often worked for white businesses and
therefore brought their earnings back to the black business ecosystem (Brown, 2008). As
America became more ethnically diverse through immigration, other racialized communities
with their own business ecosystems emerged. Many urban communities have commercial
enclaves dominated by the ethnic enterprises of newly or recently arriving immigrant groups. To
combat what was initially overt, and later covert discrimination, these ethnic groups sometimes
strengthened their business ecosystems by creating financial, educational, cultural and political
institutions, among others (Hunt & Hunt, 1998; Bell, 2002; Brown, 2008).
In the six decades since the Supreme Court overturned the concept of separate but equal
in the landmark Brown v. Board of Education decision in 1954, the American landscape has
changed dramatically--socially, politically, economically, and culturally. Most would agree that
race relations have improved markedly since the days of Jim Crow and de jure segregation.
Some have even argued that the 2008 election and 2012 reelection of Barack Obama as President
of the United States signaled the emergence of a post-racial America (Holmes, 2015).
Several trends suggest, however, that America has not resolved its race problem and may
in fact have entered a phase of retrenchment (Holmes, 2015; Johnson & Parnell, 2016;
Meacham, 2017). Michelle Alexander (2011) has argued persuasively, for example, that mass
26
have argued that now President Donald Trump’s “Make America Great Again” presidential
election campaign slogan was a not so thinly veiled call to “Make America White Again,” a view
supported by the resurgence of white supremacy and other hate groups in America (Johnson &
Parnell, 2016; Meacham, 2017). And the fact that the emergence of a new professional class of
high growth black businesses—dubbed the “black gazelles”—are highly concentrated in cities
with black leadership and strong supplier diversity programs as opposed to the private sector
suggest that there are few concrete signs of a post racial business world (Boston & Boston,
2007). The demographic make-up of the “winning” competitors within America still looks much
the same (i.e., white), perhaps save one group (i.e., Asians).
Minority entrepreneurs and businesses continue to face discrimination that constrains
their ability to succeed in a hyper-competitive global marketplace (Johnson, Burthey, & Ghorm,
2008). In response to this state of affairs, major initiatives on diversity and inclusion in
entrepreneurship have been launched in recent years. They include Forward Cities1, a multi-city
collaborative in Cleveland (OH), Detroit (MI), Durham (NC), and New Orleans (LA), funded by
the Kellogg, Kresge, and Steve and Jean Case foundations, among others. In addition, corporate
giants like Google and influential professional affinity groups like the National Venture Capital
Association (NVCA) have each also joined in as collaborators.2 Even the White House, under
President Barack Obama, dedicated an entire day to diversity and inclusion at its 2015
entrepreneurship summit (Snider, 2015). The crucial question is: Have these efforts created a
27 EMPIRICAL STRATEGY & ANALYSIS
Researchers and economic policymakers at all levels of government typically use SBO
data to monitor and evaluate census-to-census general and group-specific small business trends.
The data are extremely helpful in understanding absolute and relative changes in business
formation and performance by selected demographic characteristics. The focus here is on
business ownership rates across five major race/ethnic groups: white, black, Asian, American
Indian, and Hispanic. The 2007 and 2012 SBOs are the latest available national data on business
ownership in the United States. Both firms without paid employees and firms with paid
employees are included in these datasets. It is well-documented that firms with paid employees
have significantly more sales, receipts, and revenues than those without paid employees.
However, firms without paid employees are important in this study because they are part of the
overall business ecosystem. This analysis therefore draws upon data on both types of firms to
illustrate the nature, rate, and magnitude of changes in the U.S. small business marketplace
between 2007 and 2012.
Beyond understanding recent trends in small business activity, this research also strives
to answer the following questions: Does a higher firm growth rate automatically equate to
business parity and equity for one group relative to another? Even if the data reflect a positive
trend, how positive is it for any particular group? If all entrepreneurs and businesses operate
under the same business ecosystem, what accounts for the difference in growth rates? To answer
these questions, SBO firm trend data were combined with ACS population trend data in a
three-step analysis process.
First, absolute and relative indices of 2007-2012 population change and small business
28
Next, using the absolute size of the population in each race/ethnic group as the base,
group-specific population ratios were calculated relative to the other race/ethnic groups.
Separate, group-specific ratios were then derived based on the 2007 and the 2012 data. This
process was repeated for the business level data.
Third, the ratios derived from the ACS data (numerator) were divided by the ratios
derived from the SBO data (denominator) to create a measure of equity or inclusiveness, that is,
a quantitative indicator of the degree or extent to which small business ownership in the various
race/ethnic groups was either under- or over-represented given their relative population
distributions. For the purpose of this research, this indicator hereinafter is referred to as the
equity/disparity quotient and the white population is the reference group in the analyses of the
presence or absence of minority parity.
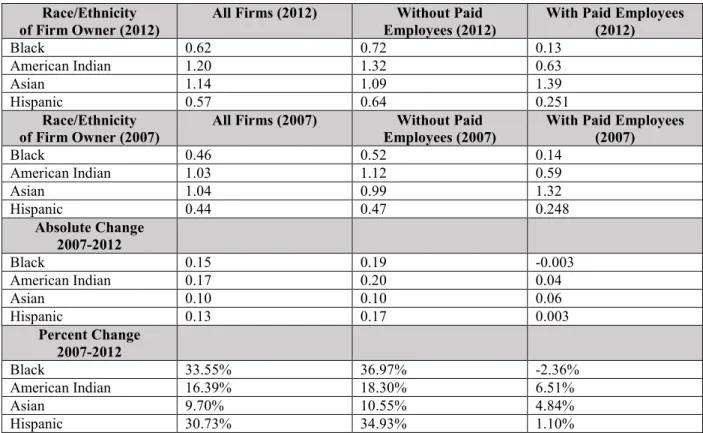
A quotient score of 1.00 signals total equity in firm distributions between whites and a
specified racial minority. That is, if a minority demographic group had a ratio equal to 1.00, then
their representation at the firm ownership level is proportional to their corresponding population
size compared to whites. A score either greater or less than 1.00 signals that racial business level
inequity exists. More specifically, a number above 1.00 means that the identified group was
over-represented against whites, while a number below 1.00 means that the identified group was
29 FINDINGS
Shifts in Population and Small Business Ownership
Tables 1 and 2 present data on absolute and relative population change and shifts in the
shares of total population by race/ethnicity between 2007 and 2012. Tables 3 and 4 provide
corresponding data for small businesses.
Table 1. Absolute and Relative U.S. Population Change, 2007-2012
Group 2012 Population Absolute Change
2007-2012
Percent Change 2007-2012
Total 313,914,040 12,292,881 4.1
Non-Hispanic 260,953,023 4,759,301 1.9
White 197,243,423 -1,310,014 -0.7
Black 38,464,192 1,806,912 4.9
American Indian 2,084.472 65,268 3.2
Asian 15,375,460 2,2298,268 17.6
Native Hawaiian/Pacific Islander 497,807 95,875 23.8
Some other Race 614,725 -100,550 -14.1
2 or more races 6,672,944 1,903,542 39.9
Hispanic 52,961,017 7,533,580 16.7
Source: American Community Survey, 2007 and 2012.
Table 2. Shifts in Shares of Total Population by Race/Ethnicity, 2007-2012
Group 2012 Share 2007 Share
All Races 313,914,040
(100%)
301,621,159 (100%)
White 62.8% 65.8%
Black 12.2% 12.1%
American Indian 0.7% 0.7%
Asian 4.9% 4.3%
Native Hawaiian/Pacific Islander 0.2% 0.1%
Some other Race 0.2% 0.2%
Two or More Races 2.1% 1.6%
Hispanic 16.9% 15.1%
30
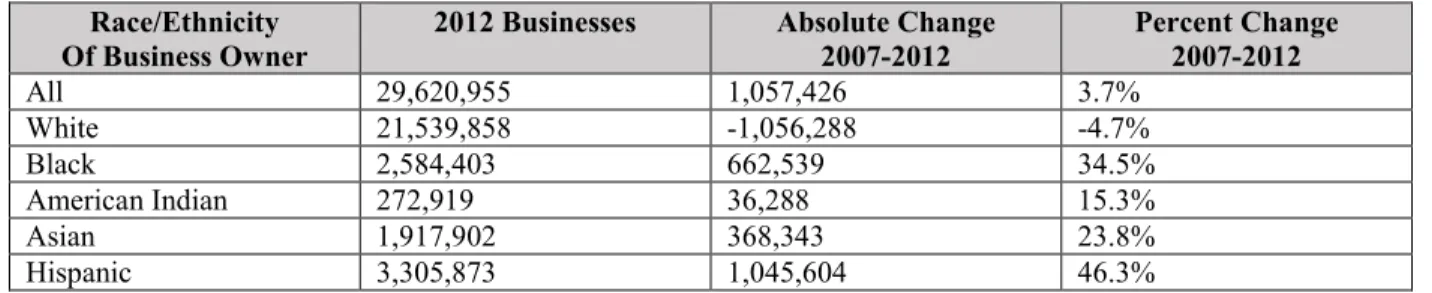
Table 3. Changes in U.S. Small Business Ownership by Race/Ethnicity, 2007-2012
Race/Ethnicity Of Business Owner
2012 Businesses Absolute Change 2007-2012
Percent Change 2007-2012
All 29,620,955 1,057,426 3.7%
White 21,539,858 -1,056,288 -4.7%
Black 2,584,403 662,539 34.5%
American Indian 272,919 36,288 15.3%
Asian 1,917,902 368,343 23.8%
Hispanic 3,305,873 1,045,604 46.3%
Source: Survey of Business Owners, 2007 and 2012.
Table 4. Shifts in Shares of Business Ownership of Firms With and Without Paid Employees, 2007-2012
Group 2012 2007
All Firms 29,620,955
(100%)
28,563,529 (100%)
White 72.7% 79.1%
Black 8.7% 6.7%
American Indian 0.9% 0.8%
Asian 6.5% 5.4%
Hispanic 11.2% 7.9%
Source: Survey of Business Owners, 2007 and 2012.
A clear pattern emerges across ethnic and racial groups in terms of both population and
business ownership. Due to rapid growth in both domains, minorities made up a greater share of
both population and small business ownership in 2012 than in 2007. White population and
business ownership, by contrast, declined resulting in declining shares of both during this period.
More specifically, as Table 1 shows, the U.S. white population declined by 1.3 million
between 2007 and 2012. This white population loss was offset by rapid increases in the black,
Asian, Hispanic, and other non-white populations, including those who self-identified as two or
more races. Due to these race/ethnic differences in absolute population change, the white share
31
white share was offset by increases in the Hispanic, Asian, and two or more races shares of the
total population (Table 2).3 It is abundantly clear from these data that demographic diversity is
increasing in America.
The business ownership trends seem just as definitive (Table 3). Between 2007 and
2012, every racial group of color saw significant increases in its share of business ownership,
while whites saw a nearly 5 percent decline (Table 4). Hispanics saw the greatest rise in firm
ownership (46.3 percent), while blacks (34.5 percent), Asians (23.8 percent), and American
Indians (15.1 percent) also experienced impressive growth. Each entrepreneurial group of color
grew faster than its corresponding population. Those who value racial diversity in society, and
business, should find much to cheer about in these numbers. But, in terms of equity, what do
these numbers mean?
PARITY ANALYSIS
The equity/disparity quotient is used to assess minority group representation in
relationship to white representation for all small businesses, for small business without paid
employees, and for small businesses with paid employees. Quotients for 2007 and 2012 are
examined separately, absolute differences in quotients for these two survey years are analyzed,


![Table 5. Indexed Equity Quotient (IEQrace) for U.S., Atlanta, and Durham Areas by Race/Ethnicity, 2007, 2012 [-1,1] Race/Ethnicity of Business Owner National 2012 Atlanta, Georgia (MSA) 2012 Durham, North Carolina (MSA) 2012 White 0.23 0.29 0.4](https://thumb-us.123doks.com/thumbv2/123dok_us/8323011.2206436/90.918.110.809.649.986/quotient-ieqrace-atlanta-ethnicity-ethnicity-business-national-carolina.webp)
![Table 6. Normalized Equity Score (NESrace) for U.S., Atlanta, and Durham Areas by Race/Ethnicity, 2007, 2012 [-400,400], 0=equity Race/Ethnicity of Business Owner National Score 2012 Atlanta, Georgia (MSA) Score 2012 Durham, North Carolina (MSA) Sc](https://thumb-us.123doks.com/thumbv2/123dok_us/8323011.2206436/92.918.111.810.160.481/normalized-nesrace-atlanta-ethnicity-ethnicity-business-national-carolina.webp)
![Table 7. Economic Ecosystem Equity Gap Score for U.S., Atlanta, and Durham Areas by Race/Ethnicity, 2007, 2012 [0,800], 0=equity](https://thumb-us.123doks.com/thumbv2/123dok_us/8323011.2206436/93.918.110.807.755.1077/table-economic-ecosystem-equity-score-atlanta-durham-ethnicity.webp)
![Figure 2. Hygioeconomic Ecosystem Equity Gap for U.S., Atlanta, and Durham Areas by Race/Ethnicity, 2007, 2012 [0,800], 0=equity](https://thumb-us.123doks.com/thumbv2/123dok_us/8323011.2206436/95.918.106.732.157.574/figure-hygioeconomic-ecosystem-equity-atlanta-durham-areas-ethnicity.webp)
