Helma B. M. Van Gameren-Oosterom1,2*, Paula Van Dommelen2, Anne Marie Oudesluys-Murphy3, Simone E. Buitendijk4, Stef Van Buuren2,5, Jacobus P. Van Wouwe1
1Department of Child Health, Netherlands Organization for Applied Scientific Research (TNO), Leiden, The Netherlands,2Department of Life Style, Netherlands Organization for Applied Scientific Research (TNO), Leiden, The Netherlands,3Department of Pediatrics, Leiden University Medical Centre, Leiden, The Netherlands, 4Leiden University Medical Centre, Leiden, The Netherlands,5Department of Methodology and Statistics, FSS, University of Utrecht, Utrecht, The Netherlands
Abstract
Objective:To provide cross-sectional height and head circumference (HC) references for healthy Dutch children with Down syndrome (DS), while considering the influence of concomitant disorders on their growth, and to compare growth between children with DS and children from the general population.
Study design:Longitudinal growth and medical data were retrospectively collected from medical records in 25 of the 30 regional hospital-based outpatient clinics for children with DS in the Netherlands. Children with Trisomy 21 karyotype of Dutch descent born after 1982 were included. The LMS method was applied to fit growth references.
Results:We enrolled 1,596 children, and collected 10,558 measurements for height and 1,778 for HC. Children with DS without concomitant disorders (otherwise healthy children) and those suffering only from mild congenital heart defects showed similar growth patterns. The established growth charts, based on all measurements of these two groups, demonstrate the three age periods when height differences between children with and without DS increase: during pregnancy, during the first three years of life, and during puberty. This growth pattern results in a mean final height of 163.4 cm in boys and 151.8 cm in girls (22.9 standard deviation (SD) and23.0 SD on general Dutch charts, respectively). Mean HC (0 to 15 months) was 2 SD less than in the general Dutch population. The charts are available at www.tno.nl/ growth.
Conclusions: Height and HC references showed that growth retardation in otherwise healthy children with DS meanly occurs in three critical periods of growth, resulting in shorter final stature and smaller HC than the general Dutch population shows. With these references, health care professionals can optimize their preventive care: monitoring growth of individual children with DS optimal, so that growth retarding comorbidities can be identified early, and focusing on the critical age periods to establish ways to optimize growth.
Citation:Van Gameren-Oosterom HBM, Van Dommelen P, Oudesluys-Murphy AM, Buitendijk SE, Van Buuren S, et al. (2012) Healthy Growth in Children with Down Syndrome. PLoS ONE 7(2): e31079. doi:10.1371/journal.pone.0031079
Editor:Stephen D. Ginsberg, Nathan Kline Institute and New York University School of Medicine, United States of America
ReceivedSeptember 15, 2011;AcceptedJanuary 1, 2012;PublishedFebruary 17, 2012
Copyright:ß2012 Van Gameren-Oosterom et al. This is an open-access article distributed under the terms of the Creative Commons Attribution License, which permits unrestricted use, distribution, and reproduction in any medium, provided the original author and source are credited.
Funding:The study is financially supported by grant 150020031 from the Netherlands Organization for Health Research and Development (ZonMw) and by the Tamarinde foundation (Stichting Tamarinde). An additional funding is received for open access publication from the Netherlands Organisation for Scientific
.
Competing Interests:The authors have declared that no competing interests exist.
* E-mail: helma.vangameren@tno.nl
Introduction
Appropriate, up-to-date growth charts are necessary for evaluation of physical growth and provision of optimal health care. The World Health Organization has produced a global standard chart describing how children, under optimal conditions, grow worldwide. [1] This is based on the idea that all humans are more or less equal. Health care workers, on the other hand, often wish to use growth charts of a well defined reference group closely related to the subpopulation they serve, since these charts provide a more accurate evaluation for an individual child. [2] Growth charts are available for various ethnic groups at specific moments in time. [3,4] Specific growth references have also been developed for children with various disorders known to interfere with growth, such as Turner and Down syndrome (DS). [5–9] Since growth assessment depends on the growth pattern characteristic for these conditions, disorder specific charts are desirable. Growth
refer-ences for American children with DS have been constructed making it possible to accurately identify concomitant disorders known to influence growth. [6] Growth charts for Dutch children with DS were first published in 1996: they are shorter than children in the general Dutch population, but taller than their US peers with DS. [8]
In order to take the secular trend into account, growth references for height and head circumference (HC) need to be updated regularly. [3] Children with DS are at high risk of many disorders known to influence growth. Such disorders are generally regarded as exclusion criteria in growth studies: all children diagnosed with growth disorders or on medication known to interfere with growth are usually excluded. [3] However, in studies on growth in children with DS such exclusion criteria are usually not applied. [5–8,10] Only two recent growth studies in children with DS (in Japan and in the UK and Ireland) excluded children with various diagnoses known to affect growth. [11,12] In funders had no role in study design, data collection and analysis, decision to publish, or prepar tion of the maunscript
addition, no previous studies have investigated in which particular age periods height growth in otherwise healthy children with DS is relatively most delayed, by comparing their growth with that of healthy controls from the general population.
Therefore, the aim of the present study is to provide updated height and new HC growth references by a large nationwide sample, reflecting healthy growth in Dutch children with DS, and to compare their growth pattern with data from a recent nationwide study among children from the general Dutch population with focus on periods during which relative height differences increases. We think it is essential to establish new growth references for children with DS in the Netherlands, whereby a strict selection on their health status will be applied. Only with such references health care professionals can monitor growth of individual children with DS optimally, and can identify growth retarding comorbidities at an early stage.
Methods
Data source
To collect representative nationwide data, all specialized regional pediatric outpatient clinics for children with DS in the Netherlands were approached (n = 30). These hospital-based clinics provide standard medical care for children with DS, according to the guideline of the Pediatric Association of the Netherlands. [13] All children with DS, who live in the service area of these clinics, are eligible to participate in this standard care by specialized pediatricians that includes screening for congenital cardiac defects, thyroid dysfunction, celiac disease, hearing and visual disorders as well as motor development and growth monitoring. Youth health care physicians working in special education and looking after older children with DS were also approached. Names of all participating clinics, pediatricians and youth health care physicians are mentioned in the acknowledge-ment.
At the clinics all data were retrospectively collected from medical records, between July 2009 and February 2010, by the first author, who is a trained physician. The de-identification was also completed by the first author, using study numbers. Additional data from the youth health care physicians caring for older children with DS in special education were collected by
completing standard forms. All measurements were carried out according to protocol. [14] Height was measured using a recumbent length device or a stadiometer and HC by using a measuring tape (fiberglass or other non-expanding material). Data concerning medical conditions and treatment of each subject, and specifically those conditions known to interfere with growth, were gathered from medical records, as well as specific background information. Children were considered to be of Dutch descent if both parents were born in the Netherlands, as reported in the medical records. If medical or background information was not available, subjects were excluded.
Inclusion/exclusion
Children with Trisomy 21 karyotype were selected, and those with DS caused by mozaı¨cisme or translocation were excluded (verified by karyotype). All children born after 1982 were included (aged up to 26 years). We collected semi-longitudinal data on growth over the previous 10 years, recording data from 2000 onwards. We selected only the first recorded observation per interval: from an infant (age of 0 to 1 year old) one observation in each month, from a toddler (age 1 to 3 years old) one observation in each three months period, and one observation in each six months in childhood and adolescence (age up to 26 years old). Measurements of HC were selected only from full-term children (born$37 weeks gestation) up to the age of 5 year. If gestational age was not specifically mentioned, children were considered to be born at term.
Health status
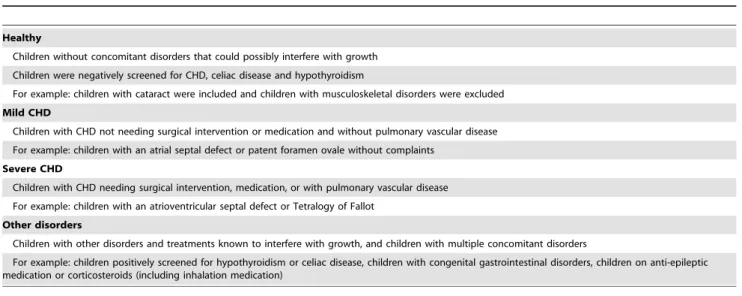
The children were categorized according to their health status in 4 groups: healthy, with only mild CHD, with only severe CHD or with other (multiple) concomitant disorders. Table 1 describes the characteristics of the various health categories and details of the criteria used for these categories.
Permission of an Ethical Committee or informed consent is not obtained, as not required in the Netherlands for this type of study or data collection, since the data were analyzed anonymously.
Statistical Analysis
Data cleansing was performed by excluding duplicate cases and outliers. Duplicate cases have arisen when children were seen at
Table 1.Characteristics of the various health categories in the study population of children with Down syndrome.
Healthy
Children without concomitant disorders that could possibly interfere with growth
Children were negatively screened for CHD, celiac disease and hypothyroidism
For example: children with cataract were included and children with musculoskeletal disorders were excluded
Mild CHD
Children with CHD not needing surgical intervention or medication and without pulmonary vascular disease
For example: children with an atrial septal defect or patent foramen ovale without complaints
Severe CHD
Children with CHD needing surgical intervention, medication, or with pulmonary vascular disease
For example: children with an atrioventricular septal defect or Tetralogy of Fallot
Other disorders
Children with other disorders and treatments known to interfere with growth, and children with multiple concomitant disorders
For example: children positively screened for hypothyroidism or celiac disease, children with congenital gastrointestinal disorders, children on anti-epileptic medication or corticosteroids (including inhalation medication)
multiple centers and were identified by comparing sex, date of birth and background information such as nationality, and medical condition. Outliers were defined using height and HC standardized by age and sex according to the reference charts of the general Dutch population, calculated in standard deviation scores (SDS). [3] Cutoff values.2 or,26 for height SDS and HC SDS were used. If a child had one measurement outside the cutoff values, all measurements of this child were excluded. Moreover, the longitudinal growth pattern of each subject was checked by plotting them and excluding values outlying the plot. Data were analyzed separately for boys and girls.
The difference in mean height SDS and HC SDS between healthy children with DS and children with DS and a mild or severe CHD were tested by linear mixed-effects models. To correct for possible differences in the prevalence rates of sex and mean age, we adjusted these analyses by age and sex. Furthermore, growth references for boys and girls with DS were fitted for body height by age (range 0 to 21 years) and HC by age (range 0 to 15 months) using the LMS method. Growth references were fitted in R Version 2.9.0 using Generalized Additive Models for Location Scale and Shape (GAMLSS). [15] The LMS method summarizes the distribution by three age-dependent smooth curves representing skewness (L curve), median (M curve) and coefficient of variation (S curve). [16] The LMS method is based on the principle that after a transformation the data have to follow a standard normal distribution. The following transformations of age were tested to expand the ages where growth velocity is high and compress age where growth velocity is low: the age transformation proposed by Cole, a square root transformation, a log transformation and a cube root transformation. [17] Worm plots were used as a diagnostic tool to visualize the fit to the data. [18] These plots check the residuals for different age levels and indentify locations at which the fit can be improved. We fitted charts with lines of the22.5,22.0,21.0, 0, 1.0, 2.0 and 2.5 SD (corresponding with 0.6, 2.3, 15.9, 50, 84.1, 97.7 and 99.4 percentile). The choice of these SD-lines is in agreement with the latest reference charts for the general Dutch population. We did not fit growth charts for the health category ‘other disorders’, because of the wide variety of data and medical conditions of the children in this category. Also, growth charts for subgroups in this category – like children with hypothyroidism or celiac disease – were not fitted, because of the small number of children included in our study.
In addition to the reference charts for height, formulas for Target Height (TH) for children with DS were calculated. [19] The TH was calculated by the method of Hermanussen and Cole, which takes into account two correlations (assortative mating r(P,P) and the parent-offspring correlation r(P,O)). [20] For this calculation, the data from three nationwide sources have been applied. The correlations were obtained from the latest growth study in the general Dutch population (2009) and were r(P,P) = 0.19 and r(P,O) = 0.58. [21] The calculation for the paternal and maternal height SD was based on the results from the previous national growth study (1997); final height of children measured in this study corresponds with final height of this generation of parents. [3] For the calculation of the TH SDS the mean and SD of final height of the children with DS observed in this study were used.
The established growth references for height and HC were compared with the most recent reference charts for the general Dutch population, by calculating SDS. [21]
Results
Pediatricians working in 25 hospital-based clinics (83% of all Dutch DS clinics) and 14 youth health care physicians caring for
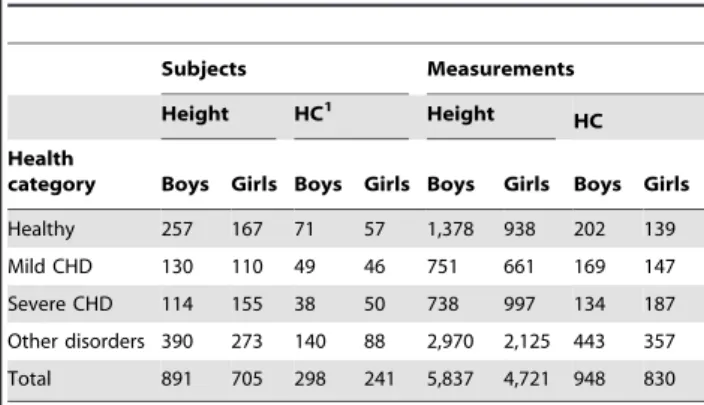
older children with DS in special education agreed to participate in this study. After exclusion of 7 children with a growth pattern outside the cut-off values, a total of 1,843 children with Trisomy 21 were indentified. Of these, 1,596 are of Dutch origin: 891 boys (55.8%) and 705 girls (44.2%). The sample provided 10,558 measurements for height and 1,778 for HC in the age range 0 to 5 years and born at term (418 HC measurements from children born pre-term in this age range were excluded). Of all height measurements, 98% were derived from the DS clinics and 2% from the youth health care physicians in special education. The HC measurements were only derived from the DS clinics. Table 2 provides total number of subjects and measurements of height and HC, split according to sex and to various health categories. In our sample, 26.6% was categorized as healthy, 15.0% had only a mild CHD and 16.9% only a severe CHD. The remaining group, 41.5%, was categorized as having various other disorders; most of them (over 60%) had multiple concomitant disorders.
Growth of children with DS within various health categories
Growth of healthy children with DS and those who suffer from mild CHD showed no difference in mean height SDS (p = 0.832) and HC SDS (p = 0.790). Both girls and boys with DS and severe CHD had significant lower mean height SDS and HC SDS compared to healthy children with DS or children with DS with mild CHD (both p-values,0.001). Mean height is observed to be 0.4 SD lower. This growth retardation arises in the first year of life; during childhood no further deflection neither catch-up growth was observed.
Growth references
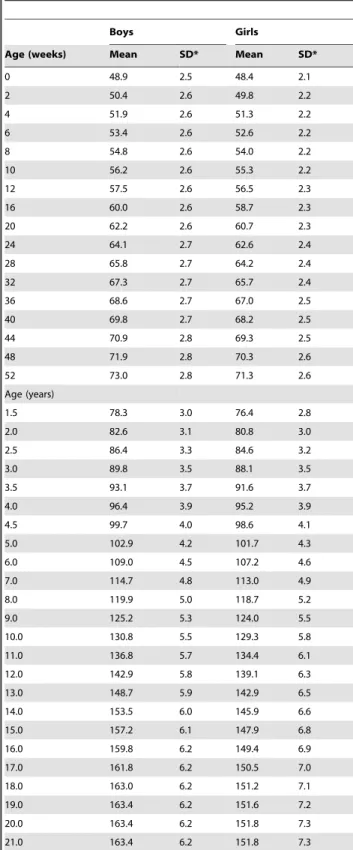
Data for growth references of height and HC were derived by combining the groups of healthy children with DS and children with DS and mild CHD (664 children for height, and 223 for HC (see Table 2). The number of measurements of these selected groups, arranged by age en sex, are shown in Table 3. By fitting the growth references for height, the cube root transformation of age showed the best fit and was selected. Table 4 summarizes mean height and SD, arranged by age and sex. Mean birth length was 48.9 cm in boys and 48.4 cm in girls with DS. Mean final height was 163.4 cm in boys and 151.8 cm in girls. These new reference charts are available at www.tno.nl/growthhttp://www. tno.nl/growth.
Table 2.Number of subjects and measurements for height and head circumference of 1,596 Dutch subjects with Trisomy 21, specified by the health categories.
Subjects Measurements
Height HC1 Height HC
Health
category Boys Girls Boys Girls Boys Girls Boys Girls
Healthy 257 167 71 57 1,378 938 202 139
Mild CHD 130 110 49 46 751 661 169 147
Severe CHD 114 155 38 50 738 997 134 187
Other disorders 390 273 140 88 2,970 2,125 443 357
Total 891 705 298 241 5,837 4,721 948 830
Abbreviations: HC – head circumference, CHD – congenital heart defect. 1
Growth references for HC were established for up to the age of 15 months. We did not have enough measurements to construct growth references after the age of 15 months. By fitting HC references for boys no transformation of age and for girls the age transformation proposed by Cole was applied. [17] Table 5 summarizes the LMS-values, arranged by age and sex. At birth mean HC was 33.8 cm in boys and 32.9 cm in girls with DS; at the age of 15 months this was 45.0 cm and 43.7 cm respectively.
Target Height
The calculated formulas for TH of children with DS are:
TH boys DS cmð Þ~41:8z0:328|ðpaternal heightÞz
0:359|ðmaternal heightÞ
Table 3.Frequencies of measurements for height used for plotting the reference curves for Dutch children with Down syndrome, arranged by age and sex.
Height1
Age (years) Male Female Total
0 474 392 866
1 241 201 442
2 201 147 348
3 178 129 307
4 151 101 252
5 132 96 228
6 117 86 203
7 83 89 172
8 105 66 171
9 86 49 135
10 72 52 124
11 62 46 108
12 68 37 105
13 52 29 81
14 36 28 64
15 31 12 43
16 20 14 34
17 8 6 14
$18 12 19 31
Total 2129 1599 3728
Head circumference2
Age (years) Male Female Total
0 244 199 443
1 69 50 119
2 22 18 40
3 19 10 29
4 17 9 26
Total 371 286 657
1
Height measurements of the children categorized as healthy or with only mild CHD (n = 664).
2
Head circumference of the children categorized as healthy or with only mild CHD, born at term (n = 223).
doi:10.1371/journal.pone.0031079.t003
Table 4.Mean height (cm) and standard deviation (SD) of the new references for length/height of Dutch children with Down syndrome, arranged by age and sex.
Boys Girls
Age (weeks) Mean SD* Mean SD*
0 48.9 2.5 48.4 2.1
2 50.4 2.6 49.8 2.2
4 51.9 2.6 51.3 2.2
6 53.4 2.6 52.6 2.2
8 54.8 2.6 54.0 2.2
10 56.2 2.6 55.3 2.2
12 57.5 2.6 56.5 2.3
16 60.0 2.6 58.7 2.3
20 62.2 2.6 60.7 2.3
24 64.1 2.7 62.6 2.4
28 65.8 2.7 64.2 2.4
32 67.3 2.7 65.7 2.4
36 68.6 2.7 67.0 2.5
40 69.8 2.7 68.2 2.5
44 70.9 2.8 69.3 2.5
48 71.9 2.8 70.3 2.6
52 73.0 2.8 71.3 2.6
Age (years)
1.5 78.3 3.0 76.4 2.8
2.0 82.6 3.1 80.8 3.0
2.5 86.4 3.3 84.6 3.2
3.0 89.8 3.5 88.1 3.5
3.5 93.1 3.7 91.6 3.7
4.0 96.4 3.9 95.2 3.9
4.5 99.7 4.0 98.6 4.1
5.0 102.9 4.2 101.7 4.3
6.0 109.0 4.5 107.2 4.6
7.0 114.7 4.8 113.0 4.9
8.0 119.9 5.0 118.7 5.2
9.0 125.2 5.3 124.0 5.5
10.0 130.8 5.5 129.3 5.8
11.0 136.8 5.7 134.4 6.1
12.0 142.9 5.8 139.1 6.3
13.0 148.7 5.9 142.9 6.5
14.0 153.5 6.0 145.9 6.6
15.0 157.2 6.1 147.9 6.8
16.0 159.8 6.2 149.4 6.9
17.0 161.8 6.2 150.5 7.0
18.0 163.0 6.2 151.2 7.1
19.0 163.4 6.2 151.6 7.2
20.0 163.4 6.2 151.8 7.3
21.0 163.4 6.2 151.8 7.3
*Individual height SDS can be calculated by: SDS = (height (cm)2mean height (cm))/SD (cm).
TH SDS boys DS SDð Þ~ðTH boys DS{163:4Þ=6:2
TH girls DS cmð Þ~8:64z0:387|ðpaternal heightÞz
0:422|ðmaternal heightÞ
TH SDS girls DS SDð Þ~ðTH girl DS{151:8Þ=7:3:
Comparison to the general Dutch population
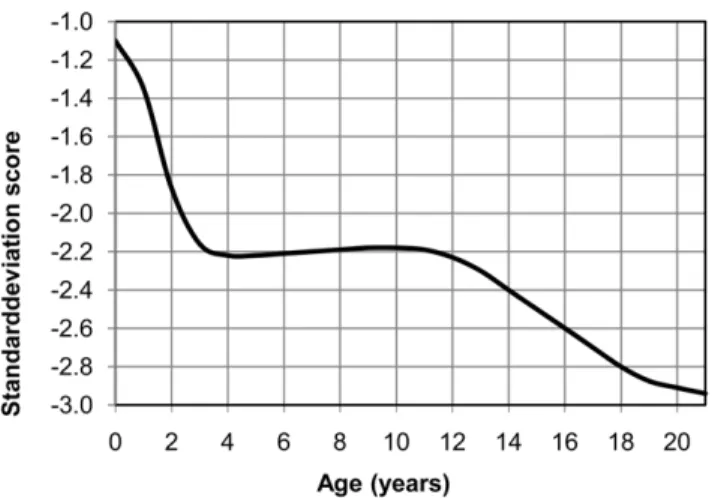
In comparison with the currently used reference charts for the general Dutch population, a markedly shorter stature was found in children with DS. [21] Mean height revealed a deflection in the first 3 years of life from21.1 SD at birth to22.2 SD at 3 years, for boys as well as girls. During the age interval of 3 to 12 years average growth remained stable at22.2 SD, and deflected again during puberty to a final height at22.9 SD (20.4 cm shorter) for boys and23.0 SD (18.9 cm shorter) for girls (Figure 1). [21] For HC, between birth and 15 months, mean values for boys and girls with DS are on average 1.8 SD lower (range 21.3 to 22.0) compared to the general Dutch population. [3]
Discussion
This study yields new charts of healthy growth of children with DS. Growth patterns were analyzed in 1,596 Dutch children with DS, with 10,558 height measurements and 1,778 HC measure-ments. All children were selected nationwide from pediatric hospital-based outpatient clinics specialized in the standard care of children with DS. Selection based on health complaints or influenced by financial restrictions was avoided, since all children with DS in the Netherlands were invited to avail of this care without financial barriers, as encouraged by the Dutch Down Syndrome Foundation (largest Dutch parent supporting organi-zation). The result is a nationwide representative sample.
Our new reference charts for Dutch children with DS are unique. No previous studies on growth in DS made such a stringent selection of subjects with respect to their health. All children have received high quality medical care according to the guideline of the Pediatric Association of the Netherlands and underwent standard screening at regular intervals, provided by the regional hospital-based outpatient clinics for children with DS. [13] This screening programme provided confidence that children categorized as healthy in fact have no undiagnosed concomitant disorders, such as hypothyroidism, mild CHD and celiac disease. To illustrate the stringent selection: children with positive screening results for hypothyroidism and celiac disease were excluded (even though appropriate treatment was started early), because there is no evidence that growth could not be affected already.
The children with severe CHD showed growth retardation during the first year of life. After this period they had growth velocities similar to the healthy children with DS. In the Netherlands the surgical correction of significant CHD takes place preferably at the age of 2–4 months. [22] This early treatment may result in normal growth after the age of 1 year without further deflection. Cronk et al.also described growth retardation caused by CHD in children with DS. [6] However, they were unable to evaluate the effects of different types of cardiac lesions (those which healed spontaneously or those treated by corrective surgery) on growth. The present study provided appropriate data to make this distinction.
When comparing mean final heights of children with DS with other countries, we should take into account the different inclusion
Table 5.New head circumference (cm) references for 0–15 months in Dutch children with Down syndrome: values of L (skewness), M (median), and S (coefficient of variation)*, categorized by age and sex.
Boys Girls
Age (weeks) L M S* L M S*
0 2.96 33.8 .0349 1 32.9 .0267
2 2.65 34.6 .0343 1 33.8 .0272
4 2.34 35.3 .0336 1 34.7 .0277
6 2.03 36.1 .0330 1 35.5 .0280
8 1.72 36.8 .0324 1 36.4 .0281
10 1.42 37.5 .0319 1 37.1 .0279
12 1.12 38.2 .0313 1 37.8 .0276
16 0.54 39.4 .0302 1 38.8 .0270
20 20.01 40.4 .0292 1 39.7 .0265
24 20.52 41.2 .0283 1 40.4 .0261
28 20.99 42.0 .0274 1 41.0 .0259
32 21.41 42.6 .0266 1 41.5 .0257
36 21.80 43.1 .0258 1 42.0 .0255
40 22.14 43.5 .0250 1 42.3 .0254
44 22.45 43.9 .0243 1 42.7 .0252
48 22.72 44.2 .0237 1 42.9 .0251
52 22.97 44.4 .0231 1 43.2 .0249
56 23.19 44.6 .0225 1 43.3 .0248
60 23.40 44.8 .0221 1 43.5 .0247
65a 2
3.64 45.0 .0216 1 43.7 .0245
a
Corresponding with 15 months.
*Individual head circumference SDS can be calculated by: SDS = {(height (cm)/ M)L
21}/L*S, L?0 (if L = 0: SDS = ln(height (cm)/M)/S). doi:10.1371/journal.pone.0031079.t005
Figure 1. Mean height (SDS) of the Dutch children with Down syndrome compared to the general population.Comparison is made to the mean height of the national Dutch growth study (2009), calculated in standard deviation score (SDS).
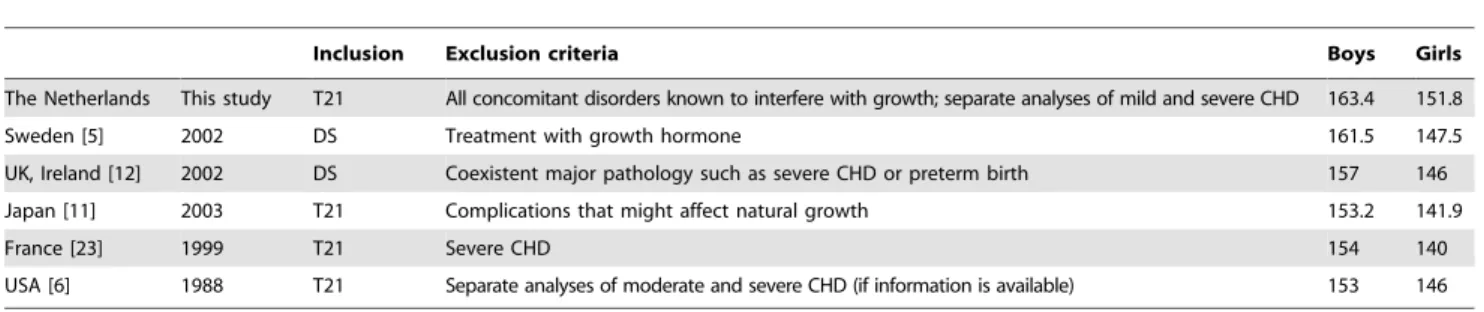
and exclusion criteria (Table 6). However, it is probably reasonable to conclude that Dutch children with DS are relatively tall among children with DS. Growth charts are available for West-European children with DS in Sweden, the UK and Ireland, and Northeastern France. [5,12,23]
Our study is the first to propose formulas to estimate the expected final height in children with DS. The TH formulas were derived under the assumption that the correlation between mid parental height SD and child height SD in Dutch children with DS is identical to the general Dutch population. Further research is needed to investigate whether this assumption is justified.
We compare HC in our population with values published by others. Reference charts for HC are also available for children with DS from Sweden, Northeastern France, Sicily, UK and Ireland, the USA, Egypt and Saudi Arabia, suitable for use in these countries. [5,10,12,23–26] Benefits of our study are the LMS-values presented, whereby for each individual the deviation exactly can be calculated. Comparing HC showed the Swedish children with DS have an average HC of 33 cm at birth, similar to our children with DS. [5] This mean values at birth corresponds with 20.5 SD on the reference charts for the general Swedish population, however with 21.5 SD for the general Dutch population. At 15 months mean HC is also identical in Swedish and Dutch children with DS. Since the other studies do not present enough details of their observations, we were unable to make further comparisons.
What are the main differences in growth pattern between DS and the general population? Mean birth length in DS is 1 SD lower than in the general population, indicating that children with DS already show retarded growth during pregnancy. Also, during the first three years of life they grow slower compared to the general population; the gap stays relatively constant during the age interval 3–12 years. After the age of 12 year a further deflection in growth is observed. This pattern is observed to be the same in boys and girls with DS. The mentioned three periods are already described by Karlberg et al. in the infant-childhood-puberty (ICP) model, which described during infancy (from birth up to about 3 years of age) and during puberty higher growth velocity than during childhood. [27] So, the children with DS show growth retardation just during the critical periods of growth when the highest growth velocity occurs. This finding indicate the age periods in which further health benefit may be obtained. Health care professionals should focus on these critical periods when providing preventive care to children with DS with the aim to establish ways to optimize growth during these specific periods. Either the observed growth retardation may be due to their genetic makeup or it may be caused by physical problems they encounter, such as feeding problems. In puberty an early or short growth
spurt also limits final growth. Further research is needed to explain our observations and to provide physiological clarification on the nature of this growth retardation. All in all, these effects result in a substantial difference in final height (boys: 20.4 cm; girls: 18.9 cm).
Body weight will be reported separately. Because of the current increase in the proportion of children with obesity, it is not desirable to reflect the present distribution of weight in this population. Therefore, the increase in the proportion of children with obesity and the need for normative charts for weight deserve special attention. [21,28]
A limitation of our study is that the measurements of height and HC were retrospectively collected. This methodology may lead to more variation in the measurements compared to studies that used prospectively collected data, as all general Dutch growth studies did. We were however unable to detect such increased measurement variability in the data. The S-curves (which model the coefficient of variation) were quite similar in our growth charts and the charts of the general Dutch population (established in 2009). So, we do not expect that the used methodology had an impact on the variability in the growth charts. A benefit of the applied methodology is the larger and timelier data set. Similar methods were used in other growth studies in children with DS. [5,12,23]
The longitudinal data resulted in a varied number of measurements per child. To determine the possible influence of this variation, the statistical analyses were repeated where data points were weighted – whereby a weighting factor was calculated as the inverse of the number of measurements per child – in order to prevent over-representing children with a large number of measurements. This solution was almost the same as the unweighted analysis; differences in mean height were smaller than 0.1 SD.
For the interpretation of individual growth curves plotted on a reference chart, criteria are needed to define abnormal growth. No specific criteria for the charts for children with DS have been proposed. The utility of the referral criteria for the general Dutch population as presented in the guideline ‘Detection and referral criteria in short stature’ has not been tested for growth in children with DS. Further research is necessary to see whether such referral criteria are equally suitable for children with DS. [29,30] For the moment, we tentatively suggest to use the criteria for the general population (which are all framed in SDS) for children with DS.
Implications
The availability of appropriate up-to-date growth charts, that reflect healthy growth of height and HC in Dutch children with DS, will potentially improve the medical care they receive. Using
Table 6.Growth studies presenting mean final height (cm) of children with Down syndrome, with the applied inclusion and exclusion criteria, by country of origin.
Inclusion Exclusion criteria Boys Girls
The Netherlands This study T21 All concomitant disorders known to interfere with growth; separate analyses of mild and severe CHD 163.4 151.8
Sweden [5] 2002 DS Treatment with growth hormone 161.5 147.5
UK, Ireland [12] 2002 DS Coexistent major pathology such as severe CHD or preterm birth 157 146
Japan [11] 2003 T21 Complications that might affect natural growth 153.2 141.9
France [23] 1999 T21 Severe CHD 154 140
USA [6] 1988 T21 Separate analyses of moderate and severe CHD (if information is available) 153 146
these charts secondary growth abnormalities may be detected more accurately. For example, limited growth of height may be a symptom of hypothyroidism and a relative large HC may be caused by hydrocephalus. The charts were based on a large sample that is stringently selected on the basis of their health status, and therefore we will encourage research to investigate the suitability of these charts for international application.
In children with DS with severe CHD growth is decelerated during the first year of life, in comparison to reference growth in the healthy infants with DS. During childhood no catch-up growth is noticed in these children with DS and severe CHD, neither does their growth decline further. Future research should focus on the exact qualities of the observed deflections in growth of otherwise healthy children with DS: is their growth spurt restricted with a lower velocity or do other phenomena play a role. Lack of significant catch up growth in children with DS and severe CHD could be the result of similar failure to spurt. We can only hypothesis on the full nature of growth retardation in otherwise healthy children with DS: as their growth is primarily restricted by Trisomy 21 the mechanism is unknown. Is it primarily metabolic, hormonal or chondrocyte dysfunction? Or could it be explained by further advanced genome-wide analysis?
Conclusions
Growth patterns in otherwise healthy Dutch children with DS were established based on data from a large nationwide population. Growth in healthy children with DS differ from children with DS and severe CHD (0.4 SD). The established growth charts demonstrate the three age periods when height differences between children with and without DS increase: during pregnancy, during the first three years of life, and during puberty. This growth pattern results in a mean final height of 163.4 cm in healthy boys with DS and 151.8 in girls (a difference of 3 SD in comparison to the general population), and mean HC at birth of 33 cm and 44 cm at the age of 15 months (almost 2 SD less than in the general Dutch population). All in all, with these new growth charts, that reflect healthy growth in children with DS, health care professionals can monitor growth of individual children with DS optimal. In this way, early identification of growth retarding comorbidities will be enabled and ultimately the health of children with DS will be improved.
Acknowledgments
The following pediatricians (most on behalf of the Down Syndrome Medical Interest Group of the Pediatric Association of the Netherlands) are thanked for their co-operation in providing their data: C.D. Aarts-Tesselaar, MD (Amphia Ziekenhuis, Breda); A.J.I.W. Bergman-van Emous, MD (Ziekenhuis Rivierenland, Tiel); L.A. Bok, MD (Maxima Medisch Centrum, Veldhoven); W.E.A. Bolz, MD, PhD (Elkerliek Ziekenhuis, Helmond); M.E. Doornbos, MD (Albert Schweitzer Zieken-huis, Sliedrecht); S.E. Elkerbout, MD (Rijnland ZiekenZieken-huis, Leiderdorp); W. Goudsmit-Meijer, MD (BovenIJ Ziekenhuis, Amsterdam); A.A.M. Haagen, MD (VieCuri Medisch Centrum, Venlo); J.N. Jansen, MD (Lievensberg Ziekenhuis, Bergen op Zoom); G.J.M. Janssen, MD (Maasziekenhuis Pantein, Boxmeer); A.C.M. van Kessel, MD (Diacones-senhuis, Meppel); E.S.T. Knots, MD (Catharina Ziekenhuis, Eindhoven); E.H.G. van Leer, MD, PhD (Groene Hart Ziekenhuis, Gouda); S.A. de Man, MD, PhD (Amphia Ziekenhuis, Breda); K.M.E.J. Oberndorff, MD (Orbis Medisch Centrum, Sittard-Geleen); J. Potjewijd, MD (Diacones-senhuis, Meppel); W.P.M. Rijnvos, MD (TweeSteden Ziekenhuis, Tilburg); H.G.H. Thijs, MD (Gelre Ziekenhuizen, Zutphen); A.J.C.M. van der Velden, MD (Franciscus Ziekenhuis, Roosendaal); E. de Vries, MD, PhD (Jeroen Bosch Ziekenhuis, ’s Hertogenbosch); M.E. Weijerman, MD (VU Medisch Centrum, Amsterdam); A.M. van Wermeskerken, MD (Flevozie-kenhuis, Almere); H. Van Wieringen, MD (St. Antonius Zie(Flevozie-kenhuis, Utrecht); J.P. de Winter, MD, PhD (Spaarne Ziekenhuis, Hoofddorp); I.I.C. Wymenga, MD (Martini Ziekenhuis, Groningen); P.H.T. van Zwieten, MD (HagaZiekenhuis, Juliana Kinderziekenhuis, Den Haag). Also the physicians for Intellectually Disability Medicine were thanked for providing data: A.M.W. Coppus, MD (Elkerliek Ziekenhuis, Deurne) and P.T.H. Vos, MD (Jeroen Bosch Ziekenhuis, Boxtel).
The following youth health care physicians, caring for children in special education are also thanked for their co-operation in providing data: H.A.G. van Domselaar-Renting, MD (GGD Gelre-IJssel); P.J.G.A.M. van Eeden, MD (GGD Zuid-Holland Zuid); V.J.J.M. Gijsen-Mol, MD (GGD Zuid Limburg); A. Goessen-Ickenroth, MD (GGD Zuid Limburg); M.W.G. Govaerts, MD (GGD Zuid Limburg); E. van Hoorn, MD (GGD Zaanstreek-Waterland); M.A.J. van Keulen, MD (GGD IJsselland); J. Lemij-Van Egmond, MD (GGD Hollands Midden); N.P. Meester, MD (GGD Zuid-Holland West); W.M. Nagelsmit, MD (GGD Kennemerland); I.T. Schramel, MD (GGD Midden Nederland); A.A.M. Sluiter-Van Nies, MD (GGD Gelre-IJssel); M.E.T. van Strien-Leloux, MD (GGD Kenne-merland); M.G.A. van der Voort-Van Soest, MD (GGD Zuid Limburg).
Author Contributions
Conceived and designed the experiments: HVGO PVD JVW. Performed the experiments: HVGO. Analyzed the data: HVGO PVD. Contributed reagents/materials/analysis tools: PVD SVB. Wrote the paper: HVGO PVD AMOM SEB SVB JVW.
References
1. World Health Organization (WHO) Multicentre Growth Reference Study Group (2006) WHO Child Growth Standards based on lenght/height, weight and age. Acta Paediatr 450: 76–85.
2. van Buuren S, Van Wouwe JP (2008) WHO Child Growth Standards in action. Arch Dis Child 93: 549–551.
3. Fredriks AM, van Buuren S, Burgmeijer RJ, Meulmeester JF, Beuker RJ, et al. (2000) Continuing positive secular growth change in The Netherlands 1955– 1997. Pediatr Res 47: 316–323.
4. Fredriks AM, van Buuren S, Jeurissen SE, Dekker FW, Verloove-Vanhorick SP, et al. (2004) Height, weight, body mass index and pubertal development references for children of Moroccan origin in The Netherlands. Acta Paediatr 93: 817–824.
5. Myrelid A, Gustafsson J, Ollars B, Anneren G (2002) Growth charts for Down’s syndrome from birth to 18 years of age. Arch Dis Child 87: 97–103. 6. Cronk C, Crocker AC, Pueschel SM, Shea AM, Zackai E, et al. (1988) Growth
charts for children with Down syndrome: 1 month to 18 years of age. Pediatrics 81: 102–110.
7. Cronk CE (1978) Growth of children with Down’s syndrome: birth to age 3 years. Pediatrics 61: 564–568.
8. Cremers MJ, van de Tweel I, Boersma B, Wit JM, Zonderland M (1996) Growth curves of Dutch children with Down’s syndrome. J Intellect Disabil Res 40(Pt 5): 412–420.
9. Lyon AJ, Preece MA, Grant DB (1985) Growth curve for girls with Turner syndrome. Arch Dis Child 60: 932–935.
10. Meguid NA, El-Kotoury AI, bdel-Salam GM, El-Ruby MO, Afifi HH (2004) Growth charts of Egyptian children with Down syndrome (0–36 months). East Mediterr Health J 10: 106–115.
11. Kimura J, Tachibana K, Imaizumi K, Kurosawa K, Kuroki Y (2003) Longitudinal growth and height velocity of Japanese children with Down’s syndrome. Acta Paediatr 92: 1039–1042.
12. Styles ME, Cole TJ, Dennis J, Preece MA (2002) New cross sectional stature, weight, and head circumference references for Down’s syndrome in the UK and Republic of Ireland. Arch Dis Child 87: 104–108.
13. Van Wouwe JP, Siderius EJ, Borstlap R, Nijenhuis TA, Hirasing RA (2001) [Optimal medical care for children with Down syndrome and their parents]. Ned Tijdschr Geneeskd 145: 1617–1621.
14. Fredriks AM, Buuren van S, Burgmeijer RJF, Verloove-Vanhorick SP, Wit JM (2002) [Growth charts. Manual to measure and weigh children and recording of growth charts]. Leiden: TNO/LUMC.
15. Rigby RA, Stasinopoulos DM (2005) Generalized additive models for location, scale and shape. Appl Statist 54: 507–554.
16. Cole TJ, Green PJ (1992) Smoothing reference centile curves: the LMS method and penalized likelihood. Stat Med 11: 1305–1319.
17. Cole TJ, Freeman JV, Preece MA (1998) British 1990 growth reference centiles for weight, height, body mass index and head circumference fitted by maximum penalized likelihood. Stat Med 17: 407–429.
19. Dommelen van P, Schonbeck Y, Buuren van S (2011) A simple calculation of the target height. Arch Dis Child doi:10.1136/archdischild-2011-301095. 20. Hermanussen M, Cole J (2003) The calculation of target height reconsidered.
Horm Res 59: 180–183.
21. Talma H, Scho¨nbeck Y, Bakker B, Hirasing RA, Buuren van S (2010) [Growth charts 2010: manual to measure and weigh children and recording of growth charts]. Leiden: TNO, Quality of Life.
22. Weijerman ME, de Winter JP (2010) Clinical practice. The care of children with Down syndrome. Eur J Pediatr 169: 1445–1452.
23. Toledo C, Alembik Y, Aguirre JA, Stoll C (1999) Growth curves of children with Down syndrome. Ann Genet 42: 81–90.
24. Piro E, Pennino C, Cammarata M, Corsello G, Grenci A, et al. (1990) Growth charts of Down syndrome in Sicily: evaluation of 382 children 0–14 years of age. Am J Med Genet Suppl 7: 66–70.
25. Palmer CG, Cronk C, Pueschel SM, Wisniewski KE, Laxova R, et al. (1992) Head circumference of children with Down syndrome (0–36 months). Am J Med Genet 42: 61–67. 10.1002/ajmg.1320420114 [doi].
26. Al Husain M (2003) Growth charts for children with Down’s syndrome in Saudi Arabia: birth to 5 years. Int J Clin Pract 57: 170–174.
27. Karlberg J (1987) On the modelling of human growth. Stat Med 6: 185–192. 28. Cole TJ, Roede MJ (1999) Centiles of body mass index for Dutch children aged
0–20 years in 1980–a baseline to assess recent trends in obesity. Ann Hum Biol 26: 303–308.
29. Grote FK, van Dommelen P, Oostdijk W, de Muinck Keizer-Schrama SM, Verkerk PH, et al. (2008) Developing evidence-based guidelines for referral for short stature. Arch Dis Child 93: 212–217.