Economic inequality increases risk taking
B. Keith Paynea,1, Jazmin L. Brown-Iannuzzib, and Jason W. Hannaya
aDepartment of Psychology and Neuroscience, University of North Carolina at Chapel Hill, Chapel Hill, NC 27599; andbDepartment of Psychology, University
of Kentucky, Lexington, KY 40506-0044
Edited by Michael W. Kraus, Yale University, New Haven, CT, and accepted by Editorial Board Member Mary C. Waters March 17, 2017 (received for review October 7, 2016)
Rising income inequality is a global trend. Increased income inequality has been associated with higher rates of crime, greater consumer debt, and poorer health outcomes. The mechanisms linking inequality to poor outcomes among individuals are poorly understood. This research tested a behavioral account linking inequality to individual decision making. In three experiments (n=
811), we found that higher inequality in the outcomes of an eco-nomic game led participants to take greater risks to try to achieve higher outcomes. This effect of unequal distributions on risk tak-ing was driven by upward social comparisons. Next, we estimated economic risk taking in daily life using large-scale data from inter-net searches. Risk taking was higher in states with greater income inequality, an effect driven by inequality at the upper end of the income distribution. Results suggest that inequality may promote poor outcomes, in part, by increasing risky behavior.
income inequality
|
risk taking|
decision making|
inequality|
socioeconomic statusR
ising income inequality is a global trend in the 21st century (1). Nations and states with higher levels of economic in-equality tend to have higher rates of self-defeating decision making related to money, including crime (2), gambling (3), and greater consumer debt (4). Inequality is also associated with social and health problems, including higher rates of violence, drug use, and shorter life expectancies (5–7). Among economically developed countries, effects of inequality remain substantial after controlling for median income levels, suggesting that inequality in the distri-bution of income has unique effects distinct from individual income levels. Given the historically high levels of income inequality in many countries, understanding the effects of inequality is a central concern across the social and medical sciences. Despite its im-portance, the mechanisms linking inequality to the behaviors and outcomes of individuals remain poorly understood. We tested a behavioral explanation for why people may have poorer outcomes in more unequal places, drawing on evolutionary theory regarding risk preferences and psychological research on social comparisons. We hypothesized that higher inequality leads to riskier behavior, in part, through social comparison processes.Research on social comparison demonstrates that people look to others to judge their own standing on important dimensions, es-pecially when objective standards are lacking (8, 9). One important dimension on which people compare is financial resources. Al-though money provides an objective metric for income, no objective standard exists for judging how much one needs to be satisfied.
Relative comparisons have long been theorized to be important factors shaping satisfaction with one’s income (10). Consistent with this idea, one study of 16,000 workers found that relative income compared with others in one’s workplace predicted job satisfaction and quitting rates better than absolute income (11). Experimental studies have likewise found that participants were more satisfied with earnings when the amount was higher than a comparison group, even when the amount of money earned was held constant (11). Holding one’s own income constant, individ-uals are less satisfied with their income if they have wealthier neighbors (12) and if the typical pay in their occupation is higher (13). This evidence suggests that upward comparison to those with more income generally leads people to feel they need more to be
satisfied, whereas downward comparisons lead people to feel satisfied with less (14).
Perceived need has a precise relationship to risk taking. Risk is defined as the variance in decision outcomes (i.e., high-risk deci-sions have a high potential reward but also a high potential for loss). Developed to explain animal foraging behavior, Risk Sen-sitivity Theory (RST) argues that when an animal’s caloric energy intake is high, it will be risk-averse, preferring low-risk/low-reward foraging options. As its energy budget declines, it becomes risk-seeking, preferring high-risk/high-reward options (15, 16). Humans also conform to predictions of RST. In experimental gambles, as the minimum level of points needed to earn a monetary reward increases, subjects become more likely to take a high-risk/high-reward gamble to achieve the necessary points (17–19). Field studies suggest similar patterns outside the laboratory. In professional football, as the yards needed to reach a first down increase, teams become more likely to choose a high-risk pass over a safer running play (20).
In humans, perceptions of need may be influenced not only by material resources but also by subjective factors and relative comparisons and, therefore, by inequality. Authors sometimes use
“inequality”to describe the effects of individual poverty or relative disadvantage, which refer to an individual’s resources or position. In contrast, we use the term inequality to describe the variance in an income distribution (as is measured using metrics such as the Gini coefficient). Thus, two individuals with identical incomes may experience different levels of inequality if they are in contexts (i.e., nations, states, cities, or situations) with different levels of variance in the income distributions. The distinction between poverty and inequality is important because epidemiological evidence suggests that higher inequality is associated with poorer outcomes even for individuals with average incomes (5, 7).
Past research on objective income has found that the poor tend to be risk-averse because they have little margin for error or
Significance
Income inequality is rising around the world. Increased income inequality has been linked with higher rates of crime, greater debt, and poorer health, but the mechanisms linking inequality to poor outcomes among individuals are poorly understood. This research tested a behavioral account linking inequality to indi-vidual decision making. The account suggests that more unequal outcomes lead people to perceive that they need more resources to be satisfied. Higher perceived needs, in turn, motivate greater risk taking to meet those needs. Results of three experiments and an analysis of large-scale internet search data supported the proposed account. Results suggest that inequality may promote a range of poor outcomes, in part, by increasing risky behavior.
Author contributions: B.K.P., J.L.B.-I., and J.W.H. designed research; J.L.B.-I. and J.W.H. performed research; B.K.P. and J.L.B.-I. analyzed data; and B.K.P. wrote the paper.
Conflict of interest statement: The authors acknowledge funding from the Spencer Foundation.
This article is a PNAS Direct Submission. M.W.K. is a guest editor invited by the Editorial Board.
1To whom correspondence should be addressed. Email: [email protected].
This article contains supporting information online atwww.pnas.org/lookup/suppl/doi:10. 1073/pnas.1616453114/-/DCSupplemental.
PSYCHOL
OGICAL
AND
COGN
ITIVE
SC
loss (21, 22). In contrast, relative disadvantage compared with others tends to increase risk taking, as individuals strive to catch up to their comparison standards (23–25). In one study, partic-ipants were tested in pairs. One member of each pair was given $10 and the other was given nothing, and then both subjects completed a series of gambling decisions to earn money. When the disparity was known to subjects, the disadvantaged subjects made riskier gambles than the advantaged subjects. But the difference was eliminated when subjects did not know about the disparity, suggesting that it was the knowledge of relative dis-advantage rather than resources driving the effect (24).
When inequality in a distribution increases but one’s own po-sition is unchanged, one could in principle compare upward or downward with opposing effects. Empirically, however, social comparisons in the domain of financial resources display an im-portant asymmetry: Upward social comparisons are weighted more heavily than are downward social comparisons (26, 27). Because of this psychological asymmetry favoring upward com-parison, we predicted that people would focus on increases among the wealthy and neglect decreases among the poor. Inequality may therefore function much like relative disadvantage, even when one’s own position has not changed. As a result, increases in in-equality are expected to have the same behavioral effects on perceived needs as if everyone else were getting richer.
Considering both RST and asymmetric social comparisons, we predicted that inequality would increase risk taking. Specifically, we reasoned that (i) individuals make primarily upward compar-isons to determine their need level, (ii) such upward comparisons imply a higher comparison standard under high inequality than low inequality, and (iii) people take higher risks as their perceived need increases. Therefore, we hypothesized that individuals may take greater risks as inequality rises. We tested this hypothesis in three experiments. In addition to experimental findings, we ex-amined whether geographical differences in inequality are asso-ciated with greater risk taking as our hypothesis implies. We estimated the prevalence of risk taking in each state using the frequency of internet search terms reflecting financially risky be-havior and tested the hypothesis that states with higher income inequality would have greater risk-taking tendencies.
Study 1
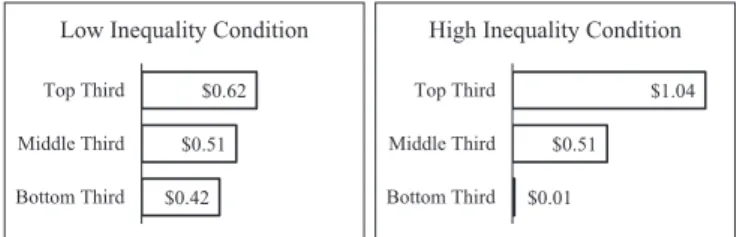
To test the hypothesis that social comparison increases perceived monetary need, we conducted an experiment in which partici-pants learned about a gambling task and received information about how much money previous players of the same game had earned on average. Inequality was manipulated by showing participants a distribution of previous players’ earnings, sepa-rated into three groups (the top third, middle third, and bottom third; see Fig. 1). In the low-inequality condition, the top third earned only modestly more than the bottom third, whereas the difference was larger in the high-inequality condition. Average earnings were equated across conditions. This experimental paradigm allows us to isolate the effect of inequality independent of average income. Thus, the only difference between the high-inequality and low-high-inequality conditions was the variance.
Participants were asked to indicate their perceived need by answering,“What is the minimum amount of money you would need to win in order to feel satisfied with your performance in the Decision Game?”Next, subjects were given the opportunity to make three gambles to earn real money. Each gamble allowed five options that ranged from low risk/low reward (e.g., 90% chance to win $0.28, 10% chance of winning nothing) to high risk/high reward (e.g., 5% chance to win $5.00, 95% chance of winning nothing). The options were equated in expected value and differed only in risk (i.e., outcome variance). Risky decisions were measured as the average probability of losing, averaged across the three gambles.
To confirm that participants perceived the high-inequality condition as more unequal, we collected pilot data (n=222) in which we manipulated inequality of outcomes and measured perceived inequality as a manipulation check. We also measured subjective relative deprivation—the feeling of resentment that others have more than oneself. Although resources did not vary objectively across conditions, participants may have felt sub-jectively deprived in the high-inequality condition. Finally, we measured perceived need using the item described above. The pilot study confirmed higher perceived inequality (on a scale from 1 to 5) in the high-inequality condition (mean=4.14, SD=0.68) than in the low-inequality condition (mean =2.83, SD=0.40), t(220)=17.44,P<0.001. Subjective relative deprivation was also slightly higher in the high-inequality condition (mean=2.62, SD= 0.68) than the low-inequality condition (mean=2.42, SD=0.58), t(220)=2.35,P=0.020, although the effect was much larger on inequality (R2=0.58) than on relative deprivation (R2=0.03). As predicted, perceived need was higher in the high-inequality con-dition (mean=$0.82, SD= $0.48) than the low-inequality con-dition (mean = $0.68, SD = $0.46), t(218) = 2.20, P < 0.05. Perceived need was associated with perceived inequality,r=0.28, P< 0.001 but not with relative deprivation,r =0.07, P=0.33. These analyses suggest that the manipulation was effective.
In the main study (n=221), we manipulated inequality using the same materials as the pilot study, measured perceived need, and participants made gambling decisions. As predicted, the high-inequality group expressed higher perceived need (mean =$0.76, SD=$0.50) than the low-inequality group (mean =$0.61, SD = $0.34), t(218)= 2.59,P = 0.01 (see Fig. 2). Moreover, inequality increased risky gambling decisions, with a higher probability of losing in the high-inequality condition (mean=0.51, SD=0.24) than in the low-inequality condition (mean=0.44, SD=0.24),t(219)=2.21,P= 0.028. Perceived need was significantly associated with risk taking,r= 0.19,P=0.004. Bootstrapping analyses indicated a significant indirect $0.42
$0.51 $0.62
Bottom Third Middle Third Top Third
Low Inequality Condition
$0.01 $0.51
$1.04
Bottom Third Middle Third Top Third
High Inequality Condition
Fig. 1. Schematic illustration of the low-inequality and high-inequality conditions in study 1.
0.00
0.20
0.40
0.60
0.80
1.00
1.20
1.40
1.60
1.80
2.00
Low
High
P
erceived Need ($)
Inequality
0.10
0.20
0.30
0.40
0.50
0.60
0.70
Low
High
Risk (Probability
of
L
o
ss)
Inequality
Need
Risk
effect of inequality on risk taking, mediated by perceived need,B= 0.03,SEB = 0.02, 95% CI= 0.01, 0.07. Higher inequality in the distribution led to riskier decisions via its effects on perceived need.
Study 2
Because the effect of unequal distributions on risk taking is a central finding, we replicated the effect in a separate sample. This study used a within-subjects manipulation of inequality in which subjects (n=107) played 30 trials of the gambling game. Each trial included a bar graph depicting the level of inequality of outcomes in each game. These graphs were similar to the graphs presented in study 1. The games had three levels of inequality (high, medium, and low). Subjects indicated their gambles for each game by moving a sliding scale from“low risk/low reward” to “high risk/high reward.” The position on the sliding scale was recorded on a scale from 1 to 100, although the participants did not see the numeric labels. This design avoided using numeric labels on either the distribution graphs or the sliding scale. We can thus be more confident that the effects were driven by preferences regarding the balance of risk and reward, as opposed to anchoring on any specific numeric values.
As can be seen in Fig. 3, subjects chose the riskiest options in the high-inequality condition, mean=70.14, SD =28.23, with intermediate risk in the medium-inequality condition, mean= 65.48, SD=20.70, and the least risk in the low-inequality con-dition, mean=56.24, SD=31.41,F(2, 212)=8.88,P<0.001. As inequality of outcomes increased, risk taking increased linearly, replicating the finding of study 1.
Study 3
We hypothesized that high inequality increases risk taking because participants selectively compare with the high earners and neglect the low earners. To test this mechanism directly, we measured the social comparisons participants made. A standard way to measure upward or downward social comparison is to provide subjects with an opportunity to learn information about other people’s char-acteristics and let them choose which they prefer to see (28). In a first round of the gambling game, participants (n =261) played 10 trials in which earning distributions were shown as in Fig. 1, but the high and low bars of the distribution were hidden. Participants could choose to see either the high or the low bar before making their gambling decision, which provided a measure of preferences for upward or downward comparisons. Next, participants com-pleted a second round of gambling in which they saw the full distributions. We examined the gambling decisions from the sec-ond round as the dependent variable. Our account predicts that (i) participants will display an overall preference for upward com-parisons and (ii) individuals with the strongest preference for
upward comparisons will respond to inequality by increasing their risk taking the most.
This design also provides a test of an alternative explanation for our findings. Research on“last place aversion”suggests that although people dislike low status in general, they are especially averse to being in last place. Kuziemko et al. found that partic-ipants who were in the last position in an earnings distribution took riskier gambles than in other positions in an effort to move out of last place (29). High inequality could motivate riskier gambles because of a desire to avoid the lower extremes of the high-inequality distribution (i.e., “last place”) rather than the desire to achieve the higher extremes. If so, then high inequality should increase risky decisions primarily among individuals who make downward comparisons to those in the lowest position. Thus, our upward comparison hypothesis and the last place aversion hypothesis make opposing predictions.
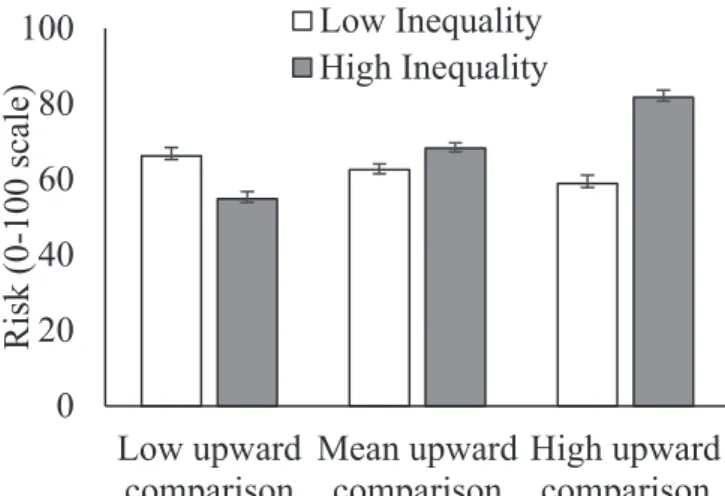
As expected, participants chose more upward comparisons, mean=63%, than downward comparisons, mean=37%,t(260)= 11.36, P < 0.001. The proportion of upward comparisons was significantly greater than chance (50%),t(260)=5.97,P<0.001. We tested whether participants’comparisons moderated the ef-fects of inequality on risk taking using a mixed-model ANOVA (see Fig. 4). Replicating the previous experiments, participants made riskier gambles when inequality was high rather than low, as reflected in a significant main effect of inequality,F(1, 259)=7.19, P=0.008. This effect was qualified by an interaction between in-equality and upward comparisons, F(1, 259) =63.50, P< 0.001. Among participants who made more upward comparisons (1 SD above the mean), their gambles were much riskier on high-inequality trials (mean=81.70, 95% CI=77.90, 85.50) than low-inequality trials (mean=58.86, 95% CI=54.45, 63.27). Participants at the mean of upward comparison also made significantly riskier decisions on high-inequality trials (mean=68.26, 95% CI=65.57, 70.95) than low-inequality trials (mean =62.52, 95% CI=59.41, 65.64). Among participants who made the lowest number of upward comparisons (1 SD below the mean), gambles were riskier on low-inequality trials (mean=66.19, 95% CI=61.78, 70.60) than high-inequality trials (54.83, 95% CI=51.02, 58.64).
This pattern is inconsistent with last place aversion as an ex-planation for these findings because participants who compared downward did not take more risks in the high-inequality condition to avoid the worst outcome. Instead, they took fewer risks. The observed pattern is consistent with the upward comparison expla-nation, because increased risk taking in high-inequality conditions was driven by the majority of subjects who compared upward.
10
30
50
70
Low Med High
Risk (1-100
scale)
Inequality
Risk
Fig. 3. Risk preference as a function of inequality in study 2. Columns re-flect means, and error bars rere-flect SEs.
0
20
40
60
80
100
Low upward
comparison
Mean upward
comparison
High upward
comparison
Risk (0-100
scale)
Low Inequality
High Inequality
Fig. 4. Risk preference as a function of inequality and upward comparisons in study 3. Columns reflect means, and error bars reflect SEs.
PSYCHOL
OGICAL
AND
COGN
ITIVE
SC
Study 4
The experimental findings reported above have the advantage of experimental control and the ability to draw conclusions about causality. However, a limitation of such experiments is that they may not reflect how inequality and risk taking operate in ev-eryday life. Data on risky behavior are difficult to collect because people often underreport risky behaviors on surveys. To obtain a more objective measure of risk taking in daily life, we used data
from Google.com to measure the frequencies of search terms
reflecting monetary risk taking.
The search data included all Google searches since 2004, by state. We generated four a priori search terms deemed to reflect efforts to acquire money or goods without regard for risk or loss:
“pay day loans,” “lottery,” “win money,”and“no down payment.” To increase the reliability of the risk-taking index, we also included the four searches most highly correlated with each term, which were generally alternate spellings or phrasings of the same terms. This created a risk-taking index including 20 search terms with high reliability (Cronbach’s alpha=0.95). To control for the possibility that high-risk searches were driven by searches for ways to earn money in general, we created a second list of search terms expected, a priori, to reflect low-risk strategies for financial gain. The search terms were “savings,” “invest,” “retirement account,” and“pay off debt.”We validated these terms in an online survey to ensure that the terms were perceived as searches for high-risk ac-tivities and low-risk acac-tivities, respectively (Materials and Methods). To test the main hypothesis that higher inequality increases risk taking, we compared estimates of risk taking with measures of economic inequality across states. First, we examined the as-sociation between the risk-taking index and Gini statistics for each state. As displayed in Fig. 5A, states with higher Gini co-efficients tended to have higher values on the risk index,r=0.57, P<0.001. This association remained significant when controlling for median income in a regression analysis,β=0.49,t=4.30,P< 0.001. Inequality also tends to be higher in states with larger populations, r=0.52, and greater population density,r=0.36. To control for these factors, we included population and density (population per square mile) as control variables. The associa-tion between the Gini coefficient and risk taking remained sig-nificant, β = 0.40, t = 2.42, P = 0.02 (see SI Appendix for complete regression tables).
The Gini coefficient does not distinguish between inequality driven by greater wealth among the wealthy versus inequality driven by greater poverty among the poor. Our hypothesis that upward social comparisons motivate more risky behaviors than downward social comparisons suggests that inequality at the top of the distribution will predict risky searches better than in-equality at the bottom of the distribution. We examined the ratio between income at the 90th percentile and the 50th percentile to estimate the contribution of inequality at the top of the distri-bution. To estimate the contribution of inequality at the low end
of the distribution, we examined the ratio between the 50th percentile and the 10th percentile. As displayed in Fig. 5, the risk index was significantly associated with the 90/50 ratio,r=0.57, P<0.001 (Fig. 5B), but was not significantly associated with the 50/10 ratio,r=0.24,P=0.09 (Fig. 5C). When both ratios were entered in a regression model to estimate their unique contri-butions, the 90/50 ratio was a significant predictor,β=0.74,t= 4.63,P<0.001, and the 50/10 ratio was not,β=–0.25,t=1.60, P=0.12. The 90/50 ratio remained a significant predictor when population and population density were included as covariates,
β=0.88,t=4.97,P<0.001.
An alternative explanation for these associations is that in-equality encourages people to focus on gaining money in general but not to use more risky strategies. Contrary to that explanation, higher Gini coefficients were associated with fewer low-risk searches,r=–0.47,P<0.001. The 90/50 ratio was also associ-ated with fewer low-risk searches, r = –0.53, P < 0.001. When median income, population, and population density were included as controls, the 90/50 ratio remained significant, β=–0.63,t = 3.51,P=0.001, but Gini did not,β=–0.32,t=1.72,P=0.09 (see
SI Appendixfor full models). The relationship between inequality and risk taking cannot be explained by greater interest in financial gain in general. Rather, inequality appears to be linked specifically to high-risk, high-reward searches.
The social comparison mechanism posited by our account requires that people must have some awareness of the inequality around them. Although people cannot directly observe other people’s bank balances, people often signal their wealth using status goods, which display wealth and status to others (also called positional goods or conspicuous consumption) (30–32). To test whether the visibility of status goods links income in-equality to risk taking, we estimated the prevalence of status goods in each state. We used data from previous research that found that states with higher inequality generated more Google searches for status goods (33). We used the published survey data to identify search terms for goods that most reliably com-municated status, and we created an index of 10 search terms for status goods. If the prevalence of status goods signals inequality that enables social comparison, then searches for status goods should account for some of the shared variance between in-equality and risk taking. We used bootstrapping to test whether the association between inequality and risk taking was statisti-cally mediated by the prevalence of status goods.
We estimated a model using the Gini coefficient to measure inequality and included median income, population, and pop-ulation density as covariates. Replicating prior research (33), we found that inequality was associated with more searches for status goods,B=0.65,SEB=0.11,P<0.001 (see Fig. 6). Status goods searches were, in turn, associated with more risky searches,B= 0.84,SEB=0.18,P<0.001. The indirect effect of inequality on risky searches via status goods was significant,B=0.55,SEB=0.15,
-2.0 -1.0 0.0 1.0 2.0
0.38 0.43 0.48 0.53
Risk I
ndex
(z
)
Inequality (Gini)
-2.0 -1.0 0.0 1.0 2.0
2.00 2.50 3.00 3.50
Risk I
ndex
(z
)
Inequality (90/50)
-2.0 -1.0 0.0 1.0 2.0
3.00 3.50 4.00 4.50 5.00 5.50
Risk I
ndex
(z
)
Inequality (50/10)
A
B
C
95% CI=0.31, 0.94. After accounting for the indirect path, the direct path from inequality to risk taking was no longer significant, B=–0.22,SEB =0.18, P= 0.23. Results are the same if the 90/50 ratio is used rather than Gini coefficient (seeSI Appendixfor complete analyses). Although these data are correlational, the pattern is consistent with the hypothesis that displays of status goods mediate the association between inequality and risk taking. This suggests that the perception of inequality is critical, consistent with the social comparison account.
Discussion
Our results suggest that inequality increases risk taking because individuals selectively make upward social comparisons. As a result, higher inequality has the same behavioral effects as if everyone else were earning more. Such upward comparisons increase perceived needs, and people are willing to take greater risks to meet those needs. These findings shed light on a pathway by which macroeconomic inequality may affect the behaviors and outcomes of individuals.
This evidence suggests that inequality in an income distribu-tion (i.e., variance) can influence risky behavior independent of one’s own resources and relative standing. Risky behaviors such as crime and gambling have long been associated with poverty and relative deprivation. However, epidemiological evidence suggests that even after controlling for individual resources, places with more unequal distributions also have poorer eco-nomic, health, and social outcomes (2–7). Our findings suggest that the effects of inequality reflect not only structural economic forces but also behavioral responses to unequal economic con-texts. An implication of these findings is that high-inequality contexts may breed inequality in outcomes, as choosing high-risk options will lead to large gains for a few individuals but losses for most. This may provide a mechanism by which in-equality becomes self-perpetuating.
Upward comparisons may occur either by direct comparisons to the very rich or by indirect comparisons, as in“expenditure cascades.” Frank (34) has argued that people compare them-selves to those adjacent to them in social position. When the extremely rich become wealthier, the“merely rich”may feel less satisfied and increase their consumption. The middle class then follows suit and so on. Consistent with the cascade interpreta-tion, some research suggests that people prefer to compare themselves to others who are similar to them (28). However, these studies rely largely on self-reports about whom respon-dents compare themselves with, and they may reflect lay theories about social comparison. Experimental studies that present re-spondents with extreme comparison standards (e.g., Michael Jordan for the dimension of athletic ability; models for attrac-tiveness) find that such extreme comparisons lower participants’ satisfaction with their own status on those dimensions (35–37). Future research should investigate whether the effects of in-equality on risk taking are driven by direct comparisons to the extremely rich or by indirect cascades of social comparisons.
Our studies focused on financial risk taking, which may be re-lated to economic outcomes such as crime, gambling, and debt. Other outcomes associated with inequality, such as health prob-lems, may be linked to risky health behaviors such as smoking, substance use, and unhealthy eating. Behavioral decisions in these
domains pit hedonic rewards against long-term health risks (38). Health-risk behavior may be linked to economic inequality through at least two routes. First, risk-taking across different do-mains tends to be positively correlated (39). Inequality could in-fluence multiple outcomes through a general“syndrome”of risky behavior across domains. Alternatively, inequality may affect dis-tinct domains of risk via separate pathways. For instance, the display of status goods may affect people’s comparison standards for how much pleasure other people experience. If so, upward comparison on hedonic experience may lead to increased risk taking related to hedonic experiences, such as substance use or unhealthy foods. Future research should examine the mechanisms linking inequality to nonmonetary risk taking.
Income inequality has been rising in many advanced market economies for decades. Globally, the wealthiest 1% own nearly as much as the poorest 99% (40). In America, the wealthiest 0.1% of Americans control as much wealth as the bottom 90% (1). The strong associations between income inequality and poor outcomes raise fundamental questions about the relationship between economic systems and the well-being of individuals in those systems. Our research suggests that risky decision making may be one pathway by which inequality affects outcomes. Rising inequality may change what individuals consider to be enough, and therefore the risks they are willing to take to gain more.
Materials and Methods
Participants for studies 1–3 were recruited using Amazon Mechanical Turk, and the experimental tasks were completed online. Minimum sample sizes for each experiment were set atn=100 per between-subjects condition. This provides high power (0.89) assuming a“medium”-sized effect (d=0.5) and adequate power (0.74) assuming a “small” effect (d = 0.25) for between-groups comparisons. The same sample size in study 2 provides high power (0.99) for within-subjects comparisons assuming a“small”effect. All experiments were approved by the Internal Review Board (IRB) at the Uni-versity of North Carolina at Chapel Hill. Before participating, all subjects documented their consent using an online consent form approved by the IRB.
Study 1.The gambling task instructions were used to manipulate inequality. The instructions read,“The game is called the Decision Game. You will win money based on the decisions you make in this game. Many people have played the Decision Game and the computer program automatically updates the outcomes of the game as people play.”The distribution displaying in-equality was presented both in text and a bar graph (see Fig. 1).
In the pilot study, we measured perceived inequality using three items: “Does the top 1/3 of previous players have a lot more, slightly more, or no more money than the other players?”Ratings were made on a 5-point scale from 1 (no more) to 5 (a lot more).“Does the bottom 1/3 of previous players have a lot less, slightly less, or no less money than the other players?”(1=no less; 5=a lot less; reverse scored). “How unequal are the past players’ outcomes in the game?”(1=not at all unequal; 5=extremely unequal). We measured subjective relative deprivation using four items from a published measure of subjective relative deprivation (19) (e.g.,“I feel dissatisfied with what I have compared with what previous players have”). The wording was modified to refer to other players in the game rather than people in general.
Study 1 measured perceived need by asking, “What is the minimum amount of money you would need to win in order to feel satisfied with your performance in the Decision Game?”Responses could range from $0.00 to $2.50. We also measured perceived aspirations using the item,“What is the highest amount of money you realistically hope to win in the Decision Game?”The results using the perceived need item are reported here, but results are unchanged if both need and aspirations are averaged together into a composite.
The following three lotteries were used to measure risk taking in study 1. Lottery1:
1) 5% chance of winning $3.00/95% chance of winning $0.00;
2) 35% chance of winning $0.43/65% chance of winning $0.00;
3) 50% chance of winning $0.30/50% chance of winning $0.00;
4) 65% chance of winning $0.23/35% chance of winning $0.00;
5) 95% chance of winning $0.16/5% chance of winning $0.00.
Gini Risk index
Status goods
B = .55* (-.22)
Fig. 6. Association between inequality and risk-related searches is medi-ated by searches for status goods.
PSYCHOL
OGICAL
AND
COGN
ITIVE
SC
Lottery2:
1) 20% chance of winning $1.00/80% chance of winning $0.00;
2) 40% chance of winning $0.50/60% chance of winning $0.00;
3) 50% chance of winning $0.40/50% chance of winning $0.00;
4) 60% chance of winning $0.33/40% chance of winning $0.00;
5) 80% chance of winning $0.25/20% chance of winning $0.00.
Lottery3:
1) 10% chance of winning $2.50/90% chance of winning $0.00;
2) 30% chance of winning $0.83/70% chance of winning $0.00;
3) 50% chance of winning $0.50/50% chance of winning $0.00;
4) 70% chance of winning $0.36/30% chance of winning $0.00;
5) 90% chance of winning $0.28/10% chance of winning $0.00.
Study 2.Subjects in study 2 played 30 lotteries and were told that their payment would be based on one randomly selected game. The degree of inequality in the outcomes for each game was manipulated by displaying a bar graph. The three levels of inequality (10 trials each) were varied from trial to trial in a randomly ordered sequence. The gambling decision was indicated by sliding a cursor scale along a line in which the left side was labeled low risk/ low reward, and the right side was labeled high risk/high reward.
Study 3.Subjects in study 3 completed the same repeated-measures gambling task as in study 2. In a first block of 10 gambles, they saw only the middle bar of the earnings distribution and chose whether they wished to see the top or bottom bar. Distributions in this block were not symmetrical, so that subjects could not guess the height of one hidden bar from the height of the revealed bar. In a second block of 10 gambles, participants saw the full distributions, with either a high-inequality or low-inequality symmetrical distribution on each trial.
Study 4.Data for study 4 search queries were downloaded from Google Trends (https://www.google.com/trends/correlate). Gini data and control variables for each state were obtained from the US Census Bureau’s Amer-ican Community Survey (ACS). The 90/50 and 50/10 ratios were constructed by E. C. Truesdale and J. L. Herrera from census data using ACS based on averages from 2010 to 2014. Data on lottery sales by state in 2015 were obtained from the North American Association of State and Provincial Lot-teries (https://www.statista.com/statistics/388238/sales-of-lotteries-by-state-us/). Data for status goods searches are from Walasek and Brown (33). All data in Study 4 are publicly available aggregate state-level data with no personally identifying information. Subjects in their survey judged a series of search terms for how clearly they conveyed status using“yes,” “no,”and“don’t know” options. We used the 10 unique search terms that received the most“yes” responses. The terms were“designer rain boots,” “Ralph Lauren,” “fur vests,” “David Yurman rings,” “seersucker blazer,” “navy blazer,” “St Thomas Ritz,” “well appointed house,” “bass loafers,”and“brown suede.”For redundant terms (e.g.,“Ralph Lauren”and“Ralph Lauren men’s”), only the most general (e.g.,“Ralph Lauren”) was retained.
To estimate financial risk taking, we first generated four a priori search terms deemed to reflect efforts to make money or acquire goods without regard for risk or loss:“pay day loans,” “lottery,” “win money,”and“no down payment.”Next, to control for the possibility that these search terms reflect searching for money-related websites regardless of risk, we de-veloped a list of nonrisky money-related terms: “savings,” “invest,” “ re-tirement account,”and“pay off debt.”The search lists were validated by an independent sample of raters naïve to the hypothesis (see SI Appendix, Supplementary Materials S1).
ACKNOWLEDGMENTS.We thank E. C. Truesdale and J. L. Herrera for sharing data for the 90/50 and 50/10 ratios. This research was funded by a Spencer Foundation grant (to B.K.P.).
1. Saez E, Zucman G (2016) Wealth inequality in the United States since 1913: Evidence from capitalized income tax data.Q J Econ131:519–578.
2. Choe J (2008) Income inequality and crime in the United States.Econ Lett101:31–33. 3. Freund E, Morris I (2006) Gambling and income inequality in the states.Policy Stud J
34:265–276.
4. Frank R (2013)Falling Behind: How Rising Inequality Harms the Middle Class(Univ of California Press, Berkeley, CA).
5. Kawachi I, Subramanian SV (2014) Income inequality.Social Epidemiology, eds Berkman LF, Kawachi I, Glymour M (Oxford Univ Press, New York), 126–152. 6. Marmot MG, Sapolsky R (2014) Of baboons and men: Social circumstances, biology,
and the social gradient in health.Sociality, Hierarchy, Health: Comparative Biodemography: Papers from a Workshop, eds Weinstien M, Lane M (National Academy of Sciences, Washington, DC), pp 365–388.
7. Pickett KE, Wilkinson RG (2015) Income inequality and health: A causal review.Soc Sci Med128:316–326.
8. Festinger L (1954) A theory of social comparison processes.Hum Relat7:117–140. 9. Fiske ST (2010) Envy up, scorn down: How comparison divides us.Am Psychol65:
698–706.
10. Duesenberry J (1949)Income, Saving, and the Theory of Consumer Behavior(Harvard Univ Press, Cambridge, MA).
11. Brown G, Gardner J, Oswald A, Qian J (2008) Does wage rank affect employees’well‐ being?Ind Relat47:355–389.
12. Luttmer E (2005) Neighbors as negatives: Relative earnings and well-being.Q J Econ
120:963–1002.
13. Clark A, Oswald A (1996) Satisfaction and comparison income.J Public Econ61: 359–381.
14. Brown D, Ferris D, Heller D, Keeping L (2007) Antecedents and consequences of the frequency of upward and downward social comparisons at work.Organ Behav Hum Decis Process102:59–75.
15. Stephens DW, Krebs JR (1986)Foraging Theory(Princeton Univ Press, Princeton, NJ). 16. Caraco T, Martindale S, Whittam T (1980) An empirical demonstration of risk-sensitive
foraging preferences.Anim Behav28:820–830.
17. Mishra S, Fiddick L (2012) Beyond gains and losses: The effect of need on risky choice in framed decisions.J Pers Soc Psychol102:1136–1147.
18. Mishra S, Lalumière M (2010) You can’t always get what you want: The motivational effect of need on risk-sensitive decision-making.J Exp Soc Psychol46:605–611. 19. Pietras CJ, Hackenberc TD (2001) Risk-sensitive choice in humans as a function of an
earnings budget.J Exp Anal Behav76:1–19.
20. Gonzales J, Mishra S, Camp R (2016) For the win: Risk‐sensitive decision‐making in teams.J Behav Decis Making, 10.1002/bdm.1965.
21. Dohmen T, et al. (2011) Individual risk attitudes: Measurement, determinants, and behavioral consequences.J Eur Econ Assoc9:522–550.
22. Guiso L, Paiella M (2008) Risk aversion, wealth, and background risk.J Eur Econ Assoc
6:1109–1150.
23. Haisley E, Mostafa R, Loewenstein G (2008) Subjective relative income and lottery ticket purchases.J Behav Decis Making21:283–295.
24. Mishra S, Hing L, Lalumiere M (2015) Inequality and risk-taking.Evol Psychol13:1–11. 25. Callan MJ, Shead NW, Olson JM (2011) Personal relative deprivation, delay
dis-counting, and gambling.J Pers Soc Psychol101:955–973.
26. Boyce CJ, Brown GD, Moore SC (2010) Money and happiness: Rank of income, not income, affects life satisfaction.Psychol Sci21:471–475.
27. Ferrer-i-Carbonell A (2005) Income and well-being: An empirical analysis of the comparison income effect.J Public Econ89:997–1019.
28. Wheeler L (1966) Motivation as a determinant of upward comparison.J Exp Soc Psychol1:27–31.
29. Kuziemko I, Buell R, Reich T, Norton M (2014)“Last-place aversion”: Evidence and redistributive implications.Q J Econ129:105–149.
30. Frank R (2005) Positional externalities cause large and preventable welfare losses.Am Econ Rev95:137–141.
31. Hirsch F (1976)Social Limits to Growth(Harvard Univ Press, Cambridge, MA). 32. Veblen T (1899)The Theory of the Leisure Class(Macmillan, New York).
33. Walasek L, Brown GD (2015) Income inequality and status seeking: Searching for positional goods in unequal U.S. States.Psychol Sci26:527–533.
34. Frank R, Levine A, Dijk O (2014) Expenditure cascades.Rev Behavioral Economics1: 55–73.
35. Gilbert DT, Giesler RB, Morris KA (1995) When comparisons arise.J Pers Soc Psychol
69:227–236.
36. Morse S, Gergen KJ (1970) Social comparison, self-consistency, and the concept of self.
J Pers Soc Psychol16:148–156.
37. Mussweiler T, Rüter K, Epstude K (2004) The man who wasn’t there: Subliminal social comparison standards influence self-evaluation.J Exp Soc Psychol40:689–696. 38. Volkow ND, Wise RA (2005) How can drug addiction help us understand obesity?Nat
Neurosci8:555–560.
39. Zuckerman M, Kuhlman DM (2000) Personality and risk-taking: Common biosocial factors.J Pers68:999–1029.