Original
research
n
Breast Imag
Hui Li, PhD Yitan Zhu, PhD
Elizabeth S. Burnside, MD, MPH, MS Karen Drukker, PhD, MBA
Katherine A. Hoadley, PhD Cheng Fan, MS Suzanne D. Conzen, MD Gary J. Whitman, MD Elizabeth J. Sutton, MD Jose M. Net, MD Marie Ganott, MD Erich Huang, PhD Elizabeth A. Morris, MD Charles M. Perou, PhD Yuan Ji, PhD
Maryellen L. Giger, PhD
1 From the Depts of Radiology (H.L., K.D., M.L.G.) and Public Health Sciences (Y.J.), The Univ of Chicago, 5841 S Maryland Ave, MC 2026, Chicago, IL 60637; Program of Computational Genomics & Medicine, NorthShore Univ HealthSystem, Evanston, Ill (Y.Z., Y.J.); Dept of Radiology, Univ of Wisconsin– Madison, Madison, Wis (E.S.B.); Lineberger Comprehensive Cancer Ctr, Univ of North Carolina, Chapel Hill, NC (K.A.H., C.F., C.M.P.); Dept of Medicine, Section of Hematology & Oncology, The Univ of Chicago, Chicago, Ill (S.D.C.); Dept of Diagnostic Radiology, The Univ of Texas MD Anderson Cancer Ctr, Hous-ton, Tex (G.J.W.); Dept of Radiology, Memorial Sloan-Kettering Cancer Ctr, New York, NY (E.J.S., E.A.M.); Dept of Radiology, Univ of Miami Sylvester Comprehensive Cancer Ctr, Miami, Fla (J.M.N.); Dept of Radiology, Univ of Pittsburgh Medical Ctr, Pittsburgh, Pa (M.G.); and Div of Cancer Treatment and Diagnosis, National Cancer Inst, Biometric Research Branch, Bethesda, Md (E.H.). Received Sept 25, 2015; revision re-quested Nov 30; revision received Feb 12, 2016; accepted Mar 3; final version accepted Mar 9. Address correspondence to
M.L.G. (e-mail: [email protected]).
Supported by the National Cancer Institute (U01-CA195564, P30-CA14599, P50-CA58223, and U24-CA143848-05); a Breast Cancer Research Foundation grant; and The Univ of Chicago Pritzker School of Medicine Dean Bridge Fund.
H.L. and Y.Z. contributed equally to this work.
q RSNA, 2016
Purpose: To investigate relationships between computer-extracted breast magnetic resonance (MR) imaging phenotypes with multigene assays of MammaPrint, Oncotype DX, and PAM50 to assess the role of radiomics in evaluating the risk of breast cancer recurrence.
Materials and Methods:
Analysis was conducted on an institutional review board–ap-proved retrospective data set of 84 deidentified, multi-insti-tutional breast MR examinations from the National Cancer Institute Cancer Imaging Archive, along with clinical, histopath-ologic, and genomic data from The Cancer Genome Atlas. The data set of biopsy-proven invasive breast cancers included 74 (88%) ductal, eight (10%) lobular, and two (2%) mixed can-cers. Of these, 73 (87%) were estrogen receptor positive, 67 (80%) were progesterone receptor positive, and 19 (23%) were human epidermal growth factor receptor 2 positive. For each case, computerized radiomics of the MR images yielded computer-extracted tumor phenotypes of size, shape, margin morphology, enhancement texture, and kinetic assessment. Regression and receiver operating characteristic analysis were conducted to assess the predictive ability of the MR radiomics features relative to the multigene assay classifications.
Results: Multiple linear regression analyses demonstrated significant as-sociations (R2 = 0.25–0.32, r = 0.5–0.56, P , .0001) between
radiomics signatures and multigene assay recurrence scores. Important radiomics features included tumor size and enhance-ment texture, which indicated tumor heterogeneity. Use of ra-diomics in the task of distinguishing between good and poor prognosis yielded area under the receiver operating character-istic curve values of 0.88 (standard error, 0.05), 0.76 (standard error, 0.06), 0.68 (standard error, 0.08), and 0.55 (standard error, 0.09) for MammaPrint, Oncotype DX, PAM50 risk of relapse based on subtype, and PAM50 risk of relapse based on subtype and proliferation, respectively, with all but the latter showing statistical difference from chance.
Conclusion: Quantitative breast MR imaging radiomics shows promise for image-based phenotyping in assessing the risk of breast cancer recurrence.
q RSNA, 2016
Online supplemental material is available for this article.
signatures for Predicting the
risk of Breast cancer recurrence
as given by research Versions
of MammaPrint, Oncotype DX,
Breast Invasive Carcinoma and TCIA initiatives according to institutional review board–approved, Health In-surance Portability and Accountabil-ity Act–compliant protocols. Analyses were conducted on deidentified data only. Thus, patient selection basically included all cases available through the TCGA TCIA repository. Although this data set of MR images is not state of the art in terms current clinical pro-tocols, it is unique in that by being part of the TCGA, assessment rela-tive to gene assays and other genomic analyses is possible, which is not read-ily available in current clinical radiol-ogy departments.
At the time of our study, only 108 cases of the entire TCGA breast cancer data set had breast MR images, which had been collected and made available
in the TCIA (http://www.cancerimaging
archive.net) (25). However, to minimize variations in image quality across the multi-institutional cases, in our analysis, we included only breast MR imaging studies acquired with 1.5-T GE Medical Methods for computer-aided
di-agnosis and quantitative characteriza-tion—that is, image-based tumor phe-notyping—of cancers on breast images (obtained with mammography, ultra-sonography, and magnetic resonance [MR] imaging) have been in develop-ment for decades (10–12) and have recently received a renewed interest with the expansion beyond detection and diagnosis. Image-based tumor phe-notypes by using computer vision tech-niques are being evaluated in terms of their relationship to breast cancer in-vasiveness, stage, lymph node involve-ment, molecular subtypes (11–18), and genomics (19–23).
Researchers involved with The Can-cer Genome Atlas (TCGA) have dem-onstrated the role of gene expression profiles in characterizing TCGA breast cancer (24). In addition, the National Cancer Institute started collecting the corresponding MR imaging data for some TCGA tumors and having the data stored within The Cancer Imaging Archive (TCIA) (25). The purpose of our study was to investigate the rela-tionships between breast MR comput-er-extracted image phenotypes (CEIPs) with gene expression assays of Mam-maPrint, Oncotype DX, and PAM50 to assess the potential role of MR imag-ing radiomics in evaluatimag-ing the risk of breast cancer recurrence.
Materials and Methods
Study Population and MR Images
Patient data were obtained from the National Cancer Institute TCGA
Published online before print
10.1148/radiol.2016152110 Content codes: Radiology 2016;281:382–391
Abbreviations:
CEIP = computer-extracted image phenotypes ER = estrogen receptor
HER2 = human epidermal growth factor receptor 2 PR = progesterone receptor
ROC = receiver operating characteristic
ROR-P = risk of relapse based on subtype and proliferation ROR-S = risk of relapse based on subtype
TCGA = The Cancer Genome Atlas TCIA = The Cancer Imaging Archive
Author contributions:
Guarantors of integrity of entire study, H.L., M.L.G.; study concepts/study design or data acquisition or data analysis/ interpretation, all authors; manuscript drafting or manu-script revision for important intellectual content, all authors; approval of final version of submitted manuscript, all au-thors; agrees to ensure any questions related to the work are appropriately resolved, all authors; literature research, H.L., E.J.S., J.M.N., E.A.M., M.L.G.; clinical studies, E.S.B., G.J.W., J.M.N., M.G., E.A.M.; experimental studies, H.L., K.D., G.J.W., E.J.S., C.M.P., M.L.G.; statistical analysis, H.L., Y.Z., E.S.B., K.D., K.A.H., C.F., E.H., C.M.P., Y.J., M.L.G.; and manuscript editing, H.L., Y.Z., E.S.B., K.D., K.A.H., S.D.C., G.J.W., E.J.S., J.M.N., M.G., E.H., E.A.M., C.M.P., Y.J., M.L.G.
Conflicts of interest are listed at the end of this article. Advances in Knowledge
n Regression models of MR
com-puter-extracted image phenotypes (CEIPs)—that is, breast MR im-aging radiomics—are significantly associated with breast cancer risk of recurrence as predicted with research-based multigene assays, including MammaPrint, Oncotype
DX, and PAM50 (R2 = 0.25–0.32,
r = 0.50–0.56, P, .0001);
impor-tant CEIPs included tumor size, as well as enhancement texture patterns that potentially indicate tumor heterogeneity.
n Use of radiomics in the task of
distinguishing between good and poor prognosis in terms of esti-mated risk of recurrence yielded area under the receiver oper-ating characteristic curve values of 0.88 (standard error, 0.05), 0.76 (standard error, 0.06), 0.68 (standard error, 0.08), and 0.55 (standard error, 0.09) for Mam-maPrint, Oncotype DX, PAM50 risk of relapse based on subtype, and PAM50 risk of relapse based on subtype and proliferation, respectively.
Implications for Patient Care
n Quantitative breast MR imaging
radiomics shows promise as a means for image-based tumor phenotyping in assessing the risk of breast cancer recurrence.
n Computerized MR imaging tumor
phenotyping may yield quantita-tive predicquantita-tive models of breast cancer for precision medicine and may potentially affect patient treatment strategy.
A
dvances in gene expressionyears; E.J.S., 4 years; J.M.N., 5 years; M.G., 29 years; and E.A.M., 25 years; the other five radiologists were nonau-thors). The tumor location was deter-mined by means of consensus by using the radiologist reviewer information. This location of the primary tumor in each MR examination was made avail-able in the subsequent computerized quantitative image analysis.
Recurrence Scores Obtained with Multigene Assays
The genomic-based scores for the mul-tigene assays that served as the refer-ence standards were determined at the University of North Carolina, which yielded “research-based” MammaP-rint, Oncotype DX, and PAM50 assays (Table 1). It is important to note that for these TCGA samples, the clinical assay results were not available—that is, only the “research-based” assay outputs were available. Each statisti-cal model as described in the original gene assay articles (3–9) was applied to the messenger RNA sequencing data to obtain research-based bioinfor-matics estimates of the risk of recur-rence scores. The assays were run on a set of 1030 tumors and 110 adjacent be downloaded and cited in future works
by using http://dx.doi.org/10.7937/K9/
TCIA.2014.8SIPIY6G. The mean age 6
standard deviation of the 84 patients was
53.6 years 6 11.6, and the range was
29–82 years.
For each examination, T1-weighted dynamic contrast material–enhanced MR images were analyzed for this study, in-cluding one unenhanced and three to five contrast-enhanced images obtained by using a T1-weighted three-dimension-al spoiled gradient-echo sequence with a gadolinium-based contrast agent (Om-niscan; Nycomed-Amersham, Princeton, NJ). In-plane resolution ranged from 0.53 to 0.86 mm, spacing between sec-tions ranged from 2 to 3 mm, flip angle
was 10°, acquisition matrix was 256 3
192, and temporal resolution was ap-proximately 110 seconds.
Images from each breast MR exam-ination were reviewed, and the lesion was located independently by three of 11 breast radiologists who were members of the TCGA Breast Phenotype Research Group by using ClearCanvas software (ClearCanvas, Toronto, Ontario, Cana-da) (26). The breast imaging experience of the 11 radiologists ranged from 4 to 29 years (E.S.B., 14 years; G.J.W., 25
Systems imaging units (Milwaukee, Wis).
Our database excluded 14 studies per-formed by using Siemens imaging units (Malvern, Pa) and one study performed by using a 3-T GE Medical Systems im-aging unit, thus resulting in a total of 93 cases. We then excluded cases that had missing images for the dynamic sequence (one patient) or that, at the time, did not have gene expression analysis findings available (eight patients). After adhering to these criteria, the study data set of 84 patients with invasive breast cancer was finalized, with MR imaging exami-nations conducted at four institutions: Memorial Sloan-Kettering Cancer
Cen-ter, Mayo Clinic, University of Pittsburg
Medical Center, and Roswell Park Can-cer Institute. The number of cases con-tributed by each institution, respectively, were nine (date range, 1999–2002), five (date range, 1999–2003), 46 (date range, 1999–2004), and 24 (date range, 1999–2002). The cancers included 74 ductal (88%), eight lobular (10%), and two mixed (2%) cancers. Of these, 73 (87%) were estrogen receptor (ER) pos-itive, 67 (80%) were progesterone re-ceptor (PR) positive, and 19 (23%) were human epidermal growth factor receptor 2 (HER2) positive. This set of images can
Table 1
Distribution of Cases in the Database: Tabulation of Receptor Status (ER, PR, and HER2), MammaPrint, Oncotype DX, and PAM50 Gene Assays of the Study Data Set
Gene Assay Test and Prognosis Total (%) ER Positive (%) ER Negative (%) PR Positive (%) PR Negative (%) HER2 Positive (%) HER2 Negative (%)
All cases … 87 (73/84) 13 (11/84) 80 (67/84) 20 (17/84) 23 (19/84) 77 (65/84)
MammaPrint
Good prognosis 83 (70/84) 98 (69/70) 1 (1/70) 90 (63/70) 10 (7/70) 20 (14/70) 80 (56/70)
Bad prognosis 17 (14/84) 28 (4/14) 71 (10/14) 28 (4/14) 71 (10/14) 36 (5/14) 64 (9/14)
Oncotype DX
Lowest tertile (lowest risk) 30 (25/84) 100 (25/25) 0 (0/25) 96 (24/25) 4 (1/25) 20 (5/25) 80 (20/25)
Middle tertile 38 (32/84) 100 (32/32) 0 (0/32) 97 (31/32) 3 (1/32) 9 (3/32) 91 (29/32)
Top tertile 32 (27/84) 59 (16/27) 41 (11/27) 44 (12/27) 56 (15/27) 41 (11/27) 59 (16/27)
PAM50 ROR-S
Low recurrence risk 62 (52/84) 100 (52/52) 0 (0/52) 94 (49/52) 6 (3/52) 17 (9/52) 83 (43/52)
Medium recurrence risk 20 (17/84) 94 (16/17) 6 (1/17) 82 (14/17) 18 (3/17) 18 (3/17) 82 (14/17)
High recurrence risk 18 (15/84) 33 (5/15) 67 (10/15) 27 (4/15) 73 (11/15) 47 (7/15) 53 (8/15)
PAM50 ROR-P
Low recurrence risk 40 (34/84) 100 (34/34) 0 (0/34) 97 (33/34) 3 (1/34) 24 (8/34) 76 (26/34)
Medium recurrence risk 44 (37/84) 89 (33/37) 11 (4/37) 81 (30/37) 19 (7/37) 16 (6/37) 84 (31/37)
High recurrence risk 15 (13/84) 46 (6/13) 54 (7/13) 31 (4/13) 69 (9/13) 38 (5/13) 62 (8/13)
By using techniques developed in prior studies, a total of 38 CEIPs of the breast tumors were extracted auto-matically in three dimensions from the segmented tumors on MR images to
de-scribe (a) size (linear size, volume, and
surface area), (b) shape (sphericity and
irregularity), (c) margin morphologic
appearance (margin sharpness, vari-ance of margin sharpness, and varivari-ance of radial gradient histogram, which is used to assess tumor spiculation)
(30), (d) enhancement texture
(calcu-lated on the first postcontrast images by using the gray-level co-occurrence matrix, yielding features of homoge-neity, entropy, gray-level dependence,
and local image variation [33,34]), (e)
kinetic curve assessment (based on the most enhancing voxels within a le-sion and including maximum contrast enhancement, time to peak, uptake rate, washout rate, curve shape index, enhancement at the first contrast-hanced time point, signal intensity en-hancement ratio, total rate variation, and normalized total rate variation
[32]), and (f) enhancement-variance
ki-netics (maximum variance of enhance-ment, time to peak, variance increase rate, and variance decrease rate [31]). Note that these 38 tumor phenotypes research versions of MammaPrint (3)
and Oncotype DX (5) were applied to the messenger RNA sequencing data as described previously (28), with the scaling exception used for Oncotype DX noted earlier.
Computerized Quantitative MR Image Analysis of the Tumors
Quantitative MR imaging radiomics analysis was conducted to yield the CEIPs (Fig 1). Note that we do not present here the details of the tech-nical and/or robustness aspects of the computer-extracted MR imag-ing phenotypes, as they have already been validated and reported through various peer-reviewed publications (29–34).
From the consensus location iden-tified by the radiologists, computer-ized three-dimensional tumor seg-mentation was conducted by yielding delineation of each primary breast tumor from the surrounding paren-chyma (29). Note that this automated segmentation technique has been used over the past 10 years on hun-dreds of breast lesions imaged with different MR imaging units, with re-sults comparable to radiologists’ de-lineations (29,34).
normal samples, and the results were extracted for the 84 samples used. The relationships between the different gene assays—that is, the correlations between the continuous output values from the different “research-based” gene assays (the “reference standards” in this study)—showed relatively high Spearman correlations (approximately 0.81–0.87). However, the categori-zation of these values into low-, me-dium-, or high-risk groups yielded con-flicting outputs from one of the three multigene tests (ie, Oncotype DX), most likely due to the application of the published assay thresholds based on quantitative real-time polymer-ase chain reaction on the messenger RNA sequencing expression data. Therefore, for this single assay, we simply put the patients into rank ex-pression order and created tertiles, and we used these as the low-, inter-mediate-, and high-risk categories. When done this way, the results of the research-based Oncotype DX assay were in much greater agreement with those of the other two, as has been shown previously (27).
Cancer subtypes were determined by using the PAM50 classifier (8). The training set used in the reference PAM50 algorithm had been composed of 50% ER-positive samples. In the TCGA data set, however, there were approximately 80% ER-positive sam-ples. To normalize the TCGA data sim-ilarly to the PAM50 training set, TCGA messenger RNA sequencing data were subsampled for a group of cases that were 50% ER positive (freeze date, September 7, 2012; including 157 ER-positive and 157 randomly selected ER-positive cases). The median gene expression value for the subset was determined and applied to the full TCGA data set prior to running the PAM50 algorithm (8). There were 55 luminal A cancers, 10 luminal B can-cers, five HER2-enriched cancan-cers, 10 basal-like cancers, and four normal-like cancers in this study. Both risk of relapse based on subtype (ROR-S) and risk of relapse based on subtype and proliferation (ROR-P) outputs from PAM50 were used for analysis. The
Figure 1
performance of each logistic regression classifier, receiver operating charac-teristic (ROC) analysis was conducted For each classification task, a
leave-one-case-out cross-validation analysis was conducted with logistic regression to obtain a classifier score for each case (tumor). Within each cross-vali-dation iteration, stepwise feature se-lection with the Wilks lambda crite-rion was conducted with subsequent logistic regression classifier fitting on these selected features. To assess the are all automatically extracted from the
MR imaging data. More details are lo-cated in Table E1 (online).
Association Analysis between MR imaging CEIPs and Multigene Assay Outputs from the Risk of Recurrence Models
By using the MR imaging CEIPs, we conducted multiple linear regression analysis with stepwise feature selec-tion by using the CEIPs as independent variables and the continuous values from the “research-based” MammaP-rint, Oncotype DX, PAM50 ROR-S, or PAM50 ROR-P as the response vari-able (35), with the analysis yielding
selected phenotypes. A P value of .05
was used as the significance level for the stepwise feature selection. The
Holm t test was applied to adjust
for multiple testing in the regression models (36). For comparison, univar-iate linear regression analyses were also performed between each individ-ual MR image–based phenotype and the risk of recurrence scores from the recurrence predictor models of Mam-maPrint, Oncotype DX, PAM50 ROR-S, and PAM50 ROR-P.
Pilot Analysis of the Predictive Ability of the MR Imaging–based Phenotypes for Risk of Recurrence
In clinical practice, distinguishing be-tween good and bad prognosis is of interest; thus, thresholding is con-ducted on the continuous values of the multigene-assay tests to yield an out-put of either good or bad prognosis. We assessed four binary classification tasks, each of which is used to predict good versus bad prognosis, by using cutoffs on the multigene test outputs
(Table 1)—that is, (a) good prognosis
versus bad prognosis as determined
by using a MammaPrint cutoff, (b)
low to medium risk of recurrence ver-sus high risk as determined by using
an Oncotype DX cutoff, (c) low to
me-dium risk of recurrence versus high risk as determined by using a PAM50
ROR-S cutoff, and (d) low to medium
risk of recurrence versus high risk as determined by using a PAM50 ROR-P cutoff.
Figure 2
Figure 2: Sagittal MR images in a case with a potentially good prognosis, a 75-year-old woman evaluated as having an ER-positive, PR-positive, HER2-negative, lymph node–negative, stage II in-vasive breast cancer. The luminal A case is shown, along with the three-dimensional computer seg-mentation (red overlay) of the primary tumor. The effective diameter, shape irregularity, heterogeneity in terms of entropy, and heterogeneity in terms of maximum correlation coefficient of this tumor are 16.8 mm, 0.438, 6.27, and 0.843, respec-tively, with ranges of 7.8–54.0 mm, 0.40–0.84, 6.00–6.59, and 0.646–0.925.
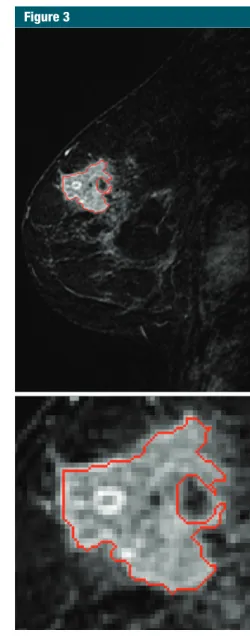
Figure 3
Positive correlation between the selected MR imaging phenotypes of size (effective diameter) and nega-tive correlation with enhancement texture (maximum correlation coeffi-cient) and increasing levels of risk of phenotype and the four risks of
re-currence scores are shown in Figure 4 . Some phenotypes correlate similarly (ie, similar color on the color scale) across the risk estimate models, while others do not.
(by using the semiparametric “proper” binormal ROC model [37–39]) with the classifier scores as the decision variable, with the area under the ROC curve serving as the figure of merit. All analysis routines were written in Mat-Lab (version 8.0, MathWorks, Natick, Mass).
Results
Figures 2 and 3 show examples of MR images in two cases: a case of a po-tentially good prognosis and a case of a potentially bad prognosis, along with the computer segmentations of the pri-mary tumors. An enlarged view of each tumor is also shown to demonstrate the heterogeneity of uptake values within the tumor. The corresponding CEIP characteristics are also given.
The multiple linear regression analyses demonstrated significant
as-sociations (R2 = 0.25–0.32, r = 0.50–
0.56, P , .0001) between selected
CEIP signatures and the multigene assay recurrence scores (Tables 2, 3 ). Key CEIPs from stepwise feature selection included tumor size and en-hancement texture, characterizing lesion heterogeneity. Overall, results from all four multiple linear regression analyses indicate that tumors with a high risk of recurrence tend to be larger and show more heterogeneous enhancement patterns.
A correlation heat map based on univariate linear regression analysis between each individual MR imaging
Table 2
Associations from Multiple Linear Regression Analysis between CEIPs and Risk of Recurrence Scores
Research Gene
Assay Goodness of Fit P Value
MammaPrint R 2 = 0.30, r = 0.55 ,.0001
Oncotype DX R 2 = 0.25, r = 0.5 ,.0001
PAM50 ROR-S R 2 = 0.32, r = 0.56 ,.0001
PAM50 ROR-P R 2 = 0.28, r = 0.53 ,.0001
Note.—R2 is the coefficient of determination, which
indicates how well the data fit a linear model, and r is
the correlation coefficient.
Figure 4
Figure 4: Color map shows the correlation of the MR imaging–based phenotypes with the recurrence pre-dictor models of MammoPrint, Oncotype DX, PAM50 ROR-S, and PAM50 ROR-P. For this color scale, yellow indicates higher correlation as compared with blue. The different gene assays (recurrence predictor models) serve as our “reference standard” in this study.
Table 3
Associations between CEIPs and Risk of Recurrence Scores according to the Multiple Linear Regression Model
Research Gene Assay and
Phenotypic Category Feature Regression Coefficient P Value
MammaPrint Constant 29.60 .0070
Enhancement texture Maximum correlation coefficient 3.14 .00021
Enhancement texture Sum average 0.22 .011
Size Effective diameter 20.020 .0019
Oncotype DX Constant 161.52 .00073
Kinetic curve assessment Maximum enhancement 10.30 .014
Enhancement texture Maximum correlation coefficient 2200.23 .0015
Size Effective diameter 1.89 .00030
PAM50 ROR-S Constant 491.36 .012
Enhancement texture Maximum correlation coefficient 2182.33 .00011
Enhancement texture Sum average 29.87 .039
Size Effective diameter 1.23 .00044
PAM50 ROR-P Constant 97.51 .0013
Kinetic curve assessment Uptake rate 384.68 .033
Enhancement texture Maximum correlation coefficient 2138.98 .00057
Size Effective diameter 1.35 ,.0001
Discussion
The association analysis between the CEIPs and the risk of recurrence scores from various gene-assay models yielded moderate correlations. The MR imag-ing phenotypes selected from multiple linear regression analyses were related to breast tumor size, enhancement tex-ture, and characteristics of the kinetic curve. Similar, negatively correlated relationships between the MR imag-ing phenotype of enhancement texture (maximum correlation coefficient) and the recurrence scores were observed across all four recurrence models. Since enhancement texture is calculated on the MR image acquired at the first postcontrast time point, these enhance-ment texture phenotypes quantitatively characterize the heterogeneous nature of contrast material uptake within the breast tumor. The smaller the enhance-ment texture, the more heterogeneous the tumor, which appears to indicate a higher risk of recurrence. Assessment of heterogeneity by using a noninva-sive method such as imaging may be important in the future as more target-able agents are used for treating breast cancer and in the neoadjuvant setting in monitoring treatment response. As we understand that breast cancers can be extremely heterogeneous, harbor-ing multiple driver mutations that may change over time, having a method to assess heterogeneity is likely use-ful. Assessment of heterogeneity may set prognostic expectations and affect treatment options.
Understanding the relationships be-tween gene expression profiles, imaging phenotypes, and outcomes like recur-rence risk has the potential to provide insights into the complex cancer biology at work in each individual patient. Cur-rently, gene expression profiles are in-creasingly helping to distinguish tumor types beyond features that are evident at conventional histopathologic exami-nation. In the future, CEIPs have the po-tential to compliment these expression profiles by demonstrating anatomic and functional characteristics that might improve prediction of recurrence or other important outcomes. Our finding (standard error, 0.06), 0.68 (standard
error, 0.08), and 0.55 (standard error, 0.09) for MammaPrint, Oncotype DX, PAM50 ROR-S, and PAM50 ROR-P, re-spectively, with all but the latter show-ing statistical difference from chance (Fig 6). Of note, we realize that the Oncotype DX gene assay is usually conducted clinically only in ER-positive cases, but the result shown here is for all cases used in this study.
recurrence for MammaPrint, Onco-type DX, PAM50 ROR-S, and PAM50 ROR-P were observed (Fig 5). Note that a low value of this enhancement texture feature infers a more hetero-geneous enhancement pattern.
Use of the CEIPs in the tasks of distinguishing between low to medium and high risk levels of recurrence yield-ed area under the ROC curve values of 0.88 (standard error, 0.05), 0.76
Figure 5
use the risk status for a given cancer as the surrogate marker. Also, cases used in this study were predetermined according to TCGA inclusion criteria. Most women in this study had core biopsy–proven invasive breast cancer before undergoing MR imaging exam-inations, which may confound our find-ings in this study in terms of hetero-geneity in enhancement pattern. Thus, the results in this study need further validation in a larger data set to bet-ter assess its potential clinical use in the future. Even with these limitations, the TCGA data set is currently still the largest publicly available data set for this radiomics research.
In conclusion, the results in this study indicate that quantitative MR imaging radiomics shows promise as a means for image-based phenotyping in assessing the risk of cancer recur-rence. Merging imaging phenotypes with genomic data in the future may lead to improved survival predictors. Such quantitative radiomic prognostic models of breast cancer may potentially be useful for precision medicine and af-fect patient treatment strategy.
Acknowledgments: The authors acknowledge the other members of the TCGA Breast Phe-notype Research group, including Li Lan, MS, Department of Radiology, The University of Chicago, Chicago, Ill; Margarita Zuley, MD, De-partment of Radiology, University of Pittsburgh Medical Center, Pittsburgh, Pa; Kathleen R. Brandt, MD, Department of Radiology, Mayo Clinic College of Medicine, Rochester, Minn; Ermelinda Bonaccio, MD, Department of Diag-nostic Radiology, Roswell Park Cancer Institute, Buffalo, NY; Arvind Rao, PhD, Department of Bioinformatics and Computational Biology, Uni-versity of Texas MD Anderson Cancer Center, Houston, Tex; and Carl Jaffe, MD, John B. Freymann, BA, and Justin Kirby, BS, National Cancer Institute, Biometric Research Branch, Division of Cancer Treatment and Diagnosis, Bethesda, Md.
Disclosures of Conflicts of Interest: H.L. Ac-tivities related to the present article: disclosed no relevant relationships. Activities not related to the present article: disclosed no relevant relationships. Other relationships: author re-ceives royalties from U.S. patent 9,208,556. Y.Z. disclosed no relevant relationships. E.S.B. disclosed no relevant relationships. K.D. dis-closed no relevant relationships. K.A.H. dis-closed no relevant relationships. C.F. disdis-closed no relevant relationships. S.D.C. disclosed no relevant relationships. G.J.W. disclosed no relevant relationships. E.J.S. disclosed no
expect similar results (3–9). Also, we only analyzed dynamic contrast-en-hanced MR images and not T2-weight-ed or diffusion-weightT2-weight-ed images. One would expect improved performance by using multiparametric breast MR images; thus, we will analyze those in the future. In addition, the MR im-ages used in this study were acquired from multiple institutions with vari-ous acquisition protocols. Given the improved MR imaging technology and standardized imaging acquisition pro-tocols, we would expect in the future to see even more association with risk of recurrence. Case composition, such as the distribution of ER-positive cases (87%) and ER-negative cases (13%), is different from the general clinical pop-ulation distribution, which is usually approximately a 2:1 ratio. In addition, there were many “good prognosis” cancer cases in the study. The ground truth used in this study was the esti-mated risk of recurrence instead of ac-tual survival information, as it was not available for the study. Thus, we had to that enhancement texture features are
consistently associated with recurrence score may indicate that internal tumor architecture, such as microvascular density (ie, tumor-related angiogene-sis) and/or central necrosis are playing a biological role that is important in re-currence. While strongly asserting this connection between gene expression and imaging demonstrates that a key to prognosis may be premature on the ba-sis of our current results, understanding these patterns holds promise for untan-gling how gene expression in concert with in vivo imaging features map to both biological molecular mechanisms and outcomes.
There are some limitations of this study, such as the small data set, since breast MR images are not available for most of the TCGA breast cancer cases. Another limitation was that the scores for risk of recurrence (Mam-maPrint, Oncotype DX, and PAM50) were obtained from research-based determinations and not from the ac-tual clinical tests, although one would
Figure 6
20. Huo Z, Giger ML, Olopade OI, et al. Com-puterized analysis of digitized mammograms of BRCA1 and BRCA2 gene mutation car-riers. Radiology 2002;225(2):519–526.
21. Li H, Giger ML, Lan L, et al. Computerized analysis of mammographic parenchymal patterns on a large clinical dataset of full-field digital mammograms: robustness study with two high-risk datasets. J Digit Imaging 2012;25(5):591–598.
22. Li H, Giger ML, Sun C, et al. Pilot study demonstrating potential association be-tween breast cancer image-based risk phe-notypes and genomic biomarkers. Med Phys 2014;41(3):031917.
23. Gierach GL, Li H, Loud JT, et al. Relation-ships between computer-extracted mam-mographic texture pattern features and BRCA1/2 mutation status: a cross-sectional study. Breast Cancer Res 2014;16(4):424.
24. Cancer Genome Atlas Network. Compre-hensive molecular portraits of human breast tumours. Nature 2012;490(7418):61–70.
25. Clark K, Vendt B, Smith K, et al. The Can-cer Imaging Archive (TCIA): maintaining and operating a public information reposi-tory. J Digit Imaging 2013;26(6):1045–1057.
26. Mongkolwat P, Kleper V, Talbot S, Rubin D. The National Cancer Informatics Pro-gram (NCIP) Annotation and Image Markup (AIM) Foundation model. J Digit Imaging 2014;27(6):692–701.
27. Fan C, Oh DS, Wessels L, et al. Concor-dance among gene-expression-based pre-dictors for breast cancer. N Engl J Med 2006;355(6):560–569.
28. Fan C, Prat A, Parker JS, et al. Building prognostic models for breast cancer pa-tients using clinical variables and hundreds of gene expression signatures. BMC Med Genomics 2011;4:3.
29. Chen W, Giger ML, Bick U. A fuzzy c-means (FCM)-based approach for computerized segmentation of breast lesions in dynamic contrast-enhanced MR images. Acad Radiol 2006;13(1):63–72.
30. Gilhuijs KGA, Giger ML, Bick U. Comput-erized analysis of breast lesions in three dimensions using dynamic magnetic-reso-nance imaging. Med Phys 1998;25(9):1647– 1654.
31. Chen W, Giger ML, Lan L, Bick U. Comput-erized interpretation of breast MRI: investi-gation of enhancement-variance dynamics. Med Phys 2004;31(5):1076–1082.
32. Chen W, Giger ML, Bick U, Newstead GM. Automatic identification and classification of characteristic kinetic curves of breast lesions 9. Prat A, Parker JS, Fan C, Perou CM. PAM50
assay and the three-gene model for identify-ing the major and clinically relevant molecular subtypes of breast cancer. Breast Cancer Res Treat 2012;135(1):301–306.
10. Giger ML. Update on the potential of com-puter-aided diagnosis for breast cancer. Fu-ture Oncol 2010;6(1):1–4.
11. Giger ML, Chan H-P, Boone J. Anniver-sary paper: history and status of CAD and quantitative image analysis: the role of medical physics and AAPM. Med Phys 2008;35(12):5799–5820.
12. Giger ML, Karssemeijer N, Schnabel JA. Breast image analysis for risk assessment, detection, diagnosis, and treatment of cancer. Annu Rev Biomed Eng 2013;15: 327–357.
13. Bhooshan N, Giger ML, Jansen SA, Li H, Lan L, Newstead GM. Cancerous breast lesions on dynamic contrast-enhanced MR images: computerized characterization for image-based prognostic markers. Radiology 2010;254(3):680–690.
14. Bhooshan N, Giger M, Edwards D, et al. Computerized three-class classification of MRI-based prognostic markers for breast cancer. Phys Med Biol 2011;56(18):5995– 6008.
15. Yang Q, Li L, Zhang J, Shao G, Zheng B. A computerized global MR image feature analysis scheme to assist diagnosis of breast cancer: a preliminary assessment. Eur J Ra-diol 2014;83(7):1086–1091.
16. Agner SC, Rosen MA, Englander S, et al. Computerized image analysis for identifying triple-negative breast cancers and differen-tiating them from other molecular subtypes of breast cancer on dynamic contrast-en-hanced MR images: a feasibility study. Radi-ology 2014;272(1):91–99.
17. Youk JH, Son EJ, Chung J, Kim JA, Kim EK. Triple-negative invasive breast cancer on dynamic contrast-enhanced and diffu-sion-weighted MR imaging: comparison with other breast cancer subtypes. Eur Ra-diol 2012;22(8):1724–1734.
18. Mazurowski MA, Zhang J, Grimm LJ, Yoon SC, Silber JI. Radiogenomic analysis of breast cancer: luminal B molecular subtype is associated with enhancement dynamics at MR imaging. Radiology 2014;273(2):365– 372.
19. Ashraf AB, Daye D, Gavenonis S, et al. Identification of intrinsic imaging pheno-types for breast cancer tumors: preliminary associations with gene expression profiles. Radiology 2014;272(2):374–384.
relevant relationships. J.M.N. disclosed no relevant relationships. M.G. disclosed no rel-evant relationships. E.H. disclosed no relrel-evant relationships. E.A.M. disclosed no relevant relationships. C.M.P. Activities related to the present article: disclosed no relevant relation-ships. Activities not related to the present ar-ticle: author receives payment from Bioclassi-fier for board membership and consultancy; author receives payments for PAM50 patents; author and institution receive royalties from Bioclassifier; author has stock or stock options in Bioclassifier. Other relationships: disclosed no relevant relationships. Y.J. disclosed no rel-evant relationships. M.L.G. Activities related to the present article: author received grants from P30 CA14599 and P50-CA58223. Activ-ities not related to the present article: author is a stockholder in R2 technology/Hologic; au-thor receives royalties from Hologic, GE Med-ical Systems, Median Technologies, Riverain Medical, Mitsubishi, and Toshiba; author is a cofounder and stockholder in Quantitative In-sights. Other relationships: disclosed no rele-vant relationships.
References
1. Osin P, Shipley J, Lu YJ, Crook T, Guster-son BA. Experimental pathology and breast cancer genetics: new technologies. Recent Results Cancer Res 1998;152:35–48.
2. Unger MA, Weber BL. Recent advances in breast cancer biology. Curr Opin Oncol 2000;12(6):521–525.
3. van ’t Veer LJ, Dai H, van de Vijver MJ, et al. Gene expression profiling predicts clinical outcome of breast cancer. Nature 2002;415 (6871):530–536.
4. van de Vijver MJ, He YD, van’t Veer LJ, et al. A gene-expression signature as a predic-tor of survival in breast cancer. N Engl J Med 2002;347(25):1999–2009.
5. Paik S, Shak S, Tang G, et al. A multigene assay to predict recurrence of tamoxifen-treated, node-negative breast cancer. N Engl J Med 2004;351(27):2817–2826. 6. Paik S, Tang G, Shak S, et al. Gene
expres-sion and benefit of chemotherapy in women with node-negative, estrogen receptor-posi-tive breast cancer. J Clin Oncol 2006;24(23): 3726–3734.
7. Cronin M, Sangli C, Liu M-L, et al. An-alytical validation of the Oncotype DX genomic diagnostic test for recurrence prognosis and therapeutic response pre-diction in node-negative, estrogen recep-tor-positive breast cancer. Clin Chem 2007;53(6):1084–1091.
on DCE-MRI. Med Phys 2006;33(8):2878– 2887.
33. Chen W, Giger ML, Li H, Bick U, Newstead GM. Volumetric texture analysis of breast lesions on contrast-enhanced magnetic res-onance images. Magn Reson Med 2007; 58(3):562–571.
34. Chen W, Giger ML, Newstead GM, et al. Comput erized assessment of breast lesion malignancy using DCE-MRI robustness study on two independent clinical datas-ets from two manufacturers. Acad Radiol 2010;17(7):822–829.
35. Draper NR, Smith H. Applied regression analysis. Hoboken, NJ: Wiley-Interscience, 1998; 307–312.
36. Holm S. A simple sequentially rejective mul-tiple test procedure. Scand J Stat 1979;6(2): 65–70.
37. Metz CE, Pan X. “Proper” binormal ROC curves: theory and maximum-likelihood es-timation. J Math Psychol 1999;43(1):1–33.
38. Pan X, Metz CE. The “proper” binormal model: parametric receiver operating characteristic curve estimation with
de-generate data. Acad Radiol 1997;4(5):380– 389.