Static and dynamic DNA loops form AP-1 bound
activation hubs during macrophage development
Douglas H Phanstiel1,2,3*, Kevin Van Bortle3*, Damek Spacek3, Gaelen T Hess3, Muhammad SaadShamim4,5,6, Ido Machol4,5,6, Michael I Love7,8, Erez Lieberman Aiden4,5,6, Michael C Bassik3, and Michael P Snyder3
1Department of Cell Biology and Physiology, 2Thurston Arthritis Research Center, University of North Carolina, Chapel Hill, NC 27599, USA. 3Department of Genetics, Stanford University, Stanford, CA 94305, USA. 4The Center for Genome
Architecture, Baylor College of Medicine, Houston, TX 77030, USA. 5Department of Molecular and Human Genetics, Baylor College of Medicine, Houston, TX 77030, USA. 6Department of Computer Science and Department of Computational and Applied Mathematics, Rice University, Houston, TX 77005, USA. 7Department of Biostatistics, 8Department of Genetics, University of North Carolina, Chapel Hill, NC 27599, USA. *Authors Contributed Equally
Running title: DNA loop-based regulation of human macrophage development
Key words: CTCF, AP-1,Hi-C, long-range interactions, DNA looping, cellular differentiation
Correspondence: [email protected](M.P.S.), [email protected] (D.H.P.)
SUMMARY
The three-dimensional arrangement of the human genome comprises a complex network of structural and regulatory chromatin loops important for coordinating changes in transcription during human development. To better understand the mechanisms underlying context-specific 3D chromatin structure and transcription during cellular differentiation, we generated comprehensive in situ Hi-C maps of DNA loops during human monocyte-to-macrophage differentiation. We demonstrate that dynamic looping events are regulatory rather than structural in nature and uncover widespread coordination of dynamic enhancer activity at preformed and acquired DNA loops. Enhancer-bound loop formation and enhancer-activation of preformed loops represent two distinct modes of regulation that together form multi-loop activation hubs at key macrophage genes. Activation hubs connect 3.4 enhancers per promoter and exhibit a strong enrichment for Activator Protein 1 (AP-1) binding events, suggesting multi-loop activation hubs driven by cell-type specific transcription factors may represent an important class of regulatory chromatin structures for the spatiotemporal control of transcription.
HIGHLIGHTS
• High resolution and high sensitivity of loop detection via deeply sequenced in situ Hi-C experiments during monocyte to macrophage differentiation (> 10 billion total reads)
• Multi-loop interaction communities identified surrounding key macrophage genes.
• Multi-loop communities connect dynamic enhancers through both static and newly acquired DNA loops, forming hubs of activation
INTRODUCTION
It is estimated that less than 2% of the human genome codes for functional proteins (Alexander et al., 2010). Scattered throughout the rest of the genome are regulatory regions that can exert control over genes hundreds of thousands of base pairs away through the formation of DNA loops. Loop-based transcriptional regulation plays a part in many biological contexts but is critically important for human development and cellular differentiation (Krijger and de Laat, 2016). Alteration of DNA loops has been implicated in a variety of developmental abnormalities and human diseases. Disruption of long-range interactions between Hoxd genes and dispersed enhancer-like sequences leads to abnormal digit morphology in the developing limb bud (Montavon et al., 2011) and deletion of loop anchor regions within the Hoxa and Hoxc clusters leads to homeotic transformations (Narendra et al., 2016) . Microdeletions affecting 3D chromatin structures and transcription of human oncogenes have been identified in many forms of cancer (Hnisz et al., 2016).
Structurally, DNA loops are controlled by both global and local genomic elements which establish a hierarchy of chromatin organization (Dekker et al., 2013). Typically acting in cis at distances no larger than 1-2 Mb, DNA loops are confined by structures known as topologically associating domains (TADs) which demarcate boundaries of hetero- and euchromatin (Dixon et al., 2012; Nora et al., 2012). TADs themselves are partitioned into two or more nuclear compartments of similar transcriptional activity (Imakaev et al., 2012; Lieberman-Aiden et al., 2009). At a local level, loops are controlled by proteins including CCCTC-binding factor (CTCF) and members of the cohesin complex, both of which are highly enriched at loop anchors, as well as cohesin loaders and unloaders (Busslinger et al., 2017; Haarhuis et al., 2017; Heidari et al., 2014; Rao et al., 2014; Sofueva et al., 2013). While our knowledge regarding the general characteristics and mechanisms of loops is improving, much less is known regarding the scope, mechanisms, and functional significance of dynamic looping events during biological processes such as cellular differentiation.
Rapidly evolving DNA sequencing-based technologies have provided increasingly comprehensive views of DNA looping in human cells and are improving our ability to address these salient questions. At their core, all of these technologies apply the same basic paradigm: DNA-DNA interactions are fixed using chemical cross-linking, fragmented by physical or enzymatic methods, and ligated together forming chimeric DNA sequences harboring DNA from each of the two interacting regions. Frequencies of ligation serve as a proxy for in vivo interaction frequencies allowing for the inference of DNA loops, TADs, nuclear compartments, and other chromatin structures. There are a wide variety, and ever increasing, number of different variations on this approach; however, the current methodologies can be classified into two categories; genome-wide and targeted (Davies et al., 2017). Hi-C is a genome-wide approach to detect contact frequencies between all mappable regions of the human genome. Application of this approach has revealed extensive chromatin reorganization, both within stable chromatin domains and in higher order compartment localization, during ES cell differentiation and across human tissues and cell-types (Dixon et al., 2015; Schmitt et al., 2016). However, the sequencing depth required to achieve high resolution maps of contact frequency as well as the high number of nonspecific ligation events have made the identification of loops using Hi-C problematic.
approach capable of investigating interactions between genomic regions bound by specific proteins, further provides examples of dynamic enhancer and promoter interactions between ES cells and differentiated B lymphocytes (Kieffer-Kwon et al., 2013). Although these studies suggest that differentiation-associated activation and repression of specific genes is accomplished through changes in chromatin architecture, such targeted approaches are unsuitable for identifying genome-wide intra-chromosomal interactions that are likely important for cellular differentiation. Moreover, by interrogating only small interspersed regions of the genome, approaches such as ChIA-PET, capture Hi-C, and HiChIP may not be able to distinguish differences in local chromatin compaction from true DNA loops (Rao et al., 2014).
The introduction of a new genome-wide approach, in situ Hi-C, in combination with the continually decreasing cost of genomic sequencing, has allowed for the unbiased genome-wide detection of DNA loops in human cells. Nuclear proximity ligation increases the efficiency of in situ Hi-C over previous “dilution” Hi-Hi-C protocols by reducing random ligation events, enabling higher resolution and detailed mapping of DNA loops at currently achievable sequencing depths. Importantly, the comprehensive nature of in situ Hi-C allows comparison of interaction frequencies to local backgrounds, something not possible with targeted methods like ChIA-PET, capture Hi-C, and HiChIP, producing quantifiable improvements in accuracy of loop detection (Rao et al., 2014). While multi-cell comparison of high resolution in situ Hi-C maps has identified thousands of DNA loops that are preserved across diverse cell types (Rao et al., 2014), examples of cell-type specific looping events also support a role for dynamic genome architecture regulating specific genes. However, this method has not been broadly applied to study dynamic looping in the context of human development and cellular differentiation.
Macrophages are phagocytic cells of the innate immune system that represent one of the body’s first defenses against invading pathogens. Macrophage-mediated inflammation has been identified as a key
driver of multiple human disorders and diseases including atherosclerosis, diabetes, and cancer (Chawla et al., 2011; Moore et al., 2013; Noy and Pollard, 2014; Ostuni et al., 2015). The differentiation of monocytic precursors into mature macrophages is well characterized and key transcriptional regulators of this process have been identified including SPI1, MAFB, and AP-1 (Kelly et al., 2000; Rosa et al., 2007; Valledor et al., 1998). However, the role of DNA looping in this process remains completely unexplored. Treatment of the monocytic leukemia cell line, THP-1, with phorbol myristate acetate (PMA), is a widely used model for studying monocyte-macrophage differentiation and provides an ideal system for studying the regulatory dynamics controlled via long-range interactions (Daigneault et al., 2010). First, THP-1 cells grow as a largely homogenous cell population with a near-diploid genetic background lacking major cytogenetic rearrangements typical of most established cell lines (Odero et al., 2000). Second, they exhibit high functional similarity to in vivo monocytes including the ability to differentiate into extremely pure populations of macrophages (Kouno et al., 2013). And finally, because these cells renew indefinitely, unlimited experiments can be performed on these same cells eliminating variability introduced by genetic differences.
Here, we apply in situ Hi-C in combination with other genomic methodologies to profile global changes in DNA looping events during the differentiation of human monocytes into macrophages. We show that the transcriptional dynamics of differentiating THP-1 cells are accompanied by significant changes in long-range DNA loops at key regulatory genes known to be important for macrophage development and function. Intersection with histone modification profiles reveals that transcriptional regulation is accompanied by both gained and pre-formed chromatin loops that acquire
enhancer activity during
results suggest that the formation of multi-loop activation hubs increases the local concentration of AP-1 and transcriptional activation machinery at the promoters of key regulatory genes promoting increased transcription during macrophage development. AP-1 activation hubs are similar in nature to specific, previously characterized multi-loop structures, such as the developmentally regulated beta globin locus, suggesting that activation hubs may represent a common mechanism for controlling the spatiotemporal expression of distinct regulatory genes important for other developmental contexts.
RESULTS
High resolution maps of DNA structure in human monocytes and macrophages
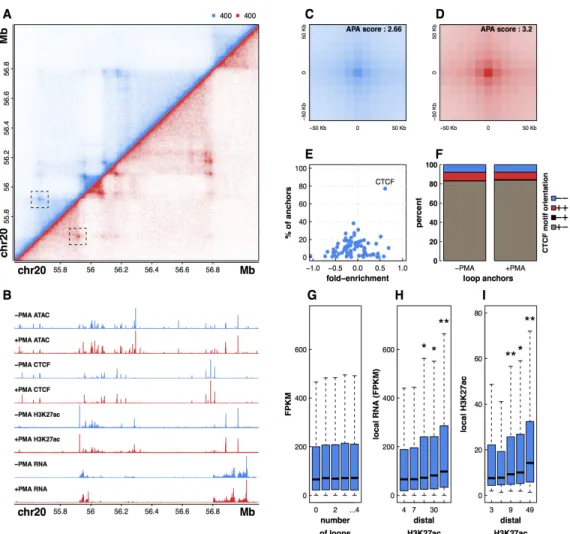
To determine how chromatin structure changes during cellular differentiation, we applied in situ Hi-C to THP-1 cells before and after exposure to PMA, generating high resolution genome-wide maps of DNA-DNA interaction frequencies in both THP-1 monocytes and THP-1 derived macrophages. Sequencing to a depth of greater than 5 billion reads per sample, we generated high quality normalized contact maps with a bin resolution of 10 kb (Fig. 1A). To better understand the nature of DNA looping during PMA-induced differentiation we generated quantitative data sets that mapped changes in transcript abundance (RNA-seq), chromatin accessibility (ATAC-seq), CTCF occupancy, and H3K27 acetylation levels (ChIP-seq), a histone modification associated with active enhancers (Fig. 1B; (Creyghton et al., 2010)). DNA loops were determined by identifying contact frequencies (pixels) that are significantly enriched compared to local background levels using a method developed by Rao et al (see supplemental methods; (Rao et al., 2014)). We identified 16067 and 16335 long-range interactions in untreated and treated THP-1 cells respectively (Tables S1,S2). Hi-C data sets were also processed by Juicer yielding very similar results (Fig. S1; (Durand et al., 2016)). Quality of loop calls can be
assessed by aggregating Hi-C signal in the pixels surrounding all detected loops using a method called Aggregate Peak Analysis (APA) (Rao et al., 2014)). High quality DNA loops calls are characterized by APA plots with intense center pixels surrounded by less intense pixels and these plots can be scored by dividing the value of the center pixel by the median of pixels in the bottom right quadrant. Application of the APA method to our loop calls for both untreated and treated cells revealed extremely high scoring APA plots (2.66 and 3.2) highlighting the accuracy of the loops detected (Fig. 1C-D).
To explore the regulatory nature of DNA looping in monocytes and macrophages we next intersected our loop calls with histone H3K27 acetylation signal and transcript abundance. Surprisingly, comparison of relative transcript level and the number of long-range interactions that a promoter is connected to reveals no significant relationship between gene activity and the number of DNA loops (Fig. 1G). However, we find that both transcription and local H3K27 acetylation levels are
significantly higher for regions that are connected to distal DNA elements with elevated H3K27 acetylation, implying active enhancer-gene interactions (Fig. 1H-I). Overall, this result suggests that the activity and chromatin context at distal regulatory element connections, rather than the mere presence or number of long-range interactions, is a major determinant of gene expression and perhaps an important element controlling dynamic transcription of
Figure 1: Integrative genomic profiling reveals principles of DNA looping in untreated and +PMA treated THP-1 cells. (A) Hi-C contact matrix depicting normalized contact frequencies between loci on chromosome 20 for untreated THP-1 cells (blue, top left) and PMA treated THP-1 cells (red, bottom right). One of the loops detected in both untreated
and treated cells is highlighted. (B) ATAC-seq, ChIP-seq, and RNA seq signal tracks corresponding to the Hi-C region
depicted above. APA plots showing aggregated signal across all loops in both untreated (C) and PMA treated THP-1
cells (D). (E) Enrichment of CTCF motifs in loop anchors of untreated THP-1 cells. (F) Stacked bar plot depicting CTCF motif orientations at loop anchors as a percentage of all loops that contain a single CTCF bound peak at each anchor.
(G) RNA FPKM values of genes binned by the number of loops that connect to their promoter. (H) RNA FPKM values of
genes binned by the histone H3K27 acetylation signal at the promoter-distal end of a loop. (I) H3K27 acetylation signal
regulatory genes during cellular differentiation.
Distal regulation of macrophage-specific transcription is associated with both dynamic and pre-formed DNA loops
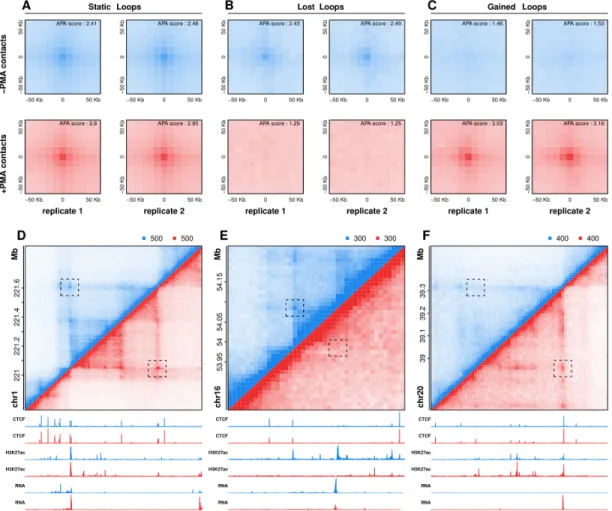
We next leveraged our longitudinal in situ Hi-C experiments to determine whether differentiation of THP-1 cells is accompanied by dynamic looping events. Using a method that explicily tests for changes relative to local background, we identified 217 significant changes in DNA looping events in THP-1 cells, with a loss in 33 monocyte-enriched interactions and a gain in 184 macrophage-enriched interactions after treatment with PMA (DESeq2, p < 0.001;
Supplemental Methods, Table S3). APA analysis of differential looping events illustrates both the reproducibility of dynamic
interactions across biological replicates and the significant difference in contact frequencies before and after differentiation of THP-1 cells, suggesting our stringent differential loop calling identifies loops that are entirely lost or gained during macrophage development (Fig. 2A-C). Examples of loops that were static, lost, or gained during differentiation are shown in Figure 2D-F. Overall, we find that loops gained during differentiation are more abundant (184 vs 33) and overlap more genes (88 vs 8) than loops lost during differentiation. Inspection of both APA plots (Fig. 2B-C) and individual loops further support this bias in dynamic looping, altogether suggesting that loop formation as opposed to loop disruption may play a broader role in macrophage development.
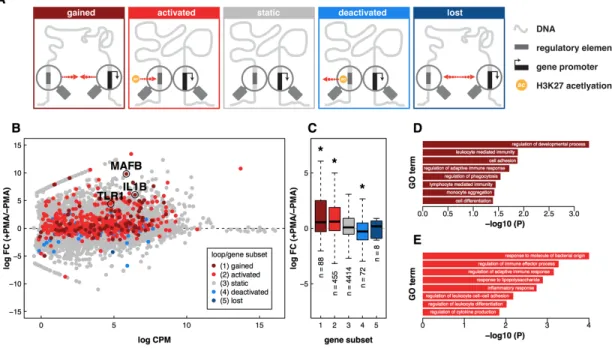
Visual inspection of the data indicated that both static and dynamic loops link gene promoters to distal regulatory elements marked by changes in H3K27 acetylation, suggesting that in addition to dynamic looping events, preformed loops may also play an important role in distal regulation of transcription during differentiation. To investigate this further, we categorically divided our loops into five subsets; (1) loops that disappeared during differentiation (‘lost’), (2) loops that did not change significantly during differentiation but contained an anchor region that harbored a decreasing promoter-distal H3K27ac peak (‘deactivated’), (3) loops that did not change and that did not overlap any dynamic promoter-distal H3K27ac peaks (static’), (4) loops that did not change during differentiation but contained an anchor region that harbored an increasing promoter-distal H3K27ac peak (‘activated’), and (5) loops that are acquired during differentiation (‘gained’) (Fig. 3A). We next considered how genes whose promoters overlapped anchors of each of these loop
sets changed during differentiation (Fig 3B-C). For deactivated and activated enhancer-loop sets, only genes at the distal end of the dynamic enhancer were considered. Only eight genes were found at lost loops and they showed no significant difference in expression when compared to static loops. However, deactivated loops connected regions with decreased H3K27 acetylation to 72 genes whose expression significantly decreased during differentiation. In contrast, activated and gained loops overlapped 455 and 88 genes, respectively, that increased in expression during differentiation. Overall, these results support two modes of distal gene regulation during THP-1 differentiation. In the first mode, new loop formation connects distal regulatory elements to the promoters of key regulatory genes that are dynamically expressed during differentiation. In the second mode, changes in enhancer activity control the expression of target genes through stable chromatin loops that do not change during differentiation.
Figure 3: Expression and function of genes correlate with dynamic loop type and distal chromatin state. (A)
Schematic depictions of five distinct loop classes. Red arrows indicate direction of change during PMA-induced differentiation of THP-1 cells. ‘Ac’ refers to a change in H3K27 acetylation as detected by ChIP-seq. (B) Scatter plot
portraying mean counts per million vs log fold change for all transcripts measured by RNA-seq. Genes are
colored according to the class of loop found at their promoter. (C) Boxplot depicting RNA FPKM values as a function of
Genes found at the anchors of gained and activated loops included key regulatory genes required for macrophage function and development. The genes include; (1) Interleukin 1 beta (IL1β), a canonical proinflammatory cytokine whose activation via proteolytic cleavage initiates widespread signaling and transcriptional changes in macrophages and neighboring cells, (2) V-maf musculoaponeurotic fibrosarcoma oncogene homolog B (MAFB), an AP-1 family transcription factor and essential regulator of differentiation and self-renewal during haematopoiesis, and (3) Toll-Like Receptor 1 (TLR1), a cell surface membrane receptor critical for recognition of foreign pathogens and stimulation of innate immune response. Gene ontology (GO) enrichment analysis revealed that genes overlapping gained loop anchors are enriched for biological processes related to macrophage function, such as cell adhesion, phagocytosis, and immune response (Fisher’s Exact Test, p < .05; Fig. 3D, Table S4). GO analysis of genes associated with activated loops revealed enrichment of macrophage-related functions including response to molecule of bacterial origin, regulation of leukocyte differentiation, and inflammatory response (Fig. 3D, Table S5). The correlation between gene expression, enhancer activity and dynamic looping events at these macrophage-related genes together suggests that cell type specific transcription is controlled through both re-wiring of enhancer-promoter interactions and through increasing or decreasing enhancer activities at the promoter-distal end of pre-formed loops.
Loops gained during differentiation are regulatory rather than structural in nature
One of the primary proposed functions of DNA loops is to bring distal regulatory elements such as enhancers into close physical proximity of their target genes to drive increased expression. However, many loops do not overlap gene promoters and are thought to play a structural, as opposed to gene regulatory, role (Ong and Corces, 2014). One proposed role for non-enhancer-promoter loops is the creation of insulated neighborhoods which facilitate stochastic interactions between enhancers and promoters within them (Dowen et al., 2014). However, it is currently unclear
whether loops formed during differentiation are mediating direct enhancer-promoter interactions or whether they are more structural in nature. To explore this question, we used promoter-distal H3K27 acetylation as a proxy for enhancer activity to examine the degree to which static and dynamic loops regulated enhancer-promoter interactions during PMA-induced differentiation.
Loops gained during differentiation were enriched for both H3K27 acetylation and gene promoters compared to static loops (Fisher’s Exact Test, p < 0.01; Fig 4A-B). Amazingly, 90% of loops gained during differentiation connected two ‘regulatory elements’ (i.e. an enhancer to another enhancer, a promoter to another promoter, or an enhancer to a promoter) compared to only 42% of static loops. There was an especially strong enrichment for loops with H3K27 acetylation peaks at both ends (Fisher’s Exact Test, p = 1.4 x 10⁻²⁷; Fig 4A). Greater than 60% of gained loops contained H3K27 acetylation sites at both anchors, a 2.4 fold increase compared to static loops (Fig 4A). In agreement with these results, fold changes of H3K27ac signal at loop anchors were positively correlated with changes in DNA looping (Fig 4C). Moreover, enhancers at dynamic loop anchors showed increased cell-type specificity compared to those at static loop anchors, in agreement with previous findings that differential looping plays a role in establishing cell-type specific expression patterns (Fig 4D; (Rao et al., 2014; Roadmap Epigenomics et al., 2015; Sanyal et al., 2012; Smith et al., 2016)). These findings suggest that changes in chromatin structure during PMA-induced differentiation of THP-1 cells primarily facilitate direct connections between enhancers and promoters to regulate cell-type specific gene transcription as opposed to forming structural elements such as insulated neighborhoods.
Formation of mutli-loop activation hubs during macrophage development
loops), direct enhancer-promoter interactions accounted for only 27% of gained loops (Fig 4E). The majority (56%) of gained loops connected an enhancer to another enhancer, a 2.6-fold enrichment compared to static loops. While the functional significance of enhancer-promoter loops is well established, the role of enhancer-enhancer interactions is less obvious.
One possible explanation for the large proportion of enhancer-enhancer loops is the presence of interaction hubs involving a single promoter and multiple enhancers that all interact with each other. A fully connected hub with only one promoter and N enhancers would contain N enhancer-promoter interactions and (N)! / 2(N-2)! enhancer-enhancer interactions. For all values greater than N = 3, there would be
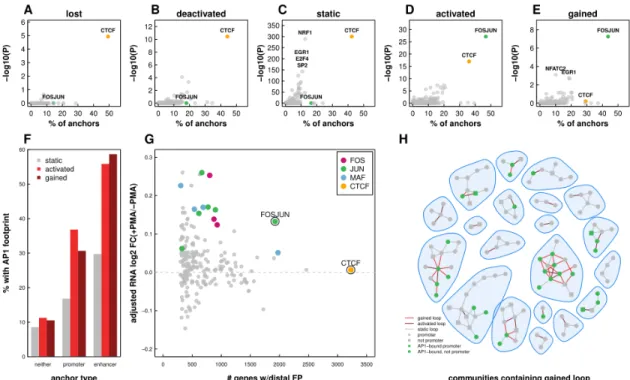
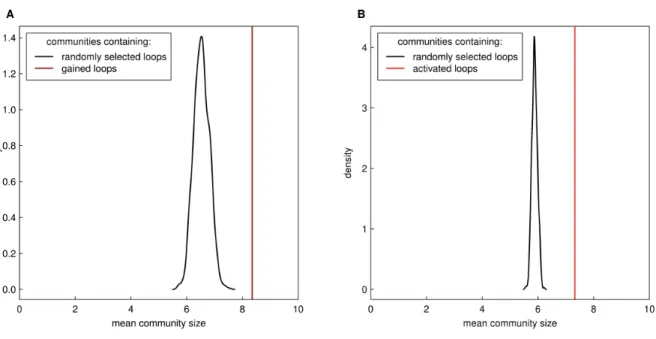
more enhancer-enhancer loops than enhancer-promoter loops. To determine if our loops were forming such hubs we built interaction networks and detected communities of interacting anchor regions using a fast greedy modularity optimization algorithm (Clauset et al., 2004). We then classified these communities into two subsets: those containing a gained loop and those without. Twenty randomly chosen communities representing each subset are shown in figure 4F-G. Inspection of these subsets revealed stark differences. First, communities involving gained loops contained significantly more loop anchors (mean = 8.3 vs 3.6) compared to communities lacking gained loops (Wilcoxon Rank Sum Test, p = 3.7 * 10-32; Fig. 4H). This finding holds true even when accounting for the higher likelihood of a
gained loop falling within a larger community (permutation testing, P < 0.001; Fig. S3). Second, the average ratio of enhancers to promoters per community was significantly higher (mean = 3.4 vs 1.6) in communities containing a PMA-specific loop (Wilcoxon Rank Sum Test, p = 7.4 * 10-15; Fig. 4I). Since communities involving gained loops had, on average, more than 3 enhancers it is consistent to observe more enhancer-enhancer than enhancer-promoter interactions in this subset.
These findings demonstrate that loops gained and activated during differentiation form activation hubs linking multiple distal enhancers to gene promoters (Kim and Dean, 2012; Krivega and Dean, 2016). Such interactive hubs have been previously reported including one that forms during erythroid differentiation bringing multiple distal DNase hypersensitive sites into close proximity with either fetal or adult globin genes (Palstra et al., 2003; Tolhuis et al., 2002). However, to the best of our knowledge this is the first report that such hubs are the primary location of newly formed and activated loops during cellular differentiation. Whether this phenomenon is specific to macrophage development or a more broadly applicable aspect of cellular differentiation remains to be seen.
Dynamic re-wiring of chromatin
architecture links distal AP-1 binding sites to key macrophage regulatory genes
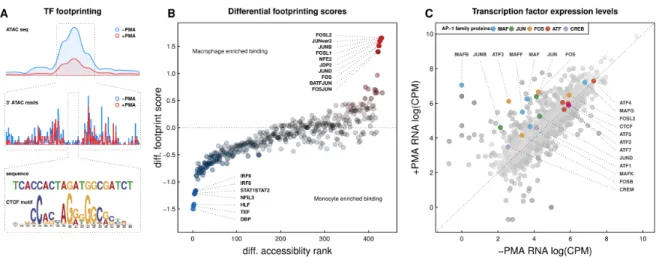
Active regulatory elements can be profiled using assays that exploit chromatin accessibility to identify open chromatin regions (Boyle et al., 2008; Buenrostro et al., 2015; Giresi et al., 2007). To better characterize the cell-stage specific loops observed in our high resolution in situ Hi-C experiments, we mapped transposase-accessible DNA genome-wide by ATAC-seq in THP-1 cells. Comparison of chromatin accessibility before and after treatment uncovers thousands of changes in accessible chromatin regions during macrophage development. Analysis of the exact transposase insertion sites at each region of accessibility reveals regions of the genome that are protected from transposase activity, often representing genomic elements bound by transcription factors. Analysis of the sequence
underlying such “footprints” can be used to predict which protein(s) may be present using an approach called TF footprinting (Fig. S4A). Global transcription factor footprinting of deeply sequenced ATAC-seq libraries in THP-1 cells both before and after PMA treatment reveals significant upregulation of protein-DNA interactions at JUN, FOS, and other AP-1-related target sequences, and down-regulation at sites targeted by interferon regulatory factors IRF8 and IRF9 (Fig. S4B). In agreement with these results, analysis of differential TF transcript abundance before and after PMA treatment reveals significant upregulation of genes encoding AP-1 family transcription factors, particularly for specific members of the MAF, JUN, and FOS AP-1 subfamilies, and significant downregulation of IRF8 (Fig. S4C). The upregulation of AP-1 transcription factor levels and corresponding increase in TF occupancy at AP-1 target sequences is consistent with the broad role of AP-1 in controlling cellular differentiation and proliferation (Eferl and Wagner, 2003; Shaulian and Karin, 2002).
We next leveraged TF footprinting analysis to specifically identify the transcription factors present at anchor regions of each class of loops (Fig. 5A-E). As expected, CTCF binding is strongly enriched at static chromatin loops, consistent with both motif enrichment and ChIP-seq experiments in THP-1 cells (Fig. 5C). Additional TF footprints, such as NRF1 and EGR1, are also statistically enriched but present at a small subset of static long-range interactions. Similar levels of CTCF are observed at lost and deactivated loop anchors. Analysis of gained and activated looping events, on the other hand, reveals a striking enrichment for AP-1 target sequences at more than 40% of loop anchors (Fig. 5D-E). Interestingly, CTCF footprints are far less enriched at gained and activated interaction sites. A careful inspection of ChIP-seq data reveals that CTCF is bound at these loop anchors but that CTCF binding is significantly weaker compared to static loop anchors. The functional significance of this difference is unclear but it further underscores the characteristic differences between static and gained/activated loops (Fig. S5A-C).
anchors with active enhancers (Fig. 5F), suggesting that AP-1 may be positively regulating gene transcription via binding at distal regulatory elements. To explore this possibility, we determined the relationship between distal TF binding and gene expression (Fig. 5G). Indeed, distal binding of AP-1 proteins, as measured by TF footprinting, correlated with increased expression of connected genes (Fig. 5G). While increased expression of genes that looped to distal FOSJUN motifs was particularly prominent, other FOS, JUN, and MAF family protein footprints showed a similar effect.
Taken together, the results presented here reveal multiple characteristics of promoter-distal gene regulation during macrophage development. Enhancer activation and AP-1 binding at distal ends of both gained and pre-formed loops create multi-loop activation hubs. These hubs harbor more that 3 distal regulatory elements per promoter and are associated with large increases in gene
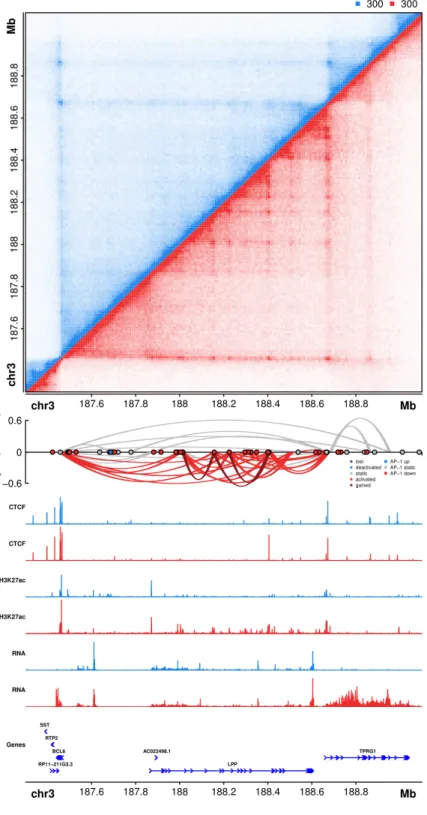
transcription. A clear example of a newly formed activation hub that exhibits all of these characteristics is observed at the TPRG1/BCL6 locus on chromosome 3 (Fig. 6). A complex network of AP-1 bound loci, located primarily within introns of the LPP gene, connect distal enhancers to the promoter regions of TPRG1 and BCL6. Intriguingly, LPP, whose promoter is not involved in any gained or activated loops, exhibits only a moderate change in gene expression (1.4-fold increase). In contrast, TPRG1 and BCL6, which are both associated with gained and activated loops, increase in expression by more than 25 fold.
Further examples of AP-1 bound activation hubs are observed at key macrophage regulatory genes including MAFB, and IL1β (Fig.
S6A-C). Transcriptional activation of MAFB, for example, is accompanied by dramatic changes in surrounding chromatin interactions, particularly for interactions between the MAFB gene promoter and a distal AP-1-bound enhancer that gains
Figure 5: AP-1 enriched at enhancer containing loop anchors in both gained and activated loops. Scatter plots depicting the percent of lost (A), deactivated (B), static (C), activated (D), and gained (E) anchors that overlap TF footprints and the -log 10 p-value of enrichment (Fisher’s Exact Test) for each TF. (F) Bar plots depicting the percent of
loop anchors that overlap an AP-1 footprint as a function of loop subset and promoter or enhancer overlap (G) Median
chromatin accessibility and TF occupancy in THP-1 derived macrophages (Fig. S6A). Activation of the interleukin-1b gene similarly involves dynamic looping between the IL1β gene promoter and a distal regulatory element marked by AP-1 binding after differentiation (Fig. S6B). The gain of AP-1 enhancer-promoter interactions are in certain cases marked as well by CTCF
binding, suggesting AP-1 binding may be directed towards gene promoters for gene activation by CTCF (Fig. S6A). However, in other cases dynamic AP-1 looping-interaction sites are not marked by CTCF binding (Fig. S6C), or marked by non-dynamic CTCF binding (Fig. S6B), suggesting the chromatin interactome at these genes can be directed either through
Figure 6: AP-1 bound activation
hub formed during PMA
induced differentiation of THP-1 cells on chromosome 3. (Top)
Hi-C contact matrix depicting normalized contact frequencies between loci on a region of chromosome 3 in untreated THP-1 cells (blue, top left) and PMA treated THP-1 cells (red, bottom right). (Middle) A Sushi ribbon plot depicting DNA loops, loop fold changes (y-axis), loop subset (color of loops), and differential AP-1 footprints (circles). (Bottom)
AP-1-mediated interactions or through additional factors.
DISCUSSION
Our results provide a new framework for understanding how the three-dimensional arrangement of human chromosomes may contribute to cellular differentiation and cell type-specific expression patterns. By generating deeply sequenced in situ Hi-C experiments in the context of monocyte-to-macrophage differentiation, we present some of the highest quality genome-wide maps of chromatin interactions during cellular differentiation to date. Identification of DNA loops in monocytes and THP-1 derived macrophages revealed multiple classes of preformed and dynamic 3D chromatin structures that correlate with changes in enhancer activation and gene expression. Specifically, we found that during macrophage development AP-1 binds at promoter-distal enhancer elements that are connected to upregulated gene promoters via a complex network of both gained and preexisting DNA loops. The multi-interaction AP-1 communities we identified contained multiple enhancers per promoter and were enriched for macrophage-related genes, suggesting that sophisticated 3D interaction networks may play an important role in developmental gene regulation. The AP-1 signature observed at activated and gained macrophage loops further suggest that transcription factor identity, which may be cell-type specific, may play an important role in driving dynamic transcription of target genes.
AP-1, a heterodimeric transcription factor comprising various combinations of FOS, JUN, MAF, ATF, and CREB family proteins, has been known to play a pivotal role in leukocyte development for decades (Liebermann et al., 1998; Valledor et al., 1998). However, its participation in gene regulation via DNA looping during macrophage development has not been previously described. Nevertheless, locus- and gene-specific examples of AP-1 bound DNA loops have been reported, such as at regulatory enhancer-promoter interactions that drive transcription of ZEB2 and PADI3 (Chavanas et al., 2008; Qiao et al., 2015), supporting a role for AP-1 family proteins in
three-dimensional regulation of target genes and the broader, genome-wide participation of AP-1 characterized in the present study. Given its role across diverse cellular differentiation pathways (Eferl and Wagner, 2003; Shaulian and Karin, 2002), we speculate that the heterodimeric composition of the AP-1 transcription factor complex may contribute to re-wiring of chromatin interactions in a cell-type and tissue-specific manner. However, given the extraordinary number of potential transcription factor combinations that may co-bind at AP-1 consensus motifs (Mechta-Grigoriou et al., 2001), which can not be determined directly by footprinting methods, future studies aimed at comprehensively mapping this combinatorial landscape would shed significant insight into the precise proteins underlying AP-1 related looping events.
gene promoter and are associated with strong upregulation of gene transcription.
AP-1 bound activation hubs are reminiscent of dynamic chromatin structures found at the beta-globin locus in which multiple distal sites loop to the active beta globin genes during specific stages in erythroid cell development (Tolhuis et al., 2002). Analogous to AP-1 interactions targeting macrophage-specific genes, the beta-globin locus is organized into an “Active Chromatin Hub” that requires regulatory transcription factors such as ELKF, GATA1, Ldb1, and FOG1 (Drissen et al., 2004; Song et al., 2007; Vakoc et al., 2005). Indeed, we believe that the multi-interaction communities identified herein may have far-reaching implications for how chromosome organization instructs transcription in other cellular contexts and throughout human development. Identification of AP-1 activation hubs in our system was made achievable thanks to the high quality comprehensive interaction maps generated by deeply sequenced in situ Hi-C experiments. Thus, deep profiling of chromatin loops throughout early development remains a pressing need for better understanding the dynamic nature of mammalian chromosome organization.
Finally, because Hi-C and other chromatin profiling assays query DNA loops
EXPERIMENTAL PROCEDURES
THP-1 cell culture and differentiation
THP-1 cells were obtained from ATCC and passaged in growth medium containing RPMI-1640 (Corning), 10% fetal bovine serum, and 1% penicillin streptomycin. THP-1 differentiation was carried out at a final concentration of 100 nM PMA for 72 hours, followed by trypsinization and isolation of adherent THP-1 derived macrophages with TrypLE (ThermoFisher).
Chromatin Immunoprecipitation
For each biological replicate, approximately 10 million treated or untreated THP-1 cells were resuspended in growth media at 1 x 10⁶ cells/mL. Fixation was performed for 10 minutes with rotation at room temperature in 1% formaldehyde; cross-linking was then quenched in 200 mM glycine with rotation for 5 minutes. Cross-linked cells were then pelleted and resuspended in 1x RIPA lysis buffer, followed by chromatin shearing via sonication (3 cycles using a Branson sonicator: 30 seconds on, 60 seconds off; 15 additional cycles on a Bioruptor sonicator: 30 seconds on, 30 seconds off). Individual ChIP experiments were performed on pre-cleared chromatin using antibody-coupled Dynabead protein G (ThermoFisher) magnetic beads. Anti-histone H3 (acetyl K27) antibody was obtained from Abcam (ab4729), CTCF antibody was obtained from Millipore (07-729). 3-5 ug of antibody per ChIP was coupled to 18 uL beads and rotated overnight with sheared chromatin at 40 C. Beads were then washed 5x in ChIP wash buffer (Santa Cruz), 1x in TE, and chromatin eluted in TE + 1% SDS. Cross-linking was reversed by incubation at 650 C overnight, followed by digestion of RNA (30 min RNase incubation at 370C) and digestion of protein (30 min proteinase K incubation at 450C). ChIP DNA was then purified on a minElute column (Qiagen), followed by DNA library preparation and size selection of 350-550 bp fragments via gel extraction (Qiagen).
Assay for transposase accessible chromatin (ATAC-seq)
For each biological replicate, approximately 50,000 treated or untreated THP-1 cells were collected and washed with 1x ice cold PBS. Cells were pelleted via centrifugation and resuspended in lysis buffer (10mM Tris-HCl, pH 7.4, 10mM NaCl, 3mM MgCl2, 0.1%
IGEPAL CA-630). Cells were again pelleted by centrifugation and the supernatant discarded. Transposition was carried out for 30 minutes at 370C using the Nextera DNA library prep kit (Illumina, cat#FC-121-1030). DNA was subsequently purified on a minElute column (Qiagen), and PCR amplified using the NEBNext high-fidelity master mix (NEB cat#M0541) with nextera PCR primers and barcodes. PCR amplification was monitored as described (Buenrostro et al. 2015), and gel purified to remove contaminating primer-dimer species.
In situ Hi-C
In situ as performed exactly as described by Rao et al (Rao et al., 2014). Cells were crosslinked in 1% v/v formaldehyde for ten minutes with stirring and quenched by adding 2.5M glycine to a final concentration of 0.2M for 5 minutes with rocking. Cells were pelleted by spinning at 300 G for 5 minutes at 4 degrees C. Cells were washed with cold PBS and spun again prior to freezing in liquid nitrogen.
Cells were lysed with 10mM Tris-HCl pH8.0, 10mM NaCl, 0.2% Igepal CA630 and protease inhibitors (Sigma, P8340) for 15 minutes on ice. Cells were pelleted and washed once more using the same buffer. Pellets were resuspended in 50ul of 0.5% SDS and incubates for 5-10 minutes at 62’C. Next reactions were quenched with 145ul of water and 25ul of 10% Triton X-100 (Sigma, 93443) at 37’C for 15 minutes. Chromatin was digested overnight with 25ul of 10X NEBuffer2 and 10U of MboI at 37’C with rotation.
hour. Ligation was performed by adding 667 ul of water, 120 ul of 10X NEB T4 DNA ligase buffer, 100 ul of 10% Triton X-100, 12 ul of 10 mg/ml BSA, and 1 ul of 2000 U/ul T4 DNA Ligase and incubating at room temperature for 4 hours. Samples were pelleted at 2500 G and resuspended in 432 ul water, 18 ul 20 mg/ml proteinase K, 50 ul 10% SDS, 46 ul 5M NaCl and incubated for 30 minutes at 55’C. The temperature was raised to 68’C and incubated overnight.
Samples were cooled to room temperature. 874 ul of pure ethanol and 55 ul of 3M sodium acetate, pH 5.2 were added to each tube which were subsequently incubated for 15 minutes at -80’C. Tubes were spun at max speed at 2’C for 15 minutes and washed twice with 70% ethanol. The resulting pellet was resuspended in 130 ul of 10mM Tric-HCl, pH8 and incubated at 37’C for 15 minutes. DNA was sheared using an LE220 Covaris Focused-ultrasonicator to a fragment size of 300-500 bp. Sheared DNA was size selected using AMPure XP beads. 110 ul of beads were added to each reaction and incubated for 5 minutes. Using a magnetic stand supernatant was removed and added to a fresh tube. 30ul of fresh AMPure XP beads were added and incubated for 5 minutes. Beads were separated on a magnet and washed two times with 700 ul of 70% ethanol without mixing. Beads were left to dry and then sample was eluted using 300 ul of 10 mM Tris-HCl, pH 8.
150 of 10 mg/ml Dynabeads MyOne Streptavidin T1 beads were washed resuspended in 300 ul of 10 mM Tris HCl, pH 7.5. This solution was added to the samples and incubated for 15 minutes at room temperature. Beads were washed twice with 600ul Tween Washing Buffer (TWB; 250 ul Tris-HCl, pH 7.5, 50 ul 0.5 M EDTA, 10 ml 5M NaCl, 25 ul Tween 20, and 39.675 ml water) at 55’C for 2 minutes with shaking. Sheared ends were repaired by adding 88 ul 1X NEB T4 DNA ligase buffer with 1mM ATP, 2 ul of 25 mM dNTP mix, 5 ul of 10U/ul NEB T4 PNK, 4ul of 3U/ul NEB T4 DNA polymerase I, 1ul of 5U/ul NEB DNA polymerase I, Large (Klenow) Fragment and incubating at room temperature for 30 minutes. Beads were washed two more times with TWB for 2
minutes at 55’C with shaking. Beads were washed once with 100 ul 1X NEBuffer 2 and resuspended in 90 ul of 1X NEBuffer 2, 5 ul of 10 mM dATP, 5ul of 5U/ul NEB Klenow exo minus, and incubated at 37’C for 30 minutes. Beads were washed two more times with TWB for 2 minutes at 55’C with shaking. Beads were washed once in 50 ul 1X Quick Ligation reaction buffer and resuspended in 50 ul 1X Quick Ligation reaction buffer. 2 ul of NEB DNA Quick ligase and 3 ul of an illumina indexed adapter were added and the solution was incubated for 15 minutes at room temperature. Beads were reclaimed using the magnet and washed two more times with TWB for 2 minutes at 55’C with shaking. Beads were washed once in 100 ul 10 mM Tris-HCl, pH8 and resuspended in 50 ul 10 mM Tris-HCl, pH8.
Hi-C libraries were amplified for 7-12 cycles in 5 ul PCR primer cocktail, 20 ul of Enhanced PCR mix, and 25 ul of DNA on beads. The PCR settings included 3 minutes of 95’C followed by 7-12 cycles of 20 seconds at 98’C, 15 seconds at 60’C, and 30 seconds at 72’C. Samples were then held at 72’C for 5 minutes before lowering to 4’C until samples were collected. Amplified samples were brought to 250 ul with 10 mM Tris-HCl, pH 8. Samples were separated on a magnet and supernatant was transferred to a new tube. 175 ul of AMPure XP beads were added to each sample and incubated for 5 minutes. Beads were separated on a magnet and washed once with 700 ul of 70% ethanol. Supernatant was discarded. 100 ul of 10 mM Tris-HCl and 70 ul of fresh AMPure XP beads were added and the solution was incubated for 5 minutes at room temperature. Beads were separated with a magnet and washed twice with 700 ul 70% ethanol. Beads were left to dry until cracking started to be observed and eluted in 25 ul of Tris HCl, pH 8.0. The resulting libraries were quantified by Qubit and Bioanalyzer prior to sequencing.
RNA sequencing
Dynabeads mRNA Direct kit according to manufacturer directions. Sequencing libraries were prepared using the Epicenter ScriptSeq V2 kit according to manufacturer supplied protocol. The resulting libraries were quantified by Qubit, mixed in equal concentrations, and assayed by Bioanalyzer prior to sequencing using Illumina HiSeq 2500 technology.
Genomic data processing
ATAC-seq: Paired end sequencing reads were trimmed using trim galore version 0.40 with command-line settings “trim_galore -q 20 --trim1 --paired” and subsequently aligned to the hg19 reference genome using bowtie2 version 2.2.4 with settings “bowtie2 -t --sensitive”. Mapped reads were merged across technical and sequencing replicates, and duplicate reads removed using picard tools version 1.92. Peaks were identified for each sample and biological replicate using MACS2 version 2.1.0 with command line options “macs2 callpeak bdg nomodel t -g hs”. For analysis of differential chromatin accessibility, raw ATAC-seq reads were extracted for each condition over a merged set of ATAC-seq peaks and statistical significance determined using the glmTreat function in edgeR with a fold change cutoff of 2. For genome-track visualization purposes, ATAC-seq reads were normalized for sequencing depth and mappability using the align2rawsignal pipeline with options “-of=bg -n=5 -l=200 -w=200 -mm=30” (https://align2rawsignal.googlecod e.com).
ChIP-seq: Paired end sequencing reads were trimmed using trim galore version 0.40 with command-line settings “trim_galore -q 20 --trim1 --paired” and subsequently aligned to the hg19 reference genome using bowtie1 version 1.1.1 with settings “bowtie -q phred33quals -X 2000 -m 1 fr -p 8 -S --chunkmbs 400”. Mapped reads were merged across technical and sequencing replicates, and duplicate reads removed using picard tools version 1.92. Peaks were identified for each sample and biological replicate using MACS2 version 2.1.0 with command line options “macs2 callpeak --bdg -t -g hs”. For analysis of differential chromatin accessibility, raw ATAC-seq reads were extracted for each condition over
a merged set of ATAC-seq peaks and statistical significance determined using the glmTreat function in edgeR with a fold change cutoff of 2. For genome-track visualization purposes, ATAC-seq reads were normalized for sequencing depth and mappability using the align2rawsignal pipeline with options “of=bg n=5 l=200
-w=200 -mm=30”
(https://align2rawsignal.googlecode.com).
RNA-seq: Paired end sequencing reads were trimmed using trim galore version 0.40 with command-line settings “trim_galore -q 20 --trim1 --paired” and subsequently aligned to gencode v19 transcripts using kallisto with default parameters. For analysis of differential genes, kallisto outputs were processed using tximport. Genes with less than 2 counts per million were filtered out. Statistical significance was determined using the glmTreat function in edgeR with a fold change cutoff of 2. For genome-track visualization purposes, RNA-seq reads were aligned to the hg19 reference genome using tophat. Duplicate reads were removed using MarkDuplicates from picard-tools version 1.92. The resulting reads were normalized for sequencing depth and mappability using the align2rawsignal pipeline with options “of=bg n=5 l=1
-w=200 -mm=30”
(https://align2rawsignal.googlecode.com).
applied after merging sequencing duplicates but prior to merging data sets arising from different library preparations. Filtered reads from each pair of SAM files were combined into a single bed paired end file. Reads with mapping scores (MAPQ) below 30 were filtered out from subsequent analyses. We next built contact matrices for various resolutions including 5, 10 and 100Kb. For each resolution we binned all fragments according to their midpoint and then counted the read pairs that corresponded to each pair of fragments. Only intra chromosomal matrices were constructed. We constructed two type of contact matrices. For differential loop calling we built matrices for each biological replicate separately. For visualization we combined biological replicates into a single contact matrix for each sample (i.e. un-treated and PMA-treated THP-1 cells). Matrices were balanced according to a method proposed by Knight and Ruiz (Knight and Ruiz, 2013). Bins with less than 25 pixels of non-zero values were discarded from the normalization procedure. After balancing we calculated the expected normalized contacts for each distance for each chromosome separately. Noise associated with distances with few counts was mitigated by merging distances until more than 400 counts were achieved.
P values describing the observed contact frequencies given local background contact frequencies were determined for pixels at 10Kb resolution as described by Rao et al. For all pixels representing genomic bins separated by less than 2 million base pairs, various metrics were collected. For each pixel we defined several local neighborhoods as described by Rao et al; donut, horizontal, vertical, and lower right. Values of p=2 and w = 5 were used. The donut neighborhood is defined as pixels that are greater than p and less than or equal to w pixels away from the primary pixel in either the x or y directions. The other three neighborhoods are subsets of the donut neighborhood. The horizontal neighborhood is defined as pixels that are greater than p and less than or equal to w pixels away from the primary pixel in the x direction and greater less than p pixels away in the y direction. The horizontal neighborhood is defined as pixels that are greater than p and
less than or equal to w pixels away from the primary pixel in the y direction and less than p pixels away in the x direction. And the lower right neighborhood is all pixels with x values greater than the primary pixel but less than or equal to w pixels away, pixels with y values less than than the primary pixel and less than or equal to w pixels away, and pixels with coordinates that are more than p pixels away in either the x or y direction. For each neighborhood, summed normalized contact frequencies were determined. If summed values were less than 16, w was increased until either greater than 16 counts were reached or w was equal to 20. For each neighborhood, summed expected contact frequencies were determined as well. For each neighborhood the ratio of observed / expected counts was determined. This ratio was multiplied by the expected value of the primary pixel to determine the expected normalized contacts for each pixel analyzed. This value was converted to an expected raw contact count by multiplying by the corresponding normalization factors determined by our matrix balancing step. P values of differences between observed raw counts and expected raw count, as estimated from each of the four local neighborhoods, were was determined determined using the R programming language and the function ppois with lower.tail = FALSE. P values for all pixels tested on all chromosomes were corrected for multiple hypothesis testing using the Benjamini-Hochberg method.
contained regions of repetitive nature, pixels within 50Kb of a genomic bin that was discarded by the matrix normalization step were removed.
TF Footprinting: Transcription factor footprinting was broken into two steps: (A) identify bound TF motifs in THP-1 monocytes and THP-1 derived macrophages and (B) Determine differential footprinting scores before and after PMA treatment for each motif identified in THP-1 cells.
Step (A): Putative TF footprints were identified using the Protein Interaction Quantification (PIQ) footprinting algorithm (Sherwood et al., 2014) against the JASPAR core vertebrate database of TF motifs (http://jaspar.genereg.net). First, motif matching was performed for 516 known TF target sequences against the hg19 reference genome using the PIQ package pwmmatch.exact.r script. Second, filtered ATAC-seq alignment reads were converted into binary RData files using the PIQ package pairedbam2rdata.r script. Third, TF footprint scores were determined for each motif match using the PIQ package pertf.bg.r and common.r scripts with default settings. Putative TF footprints were filtered at a positive predictive value (PPV) cutoff of 0.7 and for footprints that intersect ATAC-seq peaks identified in THP-1 cells. Altogether, 2,731,616 TF footprints were identified post-filtering with a median 3,693 binding sites per unique TF motif.
Step (B): Analysis of dynamic TF binding was performed using the Wellington-bootstrap algorithm for differential footprinting (Piper et al., 2015) against all post-filtering TF footprints identified by PIQ. First, differential footprinting was applied using the pyDNase wellington-bootstrap.py script with the command-line option for ATAC-seq input “-A”. Second, differential footprint scores were determined using the pyDNase dnase_ddhs_scorer.py script with the command-line option for ATAC-seq input (“-A”). Differential footprint scores (DFP) were altogether adjusted by median normalization, followed by median differential footprint analysis for each independent factor. Wellington DFPs strongly correlate with changes in PIQ PPV
values (p < 2.2e-16), and using a cutoff of +/- 2 standard deviations, we identify a total of 33,130 decreasing and 95,898 increasing TF binding events.
Post processing and analyses
Comparison to Juicer pipeline: Hi-C libraries were also analyzed using the Juicer pipeline. Data was processed for 5,929,803,301 Hi-C read pairs in untreated THP-1 cells, yielding 3,935,374,088 Hi-C contacts and 5,522,487,839 Hi-C read pairs in PMA-treated THP-1 cells, yielding 3,789,121,851 Hi-C contacts. Loops were annotated using HiCCUPS at 5kB and 10kB resolutions with default Juicer parameters. This yielded a list of 14,964 loops in untreated THP-1 cells and 22,615 loops in PMA-treated THP-1 cells. All the code used in the above steps is publicly available at (github.com/theaidenlab). Loops identified by Juicer were filtered for those that were greater or equal to 50Kb and less than or equal to 2Mb. In order to determine overlap between our loops and Juicer we had to consider not only the pixel that was picked to represent the loop but all enriched pixels within a cluster. Therefore, for Juicer loops we picked the centroid of the cluster +/- the radius of the cluster for each loop anchor. We then rank ordered our loop calls by increasing p values and determined the percent of our loops that were also found in the Juicer loops calls. We did this for 20 subsets of our loop calls ranging from the top 5% of our loop calls to 100% of our loop calls. These overlaps were performed for both data sets.
Enhancer definition: For all of the analyses in this paper enhancers were defined as regions with an H3K27ac peak as determined by ChIP-seq. H3K27ac peaks that overlapped a gene promoter (i.e. the 2000 bp region upstream of a UCSC hg19 known gene transcription start site) were removed from this list.
Hi-C normalization for visualization:
comparison of contact matrices between two samples all PMA-treated matrices were normalized such that the median normalized contact frequency for each genomic distance was identical between untreated and PMA-treated cells. For all distances plotted, the median contact frequency was determined for each data set. For each distance an offset was determined by dividing the median untreated value but the median PMA-treated value. All PMA-treated normalized contact frequencies were multiplied by this offset factor prior to plotting.
Aggregate peak analysis: In order to assess the quality of loop calls we generated aggregate peak analysis (APA) plots and scores. These analyses aggregate the signal of pixels of loops as well as the pixels surrounding them, the local background. For each loop in a given set of loops, the normalized observed contact frequencies were collected for the pixel representing the loop as well as for pixels within 10 bins in both the x and y directions. To normalize for loops at different distances, each pixel was divided by the expected normalized interaction frequency at that distance to give an observed over expected ratio. Median observed over expected ratios for each position in the matrix were calculated and plotted as a heatmap. APA scores were determined by dividing the center pixel value by the median value of the nine pixels in the lower right section of the APA plot.
Motif enrichment at loop anchors: To determine the frequency of transcription factor motif overlap with loop anchors, we downloaded TF motifs determined by Factorbook and intersected the motifs with our 10Kb loop anchors using the bedtools intersect function (Quinlan and Hall, 2010; Wang et al., 2013). To determine the expected frequency of overlap we shuffled the assignments of motif and genomic region 100 times and performed the same analysis. Unannotated motifs, those that started with “UAK” were not included.
CTCF motif orientation analysis: Loops were filtered to retain those that overlapped a CTCF binding site, as determined by ChIP-seq, at both anchors. These loops
were further filtered for those that overlapped a single CTCF motif as determined by Factorbook (Wang et al., 2013). We then calculated the percent of those remaining loops that contained each of the four possible pairwise combinations of motifs.
Differential Loop analysis: Detection of differential loops can be complicated by larger scale changes chromatin structure that do indeed change interaction frequency but do not change looping per se. Such large-scale structural changes include changes in chromatin compaction, changes in domain boundaries, and duplication of genomic regions. To specifically detect changes in looping we devised a method that looked for changes in the enrichment of pixels representing DNA loops compared to local background interaction frequencies.
expected interaction frequency. These normalization factors were centered around a value of 1 and added to the DESeq2 analysis. The DESeq2 differential pipeline was run with settings betaPrior=FALSE and dispersion fitType="local". The resulting loops were filtered for those with a p value of < 0.001 to produce our final set of differential loops.
Gene Ontology enrichment: GO
enrichment was performed on genes whose promoter overlapped either a gained or activated loop. Promoters were defined as 2000 base pair regions upstream of a gene TSS. For activated loops, only genes at the distal end of an upregulated H3K27ac mark were considered. The background gene set used for these analyses was a list of all genes whose promoters overlapped a loop anchor in either treated or untreated cells. GO enrichment was performed for biological process gene ontologies using the goana function from the R package limma (Ritchie et al., 2015). GO terms were filtered for adjusted p value < 0.05. Selected enriched GO terms were plotted.
Loop community detection and analysis: Non-directed graphs were constructed from loops using the R package igraph. Communities were determined using the fastgreedy.community function with default parameters.
Footprint enrichment at loop anchors: To determine enrichment of TF at loop anchors we first intersected all TF footprints with loop anchors using the bedtools intersect function. For each TF we determined the number of footprints of that TF that overlapped an anchor, number of footprints of that TF that did not overlap an anchor, the number of footprints of other TFs that overlapped an anchor, and the number of footprints of other TFs that did not overlap an anchor. Using these values, we built a contingency table and performed fishers exact test in R. The resulting p values were corrected for multiple hypothesis testing using the Benjamini-Hochberg procedure.
ACCESSION NUMBERS
The sequencing data from this study is publicly available through the Gene Expression Omnibus (GEO) series number GSE96800 (ChIP-seq, ATAC-seq, RNA-seq) and the Sequencing Read Archive (SRA) accession number PRJNA385337 (in situ Hi-C). Processed Hi-C data is also available
through Juicebox
(http://www.aidenlab.org/juicebox/).
AUTHOR CONTRIBUTIONS
Conceptualization, DHP, KVP; Methodology, DHP, KVP, DVS; Software, DHP, KVP, IA, MSS, MIL, ELA; Formal Analysis, DHP, KVP; Funding Acquisition, DHP, MPS; Visualization, DHP, KVP; Writing, DHP, KVP; Validation, GTH, MCB.
ACKNOWLEDGEMENTS
DHP is supported by National Institutes of Health, National Human Genome Research Institute (NHGRI) grant R00HG008662 and the Damon Runyon Cancer Research Foundation (DRG-2122-12). KVB is supported by National Institutes of Health, National Institute of Diabetes and Digestive and Kidney Diseases (NIDDK) grant F32DK107112. GTH is supported by NIH grant NIH T32HG000044. MIL is supported by National Institutes of Health, National Cancer Institute (NCI) grant CA142538-07. DVS was supported by an NIH T32 fellowship (HG000044) and a Genentech Graduate Fellowship. This research was supported by NIH Centers of Excellence in Genomic Science (CEGS) grant 5P50HG00773502. ELA is supported by an
NIH New Innovator Award
President’s Early Career Award in Science and Engineering. Illumina sequencing services were performed by the Stanford Center for Genomics and Personalized Medicine. The content is solely the responsibility of the authors and does not
REFERENCES
Alexander, R.P., Fang, G., Rozowsky, J., Snyder, M., and Gerstein, M.B. (2010). Annotating non-coding regions of the genome. Nat Rev Genet 11, 559-571.
Beagan, J.A., Gilgenast, T.G., Kim, J., Plona, Z., Norton, H.K., Hu, G., Hsu, S.C., Shields, E.J., Lyu, X., Apostolou, E., et al. (2016). Local Genome Topology Can Exhibit an Incompletely Rewired 3D-Folding State during Somatic Cell Reprogramming. Cell Stem Cell 18, 611-624.
Boyle, A.P., Davis, S., Shulha, H.P., Meltzer, P., Margulies, E.H., Weng, Z., Furey, T.S., and Crawford, G.E. (2008). High-resolution mapping and characterization of open chromatin across the genome. Cell 132, 311-322.
Buenrostro, J.D., Wu, B., Chang, H.Y., and Greenleaf, W.J. (2015). ATAC-seq: A Method for Assaying Chromatin Accessibility Genome-Wide. Curr Protoc Mol Biol 109, 21 29 21-29. Busslinger, G.A., Stocsits, R.R., van der Lelij, P., Axelsson, E., Tedeschi, A., Galjart, N., and Peters, J.M. (2017). Cohesin is positioned in mammalian genomes by transcription, CTCF and Wapl. Nature 544, 503-507.
Chavanas, S., Adoue, V., Mechin, M.C., Ying, S., Dong, S., Duplan, H., Charveron, M., Takahara, H., Serre, G., and Simon, M. (2008). Long-range enhancer associated with chromatin looping allows AP-1 regulation of the peptidylarginine deiminase 3 gene in differentiated keratinocyte. PLoS One 3, e3408.
Chawla, A., Nguyen, K.D., and Goh, Y.P. (2011). Macrophage-mediated inflammation in metabolic disease. Nat Rev Immunol 11, 738-749.
Clauset, A., Newman, M.E., and Moore, C. (2004). Finding community structure in very large networks. Phys Rev E Stat Nonlin Soft Matter Phys 70, 066111.
Creyghton, M.P., Cheng, A.W., Welstead, G.G., Kooistra, T., Carey, B.W., Steine, E.J., Hanna, J., Lodato, M.A., Frampton, G.M., Sharp, P.A., et al. (2010). Histone H3K27ac separates active from poised enhancers and predicts developmental state. Proc Natl Acad Sci U S A 107, 21931-21936.
Daigneault, M., Preston, J.A., Marriott, H.M., Whyte, M.K., and Dockrell, D.H. (2010). The identification of markers of macrophage differentiation in PMA-stimulated THP-1 cells and monocyte-derived macrophages. PLoS One 5, e8668.
Darrow, E.M., Huntley, M.H., Dudchenko, O., Stamenova, E.K., Durand, N.C., Sun, Z., Huang, S.C., Sanborn, A.L., Machol, I., Shamim, M., et al. (2016). Deletion of DXZ4 on the human inactive X chromosome alters higher-order genome architecture. Proc Natl Acad Sci U S A 113, E4504-4512.
Davies, J.O., Oudelaar, A.M., Higgs, D.R., and Hughes, J.R. (2017). How best to identify chromosomal interactions: a comparison of approaches. Nat Methods 14, 125-134. Dekker, J., Marti-Renom, M.A., and Mirny, L.A. (2013). Exploring the three-dimensional organization of genomes: interpreting chromatin interaction data. Nat Rev Genet 14, 390-403. Deng, W., Lee, J., Wang, H., Miller, J., Reik, A., Gregory, P.D., Dean, A., and Blobel, G.A. (2012). Controlling long-range genomic interactions at a native locus by targeted tethering of a looping factor. Cell 149, 1233-1244.