ANTHROPOGENIC EFFECTS ON ESTUARINE SHORELINE PRIMARY PRODUCTIVITY AND NUTRIENT CYCLING
Theresa A. O’Meara
A dissertation submitted to the faculty at the University of North Carolina at Chapel Hill in partial fulfillment of the requirements for the degree of Doctor of Philosophy in the Department
of Environmental Sciences and Engineering in the Gillings School of Global Public Health.
Chapel Hill 2014
ABSTRACT
Theresa A. O’Meara: Anthropogenic Effects on Estuarine Shoreline Primary Productivity and Nutrient Cycling
(Under the direction of Dr. Michael Piehler)
Humans are extremely effective ecosystem engineers but the consequence of our actions warrant study. Multiple anthropogenic stressors including sea level rise, development, and nutrient loading currently threaten coastal systems. Significant alterations to coastal habitats affect their function and potentially causing irreparable damage. This study focused on
understanding the function of the estuarine land-water interface, particularly the base of the food web, or primary producers and factors that may alter their distribution, abundance, speciation, and quality as a food source. These experiments were conducted along the coast of North Carolina, but are largely applicable to similar systems worldwide. Nitrogen is typically the limiting nutrient in estuarine systems, and eutrophication is a critical concern due to excessive supplies of nitrogen accelerating primary production to unsustainable levels. I have found that nitrogen processing in the coastal land-water interface can mitigate loading through
denitrification, but quality is also important. Since different denitrifying microbes produce different end products, the distribution of these microbes is of critical concern, particularly because of the production of greenhouse gases. Data presented here show that different primary producers in estuarine marshes have staggered growing seasons as a functional means of
This dissertation is dedicated to Frankie P and the Telly Monster who never really understood how to sternly say no. It taught me that I could accomplish whatever I put my mind to including
ACKNOWLEDGEMENTS
I would like to thank my advisor, Dr. Michael Piehler, for always being there when I needed him without being a helicopter advisor. You managed to strike that difficult balance between overbearing and uninvolved. I appreciate and admire your ability to let me make my own mistakes, but know when I was floundering and help me back on track. Your guidance has made me a better researcher and writer. Thank you.
To Suzanne Thompson for all of her help in the field and laboratory, editing my proposals and papers, and always supporting me, thank you. Without you, this dissertation would still be unorganized post it notes and broken dreams. You have been a great mentor, friend, lab manager extraordinaire, and decent human being. Thank you for being you.
To everyone that has donated time to help with my projects, mainly Ashley Smyth, Kaylyn Siporin, Corey Adams, Rebecca Schwartz, Caitlin White, and Lisa Couper, thank you for making this work not only possible, but enjoyable. I would like to specifically acknowledge Suzanne Thompson, Rachel Gittman, Beth Van Dusen, and Caitlin White for being first editors of my poorly written, panic stricken chapters. Your patience is unparalleled.
Young, Erin Voight, Gray Redding, Ian Kroll, J. Ridge, Jill Simmerman, Joey Crosswell, Joseph “Dangerous Stupid Crazy Legs” Morton, Justin Ito, Karrie Wempen, Kayryn, Kellen Lauer, Laura Brown, Lisa Couper, Lucy Zipf, Michael Simpson, Maria Vozzo, Matt Stacy, Methodical Matt, Michelle Brodeur, Momma Nys, Nater, Raul Gonzalez, Rachel Gittman, Rebecca
Schwartz, Reid Savid, Sara Coleman, the Sarahs, Shelby Marshall, and Stacy Zhang, you have made my time here worthwhile. Thank you to Brianne Wempen for being an excellent friend and stylist. Even though she accepts that I am a mad scientist, she has worked diligently to keep me from looking like one.
Thank you to Claude Lewis who kept me sane by being my partner in crime, agreeing to help me build a treehouse on private property without permission, and taking me to the Church of the Ocean every Sunday aka surfing. You are my rock.
Last, but certainly not least, I would like to thank my committee members, Dr. John Fear, Dr. Rachel Noble, Dr. Mary O’Connor, and Dr. Steve Whalen for all of their support and
PREFACE
TABLE OF CONTENTS
List of Tables ……….. xiii
List of Figures ………. xiv
List of Abbreviations and Symbols ….……… xvi
Chapter 1: Introduction ……….. 1
References ……… 5
Chapter 2: Denitrifiers in the coastal gradient: Potential contributions to the N2O budget………... 8
2.1 Introduction ………... 8
2.2 Methods ……….. 11
2.2.1 Study sites ……….. 11
2.2.2 Elevation surveys ………... 12
2.2.3 Denitrification ……… 13
2.2.4 Sediment characteristics ……….... 15
2.2.5 Integrating inundation time, denitrification rate, and oxygen presence ………. 15
2.2.6 Measuring locally, extrapolating globally ………. 17
2.2.7 Statistical analyses ………. 18
2.3 Results ……….... 18
2.3.1 Site characterization ………... 18
2.3.2 Denitrification potentials ………... 19
2.5 Conclusions ……….... 25
Tables ………..…... 27
Figures ……….…... 30
References ……… 37
Chapter 3: Effects of shoreline hardening on nitrogen processing in the estuarine marshes of the US mid-Atlantic coast ……….…...…...…... 43
3.1 Introduction ……….... 43
3.2 Methods ………...….... 46
3.2.1 Site descriptions ………... 46
3.2.2 Core collection and incubation ………...…... 47
3.2.3 Denitrification rates ………...….... 48
3.2.4 Additional site characteristics ………...…... 49
3.2.5 Statistical analyses ………... 50
3.3 Results ……….... 50
3.3.1 Membrane inlet mass spectrometry ………..…... 50
3.3.2 Nitrogen fluxes ………..….... 52
3.3.3 Organic matter content ………..…... 53
3.4 Discussion ………...…... 53
3.5 Conclusions ……….... 56
Tables ………...…… 57
Figures ……….…... 59
References ………...…... 66
4.1 Introduction ……….…... 71
4.2 Methods ………...…... 73
4.2.1 Study site ……….…... 73
4.2.2 Vegetation surveys ………..…... 73
4.2.3 Algae surveys ………..…... 73
4.2.4 Plotting primary producer distribution ……….. 74
4.2.5 Benthic chlorophyll-a ………..…... 74
4.2.6 Statistical analyses ………..…... 75
4.3 Results ……….…... 76
4.3.1 Bulkheads and algal richness, evenness, and seasonal distribution ... 76
4.3.2 Bulkheads and marsh vegetation richness and evenness ………... 76
4.4 Discussion ………...…... 77
4.5 Conclusions ……….…... 80
Tables ………...…... 81
Figures ………..…... 84
References ………... 91
Chapter 5: Warming affects macroalgal and microphytobenthic abundance .…...…... 94
5.1 Introduction ……….…... 94
5.2 Methods ………...…... 96
5.2.1 Sample collection ………... 96
5.2.2 Mesocosm preparation ………... 97
5.2.3 Assessing algal biomass ………..…... 98
5.5.5 Statistical analyses ………..…... 100
5.3 Results ……….…... 100
5.3.1 Macroalgae growth ……….…... 100
5.3.2 Microphytobenthic algae biomass ………..…... 101
5.3.3 Phytoplankton abundance ………...…... 101
5.2.4 Sediment organic matter ……….…... 102
5.2.5 Photosynthesis ……….…... 102
5.4 Discussion ………...…... 102
5.5 Conclusions ………... 107
Tables ………...…... 109
Figures ………..…... 111
References ………... 117
Chapter 6: Conclusions ………..…... 122
6.1 Nutrient cycling in estuarine marshes ……….…... 122
6.2 Primary production in estuarine marshes ………... 124
6.3 Recouping our losses ………..…... 125
Table ……...………... 127
LIST OF TABLES
2.1 Denitrification potential for the Rachel Carson and Currituck Banks Reserves ……... 27
2.2 Summary of denitrification studies in marsh systems ………... 28
2.3 N2O potential vs actual N2O flux ………... 29
3.1 Marsh widths for northern, central and southern sites ………... 57
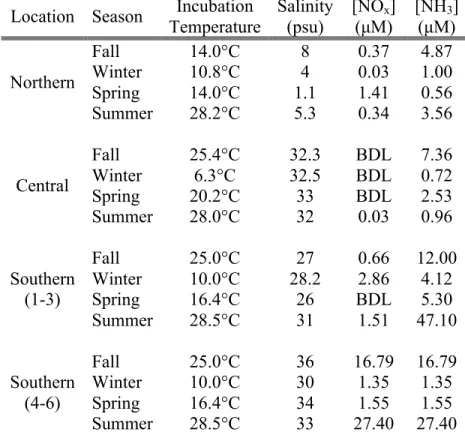
3.2 Water profiles for northern, central, and southern sites ………. 58
4.1 Characteristics of Bogue Sound sites ……… 81
4.2 Algal richness and evenness ...….……….. 82
4.3 Marsh vegetation richness and evenness ...……… 83
5.1 Photosynthetic data for microphytobenthos ……….. 109
5.2 Photosynthetic data for macroalgae ………... 110
LIST OF FIGURES
2.1 Conceptual diagram of denitrification pathways ……… 30
2.2 Map of sites in the Rachel Carson and Currituck Banks Reserves ………. 31
2.3 Elevation transect site locations and elevation plots ………... 32
2.4 Acetylene block experimental set-up ……….. 33
2.5 Sediment characteristics of the Rachel Carson and Currituck Banks Reserves ……. 34
2.6 Denitrification potentials by habitat and pharmaceutical treatment ………... 35
2.7 Partitioning of fungal and bacterial denitrification by habitat and oxygen presence .. 36
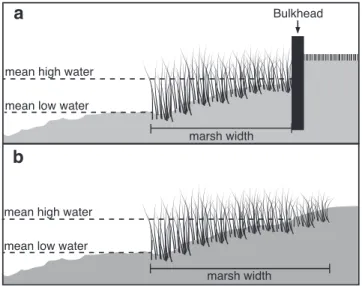
3.1 Marsh cross sections ………... 59
3.2 Site map for northern, central and southern sites ……… 60
3.3 Denitrification rates by season ……… 61
3.4 Yearly denitrification rates for site with and without marsh ……….. 62
3.5 Sediment oxygen demand for sites with and without marsh ……….. 63
3.6 Nitrogen fluxes for northern, central and southern sites ………. 64
3.7 Sediment organic matter content for sites with and without marsh ……… 65
4.1 Map of Bogue Sound sites ……….. 84
4.2 Diagram of transect establishment ……….. 85
4.3 Winter algae distribution ………. 86
4.4 Spring algae distribution ………. 87
4.5 Summer algae and marsh grass distribution ………... 88
4.6 Fall algae distribution ……….. 89
4.7 Benthic chlorophyll-a concentrations ………. 90
5.2 Experimental design of mesocosm incubations ……….. 112
5.3 Growth of algae and microphytobenthos ……… 113
5.4 Water column chlorophyll-a concentrations ………... 114
5.5 Sediment organic matter content in mesocosms ………..…………... 115
LIST OF ABBREVIATIONS AND SYMBOLS Abbreviations
15N
2 dinitrogen gas with 15N stable isotope 15NH
4+ ammonium with 15N stable isotope 15NO
3- nitrate with 15N stable isotope 63Ni radioisotope of nickel
A surface area
ABT acetylene block technique
AB N2O production from antibiotic treated cores ADENd anoxic denitrification potential
AEd area of exposed habitat
AF N2O production from antifungal treated cores
AFAB N2O production from antibiotic and antifungal treated cores AId area of inundated habitat
alt alterniflora
annamox anaerobic ammonium oxidation ANOVA analysis of variance
(aq) aqueous
Ar argon
B bacteria
BDL below detection limit
BH bulkhead
14C radioisotope of carbon
C element: carbon temperature: Celsius treatment: control Cin concentration of inflow
Cout concentration of outflow
CBR Currituck Banks Reserve chl-a chlorophyll-a
cyno cynosuroides
d water depth
DEN denitrification
DIC dissolved inorganic carbon
DPMs disintegrations per minute of sample
DPMT disintegrations per minute of radiolabelled seawater
exp experiment
F marsh width: fringing marsh/narrow microbe: fungi
rate: flux
g gram
GC gas chromatograph
h hour
ha hectare
HMa average anoxic denitrification potential
HMo average oxic denitrification potential
Ik irradiance at which photosynthesis is no longer light dependant
IMS Institute of Marine Sciences
L liter
LM low marsh
LMa average anoxic denitrification in the low marsh
LMo average oxic denitrification in the low marsh
ln natural log
M concentration: molar (moles/liter) marsh width: medium marsh MA macroalgae
MF maritime forest
m meter
mol mole
MPB microphytobenthos N element: nitrogen
marsh width: none/no marsh site: north/northern
N2 dinitrogen gas
N2O nitrous oxide
NE northeast site
NERR National Estuarine Research Reserve
NH3 ammonia
NH4+ ammonium
NO2- nitrite
NO3- nitrate
NOAA National Oceanic and Atmospheric Administration NOx nitrate + nitrite
O2 oxygen
ODENd oxic denitrification potential
P algae: photosynthetic rate sediment: porosity
pi proportion of area covered by species “i”
Pmax maximum photosynthetic rate
psu practical salinity units Q conversion factor, constant R reference marsh, no bulkhead RCR Rachel Carson Reserve
s seconds
S south
S. Spartina
SOD sediment oxygen demand SOM sediment organic matter
spp. species
ST subtidal
t time
Td duration of inundation it a given depth
U. Ulva
V volume of wet sediment Var variance
VTG volume of dry sediment
W marsh width: wide marsh site location: western site X2 Kruskal-Wallis chi-squared
y year
z core depth Prefixes
Symbols
° degree
Δ delta, change
> greater than < less than
% percent
α photosynthetic efficiency ± plus or minus
CHAPTER 1 Introduction
Historically, our need for water and the resources it provides such as food, transportation, and trade have determined our distribution and population. Currently, advances in technology have allowed us to move further from food and water resources without adverse impacts. Therefore, population distributions are indicative of “want” rather than “need”. According to NOAA’s National Ocean Service, “coastal counties constitute only 17% of the total land area, but account for 53% of the total population”. Coastal states receive about 85% of the tourist-related revenue in the US (World Almanac, 2001). In Carteret County, NC alone, tourism and travel revenue was approximately $278 million (CEDC, 2012). With beautiful views, fishing, hunting, and water sports, estuaries are popular coastal tourist attractions. The coastal
environment can provide vital ecosystem services including storm protection, flood control, nutrient regulation and processing, waste treatment, pollution control/detoxification, and habitat for important fisheries. According to Costanza et al. 1997, the ecosystem services provided by the estuary are worth $22,832 ha-1 yr-1. Although the value of this metric is hotly debated (Gatto and De Leo 2000), estuaries were the most valuable ecosystem assessed in the study, which included seagrass beds, coral reefs, and floodplains. Within the estuary, one of the primary habitats responsible for mitigating nutrient pollution, removing wastes, and shoreline
these habitats are taken for granted. While water resources have shaped our society, we in turn have altered these resources to suit our needs (Pastore et al. 2010). Anthropogenic stressors are significantly altering vital salt marsh habitat (Kearney et al. 1988; Kennish 2001). We directly change the hydrology and function of these environments through development (Bertness et al. 2002). Marshes are transient features. Development adjacent to the salt marsh, particularly shoreline armoring, can significantly decrease marshes’ resilience to environmental change by blocking migration and/or sediment supply. Indirectly, significant damage is caused as a result of sea level rise, global warming, and pollution (nutrients, noise, and light). Sea level rise threatens to drown marshes and is a significant contributor to habitat loss when marshes are unable to migrate upland or when sediment supplies are too low to maintain accretion
a baseline for comparing environmental change and 2.) understand how human actions alter the ecosystem function and services of salt marshes.
This dissertation focuses on the effects of anthropogenic stressors on the base of the food web, which includes 1.) assessing impacts of anthropogenic activities on nutrient processing and 2.) assessing interactions between primary producers as nutrient processing rates are altered. Nitrogen (N) is the primary limiting nutrient in salt marsh ecosystems (Howarth and Marino 2006). Therefore, N loading significantly contributes to eutrophication in coastal systems (Paerl 1995). Denitrification, which converts biologically active nitrates to relatively inert nitrogen forms, can help to mitigate nutrient enrichment in coastal systems (Kaplan et al 1979; Thompson et al. 1995; Koop-Jakobsen and Giblin 2010). However, denitrification pathways and end
is lost in these overly stressed environments, the abundance, diversity, and distribution of primary producers is altered. Chapter 4 examines changes in primary producer distribution as a result of bulkheading estuarine shoreline. If the interacting effects of upland development and sea level rise drown salt marshes completely, we expect to see a conversion of marsh ecosystems to shallow subtidal habitats. In this case, algae will replace marsh grass as the dominant primary producer. However, not all algae are created equal and palatability, size, life cycle, nutrient requirements, and seasonality differ among algae types. Increases in temperature are expected to continue along with sea level rise and coastal development. It is important to determine shifts in the quality of food source for higher trophic levels as temperatures increase and the hydrology of marshes is altered. Chapter 5 discusses shifts in algal groups and production as a function of increasing temperature.
REFERENCES
Banner A, Hyatt M (1973) Effects of noise on eggs and larvae of two estuarine fishes. T Am Fish Soc 102(1): 134-136
Bertness MD, Ewanchuk PJ, Silliman BR (2002) Anthropogenic modification of New England salt marsh landscapes. P Natl Acad Sci USA 99(3): 1395-1398
Carteret Economic Development Council (2012) Tourism Overview.
http://www.carteretedc.com/tourism.php. Accessed 12 December 2013
Costanza R, d-Arge R, de Groot R, Farber S, Grasso M, Hannon B, Limburg K, Naeem S, O’Niell RV, Purelo J, Raskin RG, Sutton P, van den Belt M (1997) The value of the world’s ecosystem services and natural capital. Nature 387:253-260
Dwyer RG, Bearhop S, Campbell HA, Bryant DM (2012) Shedding light on light: the importance of anthropogenic light to a nocturnally feeding shorebird. Journal Anim Ecol 82(2): 478-485
Field DW, Reyer AJ, Genovese PV, Shearer BD (1991) Coastal Wetlands of the United States An Accounting of a Valuable National Resource. National Oceanic and Atmospheric Administration
Gatto M, De Leo GA (2000) Pricing biodiversity and ecosystem services: The never-ending story. Bioscience 50(4): 347-355
Herbert RA (1999) Nitrogen cycling in coastal marine ecosystems. FEMS Microbiol Rev 23: 563-590
Howarth RW, Marino R (2006) Nitrogen as the limiting nutrient for eutrophication in coastal marine ecosystems: Evolving views over three decades. Limnol Oceanogr 51(1-2): 364- 376
IPCC (2007) Climate Change 2007: Synthesis Report. Contribution of Working Group I, II, and III to the Fourth Assessment Report of the Intergovernmental Panel on Climate Change [core writing team, Pachauri RK, Reisinger A (eds)] IPCC, Geneva
Kaplan W, Valiela I, Teal JM (1979) Denitrification in a salt marsh ecosystem. Limnol Oceanography 24(4): 726-734
Kearney MS, Grace RE, Stevenson JC (1988) Marsh loss in Nanticoke Estuary Chesapeake Bay. Geogr Rev 78(2): 205-220
via denitrification in salt marsh sediments. Limnol Oceanogr 55(2): 789-802 Longcore T, Rich C (2004) Ecological light pollution. Front Ecol Environ 2: 191-198
Mallin MA, Cahoon LB (2003) Industrialized animal production-a major source of nutrient and microbial pollution to aquatic ecosystems. Popul Environ 24(5): 269-385
National Oceanic and Atmospheric Administration (NOAA, 1998) online. “Population:
Distribution, Density, and Growth” by Culliton TJ. NOAA’s State of the Coast Report. NOAA, Silver Spring
Paerl HW, Pickney JL, Fear JM, Peierls BL (1998) Ecosystem reponses to internal and
watershed organic matter loading: consequences for hypoxia in the eutrophying Neuse River Estuary, North Carolina, USA. Mar Ecol-Prog Ser 166: 17-25
Paerl HW, Mallin MA, Donahue CA, Go M, Peierls BL (1995) Nitrogen loading sources and eutrophication of the Neuse River estuary, North Carolina: Direct and indirect roles of atmospheric deposition. UNC WRRI Project No. 20157 USGS Project No. 14-08-0001- G1899
Pastore CL, Green MB, Bain DL, Muoz-Hernandez A, Vorosmarty CJ, Arrigo J, Brandt S, Duncan JM, Greco F, Kim H, Kumar S, Lally M, Parolari AJ, Pellerin B, Salant N, Schlosser A, Zalzal K (2012) Tapping environmental history to recreate America’s colonial hydrology. Environ Sci Technol 44: 8798-8803
Reed DJ (1995) The response of coastal marshes to sea-level rise: Survival or submergence? Earth Surf Processes 20(1): 39-48
Roessig JM, Woodley CM, Cech JJ Jr., Hansen LJ (2004) Effects of global climate change on marine and estuarine fishes and fisheries. Rev Fish Biol Fisher 14: 251-275
Shoun H, Kim DH, Uchiyama H, Sugiyama J (1992) Denitrification by fungi. FEMS Microbiol Lett 94: 277-282
Silliman B, Grosholz E, Bertness MD (2009) Human Impacts on Salt Marshes: A Global Perspective. University of California Press, Los Angeles
Stralberg D, Brennan M, Calloway JC, Wood JK, Schile LM, Jongsomjit D, Kelly M, Parker VT, Crooks S (2011) Evaluating tidal marsh sustainability in the face of sea-level rise: a hybrid modeling approach applied to San Francisco Bay. PLoS ONE 6(11): 6e2388. doi:10.1371/journal.pone.0027388
Teal J, Teal M (1969) Life and death of the salt marsh. Audubon/Ballantine Books, New York Thompson SP, Paerl HW, Go MC (1995) Seasonal patterns of nitrification and denitrification in
Valiela I, Bowen JL (2001) Nitrogen sources to watersheds and estuaries: role of land cover mosaics and losses within watersheds. Environ Pollut 118: 239-248
Watzin MC, Gosselink JG (1992) The Fragile Fringe: Coastal Wetlands of the Continental United States. Technical Report, Louisiana Sea Grant Program, Louisiana State
University, Baton Rouge, Louisiana, US Fish and Wildlife Service, Washington DC, and the National Oceanic and Atmospheric Administration, Rockville
CHAPTER 2
Denitrifiers in the coastal gradient: Potential contributions to the N2O budget
2.1 Introduction
Human modification of the nitrogen cycle has been extraordinary (Vitousek et al. 1997). Watershed development, agricultural waste, concentrated animal feeding operations, storm releases of raw sewage, and urban run-off are significant contributors of nitrogen loading to watersheds (Valiela and Bowen 2001; Mallin and Cahoon 2003). As nitrogen (N) loading to coastal zones continues to rise, N sinks and the processes that remove N from the system become increasingly important. Denitrification (DEN) is a microbially mediated process by which nitrate (NO3-, biologically active) is converted to N2 (mostly biologically inactive; Herbert, 1999). Many studies have shown that DEN in estuarine marshes is an important process for the mitigation of N loading to coastal watersheds (Kaplan et al. 1979; Thompson et al. 1995; Koop-Jakobsen and Giblin 2010). For example, a study by Hammersley and Howes, 2003, has shown that DEN can account for 46% of ammonium loss through coupled nitrification/DEN and over half of algal N in estuarine marshes is remineralized and denitrified.
Denitrification in coastal systems was previously assumed to be predominately bacteria-mediated denitrification (B-DEN). However, recent studies have shown that
marsh grass detritus (Benner et al. 1984; Buchan et al. 2003; Newell et al. 1987; Currin et al. 1995) and aerobic decomposition in the marsh grass canopy rather than benthic nutrient cycling. Few studies have investigated the process of F-DEN in estuarine or marine systems (Jebaraj and Raghukumar 2010; Sumathi and Raghukumar 2009) and none have directly linked F-DEN to N2O production in intertidal zones. However, N2O flux in estuarine systems has been measured in estuarine marshes (Smith and DeLaune 1983; Smith et al. 1983) and near shore marine
sediments (Seitzinger et al. 1980) and modeled for global estuarine budgets (Kroeze et al. 2005). According to a recent study by Mohamed and Martiny (2011), fungal diversity and abundance in estuarine marshes is comparable to freshwater systems. Many species capable of DEN (Shoun et al. 1992) such as Fusarium spp., Giberella spp, Chaetomium spp, Trichoderma viride, Botrytis cinerea, and Cylindroscarpon spp. are found in coastal sediments (Pugh 1962; Gessner and Kohlmeyer 1976). Together, these pieces of the puzzle indicate that we are potentially missing a large part of the DEN story by neglecting F-DEN.
products, such as N2O and reduced denitrification rates (Francis and Mankin 1977; Glass et al. 1997). In contrast, F-DEN readily occurs in aerobic conditions. Fungi are capable of concurrent respiration and DEN (Shoun et al. 1992). Because anaerobic conditions are not necessary for the process to occur, F- DEN may be favored over B-DEN in high marsh and maritime forest
habitats. In addition, while some fungi are capable of complete DEN (end product, N2), most F-DEN results in N2O (Shoun et al. 1992) regardless of ambient NO3- levels. F-DEN can use other forms of N as substrate including organic-N, such as amino acids, aniline, or azides (Shoun et al. 1992). Therefore, unlike B-DEN which requires ambient NOx supplied from the water column or by the rate limiting process of nitrification, F-DEN may be a significant contributor to DEN in systems which are N-limited, such as estuarine marshes.
Current estimates of DEN in estuarine marsh systems have not distinguished F-DEN from B-DEN. Studies in terrestrial systems have shown that shifts from fungal to bacterial-dominated communities results in decreased residence time of nutrients (Bardgett et al. 2006; Wardle et al. 2004a; DeVries et al. 2006; Gordon et al. 2008; De Vries et al. 2011). This
indicates that fungal nutrient cycling is slower and more conservative in nutrient uptake (Van der Heijden et al. 2008; Wardle et al. 2004b). Changes in estuarine marsh characteristics, such as changes in nutrient availability or tidal range, could ultimately affect distributions of F- and B-DEN and impact rates of nutrient cycling. Knowing the distribution of B-DEN activity across the estuarine marsh elevation gradient is important as we directly impact these habitats with
development and indirectly affect function with climate change and sea level rise.
My objectives were to assess DEN potentials in upland coastal habitats, which have been previously understudied, distinguish between fungal and bacterial denitrification across the
In addition, I wanted to use data collected to estimate the potential of F-DEN to contribute to the global N2O budget. I measured DEN from areas of high elevation, low inundation (maritime forest) to areas of low elevation, high inundation (shallow subtidal) to test the hypothesis that shifts in total DEN rate and production of N2O coincide with changes in the relative rates of F-DEN and B-F-DEN. I hypothesized that F-F-DEN and B-F-DEN potentials would be inversely related, with F-DEN dominating at higher elevations (maritime forest, high marsh) and decreasing in importance with decreasing elevation. Conversely, B-DEN would dominate at lower elevation (low marsh, subtidal) and decrease in importance with increasing elevation. These measured rates were then used to model denitrification across the coastal gradient and extrapolate to yearly DEN rates within each reserve.
2.2 Methods 2.2.1 Study Sites
forest is sparse. Horses are common on the island and can significantly impact marsh vegetation density as well as local sediment compaction (Hay and Wells 1988; Axford et al. 2013).
Additional information as well as habitat maps of the RCR can be found in Fear et al. (2008). The Currituck Banks Reserve (CBR) is located north of Corolla, NC on the soundside near the end of Highway 12 (Figure 2.2b). The CBR tidal cycles are predominantly wind driven, the average salinity is 3.5 psu (Caldwell 2001), and the sediment has not been significantly altered by dredge spoil. Natural vegetation cover has changed due to the invasion of Phragmites in this normally Juncus gerardi dominated marsh. Transects were established in areas
dominated by Juncus gerardi. Horses can also be found at this site, but in contrast to the horses at the RCR, appear to spend most of their time in the vast maritime forest as shown by the lack of horse trails in the marsh site (personal observation). However, the marsh is more likely impacted by feral hogs. Additional information as well as habitat maps of the CBR can be found in Fear et al. (2008).
2.2.2 Elevation surveys
recorded water depth through tidal cycles at 20 minute intervals for 3 months. HOBOs were deployed at the end of site SE’s center transect in the RCR and site C’s center transect in the CBR. With surface area/elevation maps and water depth, area inundated or exposed was
determined. Duration of inundation was determined by successive HOBO depth measurements. 2.2.3 Denitrification
DEN experiments were replicated 4 times from each reserve (8 total) during summer (2012 and 2013) when peak DEN rates are typically observed (Piehler and Smyth 2011;
O’Meara et al. in review, Thompson et al. 1995). Acetylene block methods (ABT) adapted from Thompson et al. 1995 were used to measure control DEN (C-DEN), F-DEN, and B-DEN (Figure 2.4). Control DEN is calculated from unaltered sediment, i.e. contains active bacteria and fungi. Large sediment cores (6.4 cm in diameter) were collected along established elevation transects from each of four habitats: MF, HM, LM, and ST. Location of each collection point was referenced to autolevel data to determine elevation. The cores were returned to the Institute of Marine Sciences in Morehead City, NC and allowed to equilibrate to laboratory temperature (25°C) overnight. After ~18 hours, large cores were subcored (12mm diameter, 1cm depth) and placed into 60 mL scintillation vials. Nutrient solutions of 100µM NH4NO3 and 100µM glucose in filtered site (GF/F filters; Whatmann, 47mm) water were added to each vial to obtain potential rates in slurry incubations. ABT measurements are not 100% efficient at blocking the
(antibiotic solution) and B-DEN solutions were spiked with 0.2 mg of cycloheximide/L (antifungal solution) and shaken to homogenize the sample.
Serum vials were capped with rubber septa and either purged of oxygen (to induce anoxia) or left with atmospheric oxygen concentrations. DEN potential in the ST habitat was only assessed with anoxic incubations because we chose sites that were constantly inundated and rarely experienced aerobic conditions. Acetylene (3 mL/vial) was injected through the septa to block the reduction of N2O to N2 (i.e. force incomplete DEN; Buesing and Gessner 2006). Duplicate cores were sampled at 0, 3, and 6 hours and analyzed for N2O concentration using a 63Ni electron capture detector (ECD Shimadzu GC-2014; Seo and DeLaune 2010). Once
sampled, a vial was not reused for successive measurement. Serum vials were shaken before each sampling. DEN potential rates were calculated as the slope of N2O generated/incubation time (0, 3, or 6 hours). To account for N2O production from non-DEN sources, samples without acetylene were incubated simultaneously and subtracted from calculated DEN potentials. Errors of slope were determined by standard error propagation.
Optimal pharmaceutical concentrations were measured in a preliminary incubation experiment. Methods were adapted from substrate-induced respiration inhibition (SIR)
procedures outlined in Anderson and Domsch (1975) and adapted by Seo and DeLaune (2010) using N2O production instead of CO2 production. Using the additive ratio
1= [!!(!"!!!"!#! !!)!" ] (2.1)
where C is N2O evolved from the control, AF is N2O evolved from the sediment treated with cycloheximide, AB is the amount of N2O evolved from the streptomycin treatments, and AFAB is the N2O evolved when both are added to the sediment. Controls did not contain any
oxygen level. Serum vials were prepared and incubated as described above. While this pre-experiment optimized pharmaceutical concentration, it does not optimize temporal pharmaceutical additions, which was not addressed in this study.
2.2.4 Sediment characteristics
Sediments were characterized by measured porosity and sediment organic matter (SOM). Sediment samples for porosity and SOM content were collected from each habitat adjacent to denitrification cores. Porosity was measured using equation 2.2:
𝑃 =100 !!!!"
! =100 1−
!!"
! (2.2)
where P is porosity, V is volume of wet sediment, and VTG is volume of dried sediment.
Sediment samples were collected using a 60 mL syringe to 2.5 cm depth to keep a constant wet volume and dried at 105°C for 4 hours. Dried sediment volume was measured by water
displacement in a graduated cylinder (Pettijohn 1938).
SOM percentages were measured using loss on ignition (Ball 1964). Samples were dried at 105°C for 4 hours and combusted at 525°C for 4 hours. SOM content was determined using equation 2.3:
𝑆𝑂𝑀%=100 !!!
! (2.3)
2.2.5 Integrating inundation time, DEN rate, and oxygen presence
(HOBO data) were blocked into 1cm increments and summed to determine total time water level remained at each 1cm depth. Water level and surface area were combined to determine total area inundated (anoxic) or exposed (oxic) for a given water depth as well as duration of inundation. Exposed does not always equal oxic and inundated does not always equal anoxic because of the diffusion of oxygen (Hofman et al. 1991), bioturbation (Gribsholt et al. 2003), and formation of anoxic/oxic microzones (Koop-Jakobsen and Giblin 2010; Helmer and Kunst 1998). The rates of these processes are highly heterogeneous throughout the marsh, difficult to assess on larger scales, and can cause fluctuations towards anoxic or oxic conditions. Therefore, to generalize across larger spatial scales, oxygen presence was assumed to be directly related to atmospheric exposure. The relationship between anoxic and oxic C-DEN potential and elevation for was used to determine total potential (oxic + anoxic) at each 1cm water depth. Total N processing for the duration of the experiment (mmol/exp) was determined for each site by equation 4:
!!"# !
!"# = (𝐴𝐼!)(𝑇! !!!
!!! )(𝐴𝐷𝐸𝑁!) 𝑧 + !!!!!!(𝐴𝐸!)(𝑇!)(𝑂𝐷𝐸𝑁!) 𝑧 (2.4) where d is water depth (m), AId is area inundated at depth i (m2), Td is the amount of time water is at depth i (hr), ADENd is the anoxic DEN potential at depth i (µmol N m-3 hr-1), z is the core depth (0.01m), AEd is area exposed (m2), and ODENd is oxic DEN potential at depth i (µmol N m-3 hr-1). The first term is the total anoxic potential and the second is the oxic potential. The sum equals the total potential of each transect.
(freshwater wetlands) habitats because they were not assessed in this study. Shoreline distances were independent of tidal height because they were based on visual identification of emergent vegetation. Since inundation time was not measured for the entire reserve, it was not possible to use the model to determine whole reserve DEN potential. Instead, percent time inundated (for distribution of anoxic and oxic DEN) and C-DEN potentials for each habitat was averaged across sampling trips (4 total for each reserve). Estimates are based on a 12-hr day because rates were measured in the lab to represent dark conditions only. In addition, since rates were measured in the summer when potentials were greatest, annual rates were limited to a 6-month year to account for significant decreases in DEN rate with temperature based on previous studies in similar locations (Piehler and Smyth 2011; O’Meara et al. in review; and Thompson et al. 1995). 2.2.6 Measuring locally, extrapolating globally
With approximately 4 million acres of estuarine marsh in the US (Field et al. 1991) and 3.46E8 acres worldwide (Duarte et al. 2008), F-DEN has the potential to be a significant source of N2O on a global scale. MF and ST contributions were excluded from calculations based on a lack of accurate estimates of US or global coverage. A 1:1 ratio was assumed between oxic and anoxic potential and estuarine marsh area included both HM and LM. Therefore:
𝑈𝑆 𝑜𝑟 𝐺𝑙𝑜𝑏𝑎𝑙 𝑇𝑜𝑡𝑎𝑙 = !"!! !"!! !"!! !"!
calculation. As in the total reserve DEN potential methodology explained above, a 12-hr day and a 6-month year were assumed.
2.2.7 Statistical Analyses
All statistics were run in R (Version 2.8.2008-12-19). Percentage data (SOM and porosity) were transformed using arcsin square root. Homogeneity of variance was determined using Levene’s test and normality was determined with a Shapiro-Wilk test. ANOVAs were run for all data which fit the assumptions of the test and a Tukey post-hoc was used to assess
significant differences between groups. If data required a non-parametic test, a Kruskal-Wallis was used. Data analyzed with an ANOVA is denoted with a F-value and Kruskal-Wallis data is shown with a chi-squared value (X2).
2.3 Results
2.3.1 Site characterization
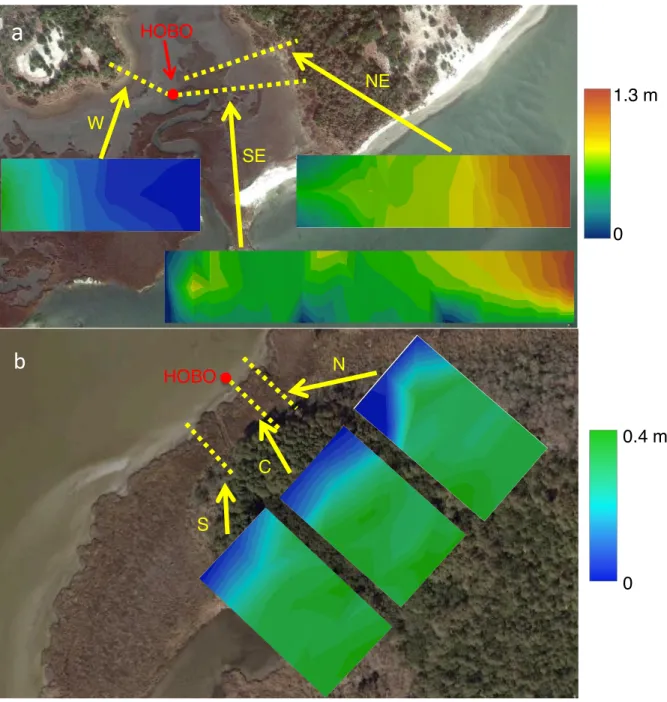
Marsh elevation slopes (from the ST to the MF) ranged from 0.003 to 0.016 in the RCR and 0.008 to 0.01 in the CBR. The overall elevation change for RCR was between 0.17m and 1.28m. Currituck Banks elevation change ranged from 0.31-0.39m (Figure 2.3).
correlated (R2=0.3393, p<0.01). However, there was no significant correlation between SOM or porosity and DEN, F-DEN, or B-DEN potential.
2.3.2 Denitrification potentials
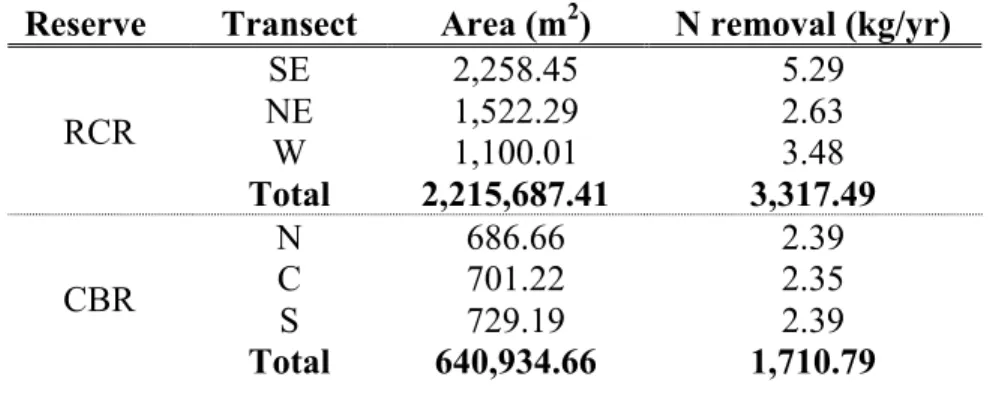
df=2, F=.12, p=0.89). Total N removal rates were higher for the RCR than CBR both by transect and reserve totals (Table 2.1). The variation among transects was higher in the RCR then the CBR, but this is indicative of differences in transect area rather than DEN rates. Areal DEN potential for the RCR and CBR reserve were 1.50 g m-2 yr-1 and 2.67 g m-2 yr-1 respectively.
Combined F-DEN and B-DEN values were typically higher than C-DEN potentials. The slope of F-DEN +B-DEN vs C-DEN, should be equal 1 if the two potentials agreed perfectly. The slope of B-DEN + F-DEN vs C-DEN was 0.67 in the RCR and 2.26 in the CBR. Due to this discrepancy, percentage contributions reported are based on the sum of F-DEN and B-DEN rather than C-DEN potential. In the RCR, anoxic B-DEN contributions were greater than F-DEN contributions with the exception of the ST where F-F-DEN was dominant (Figure 2.7a). Anoxic B-DEN was greatest in the MF and LM and lowest in the HM and ST. F-DEN
contributions were greater than B-DEN under oxic conditions except in the LM where B-DEN was greater.
DEN potentials in the CBR were dominated by fungi in both anoxic and oxic conditions with the exceptions of the anoxic ST and oxic LM where bacteria were the dominant denitrifiers (Figure 2.7b). Under oxic conditions, F-DEN contributions tended to decrease as elevation decreased and B-DEN increased with decreasing elevation. Under anoxic conditions, F-DEN was greatest in the HM and LM and decreased with both increasing and decreasing elevation.
2.4 Discussion
of low inundation were predicted to show elevated DEN potentials when inundated (especially when dominated by B-DEN) because it provided the anoxic conditions rarely seen in these environments. Since oxic conditions are dominant in these upland habitats, we expected to see a higher proportion of F-DEN since fungi can denitrify in oxic conditions. Conversely, the low elevation habitats of high inundation should have greater DEN potentials under oxic conditions because they are low in oxidized N sources and therefore limited by nitrification. B-DEN was expected to dominate in these reduced habitats because bacteria can out compete fungi in anoxic conditions (van der Valk 2012; Alexander 1977; Kendrick and Parkinson 1990; Gareth Jones and Pang 2012). Results from this study supported some of these patterns. In the RCR MF, high anoxic B-DEN potentials were measured as expected, but the relatively low oxic F-DEN
potentials were not anticipated. In the CBR, higher oxic F-DEN potentials were observed in the HM, but B-DEN was not dominant in the LM. Therefore, oxygen presence may not have been the primary regulator of potential DEN. Neither porosity nor SOM correlated with F-DEN or B-DEN potentials. Sediment nutrient concentrations between habitats or reserves should not have affected DEN rates since samples were incubated in nutrient and carbon enriched site water. One variable not assessed was total concentration of microbial cells. Further study is necessary to determine how DEN rate is affected by microbial species, abundance, and activity. While potential may be a crude estimate of population size, it cannot assess the relative abundance of individual species.
Maghalaes et al. 2005). My results also showed an inverse relationship between DEN and salinity, but are probably explained by Smith et al. 1983 who found N2O flux increased as salinity decreased, which may be attributed to an increase in F-DEN rates. While B-DEN rates were similar between the CBR and the RCR, F-DEN rates differed between the two sites. It is possible that B-DEN potential was consistent across salinity, but F-DEN potentials increased overall DEN rates in the fresher CBR.
Percent contributions (Figure 2.7) of fungi and bacteria to potential denitrification were calculated independently of C-DEN potentials (Figure 2.6), but C-DEN potentials mimicked DEN potentials of the dominant microbe group. In the RCR, bacteria accounted for a greater proportion of combined DEN potential in anoxic conditions while fungi dominated under oxic conditions (Figure 2.7a). When compared to C-DEN in the RCR (Figure 2.6a), anoxic C-DEN potentials resembled anoxic B-DEN potentials (Figure 2.6c) and oxic C-DEN potentials were most similar to oxic F-DEN potentials (Figure 2.6e) in habitat pattern and proportion. In the CBR, where fungi dominated both oxic and anoxic DEN potentials (Figure 2.7b), C-DEN potentials shared similar patterns as F-DEN potentials (Figure 2.6f). These comparisons show that F-DEN can be distinguished from B-DEN in coastal systems using this experimental
approach and that measuring N2 production alone may not fully characterize DEN, particularly in less saline systems where fungi are dominant.
100% efficient. Sorption, flocculation, and settling of pharmaceuticals can hinder their efficacy (Peterson et al. 2008). These effects were minimized though short incubation times (6 hours) and regular shaking of the slurries between samples, but assessing the activity of both fungi and bacteria will be important for the future. Different species of microbes vary in their response to streptomycin and cycloheximide and non-target effects can alter treatments (Badalucco 1994). Samples were collected from the same site and each treatment was replicated to reduce
differences in the microbial population. The threshold for error between replicated was 10%. However, I did not need to remove any samples based on this criterion. In addition, non-target effects were addressed by using nutrient enriched water and a short incubation time. One of the main issues with the use of pharmaceuticals to measure relative contributions of microbes to soil processes is their degradation products, which can be used as nutrient rich substrate. Since these samples were already supplemented with nutrients, the increased supply in pharmaceutical treatments should be minimal in comparison. Badalucco et al. (1994) found that streptomycin and cycloheximide were effective at killing soil microorganisms for incubation times less than 2 days and became substrate for microbial processes for longer incubations. With an incubation time of 6 hours, these samples are within the assessed temporal range, but further temporal optimization of pharmaceutical addition is necessary to ensure the efficacy of these treatments.
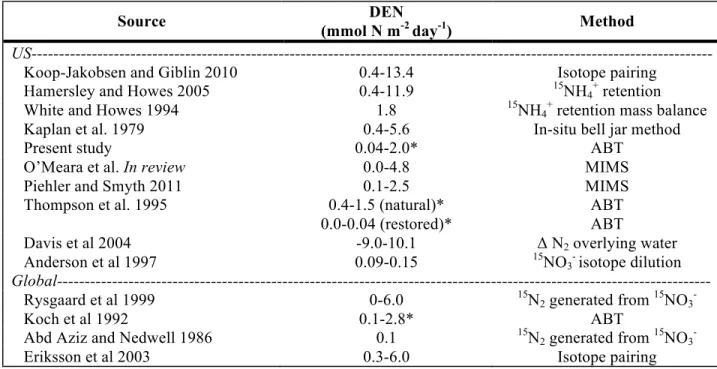
DEN potential and DEN rates can be measured in many ways. Each method has its advantages and disadvantages. However, results in similar systems are comparable (Table 2.2). Studies by Piehler and Smyth 2011, O’Meara et al. in review, Thompson et al. 1995 were
Hamersley and Howes 2005; White and Howes 1994; Kaplan et al. 1979), Rhode Island (Davis et al. 2004), and Virginia (Anderson et al. 1997). This indicates that these results may be
applicable to other North American estuarine marshes. In addition, these results are comparable to studies conducted in England (Koch et al. 1992; Abd Aziz and Nedwell 1986), Italy (Erikkson et al. 2003), and Denmark (Rysgaard et al. 2005), which shows wider geographical relevance.
estuarine marshes. While these processes would be reflected in directly measured N2O fluxes, they would not be observed in DEN potentials.
2.5 Conclusions
process in the ST under more saline conditions (RCR). In addition, N-loading to estuarine marsh habitats is increasing, which can make B-DEN less efficient and produce more intermediates. Therefore, as we continue to alter coastal environments, we may see a decrease in DEN potential, but an increase in proportion of N2O produced relative to N2.
The information presented here is merely the beginning. To understanding denitrification across the entire coastal gradient and the relative contributions of fungi and bacteria, further study is warranted. Future project should include, but are not limited to, assessing microbial species distributions and abundance, measuring denitrification potentials at in-situ temperatures and ambient light conditions, determining the individual and interacting effects of increased
TABLE 2.1: Yearly DEN potential for each site and reserve totals
Reserve Transect Area (m2) N removal (kg/yr)
RCR
SE 2,258.45 5.29
NE 1,522.29 2.63
W 1,100.01 3.48
Total 2,215,687.41 3,317.49
CBR
N 686.66 2.39
C 701.22 2.35
S 729.19 2.39
TABLE 2.2: DEN studies conducted in salt marshes in the US and the world. * indicates potential rather than directly measured rates
Source DEN
(mmol N m-2 day-1) Method
US---
Koop-Jakobsen and Giblin 2010 0.4-13.4 Isotope pairing
Hamersley and Howes 2005 0.4-11.9 15NH4+ retention
White and Howes 1994 1.8 15NH4+ retention mass balance
Kaplan et al. 1979 0.4-5.6 In-situ bell jar method
Present study 0.04-2.0* ABT
O’Meara et al. In review 0.0-4.8 MIMS
Piehler and Smyth 2011 0.1-2.5 MIMS
Thompson et al. 1995 0.4-1.5 (natural)* ABT
0.0-0.04 (restored)* ABT
Davis et al 2004 -9.0-10.1 Δ N2 overlying water
Anderson et al 1997 0.09-0.15 15NO3- isotope dilution
Global---
Rysgaard et al 1999 0-6.0 15N2 generated from 15NO3
Koch et al 1992 0.1-2.8* ABT
Abd Aziz and Nedwell 1986 0.1 15N
2 generated from 15NO3
TABLE 2.3: Comparison of N2O potential measured in NC to global salt marsh N2O fluxes.
Source (mmol N mF-DEN potential -2 day-1) (Gg N/yr) US total Global Total (Tg N/yr)
RCR 0.3 ± 0.16 12.9 ± 6.9 1.1 ± 0.6
CBR 0.8 ± 0.42 33.0 ± 17.2 2.9 ± 1.5
Kroeze et al. 2005 --- --- 0.25
Smith et al. 1983 0.006-0.009 0.5-0.9 0.04-0.07
FIGURE 2.1: Conceptual diagram of fungal and bacterial denitrification. To the left are substrates used for denitrification. The different boxes indicate need for oxic or anoxic
conditions (note that fungi can denitrify under either scenario). To the right are the products of denitrification. Solid lines indicate dominant pathways. Dashed lines indicate secondary pathways.
Bacteria
Fungi
oxic
anoxic
Organic N
NO3
-N2O
FIGURE 2.3: Transect data from the RCR (a) and CBR (B). Each GIS generated map edge as well as the center of the map represents a transect for a total of three transects per site.
1.3 m
0
HOBO
NE
SE
W
0.4 m
0
HOBO
S
C
N
a
FIGURE 2.4: ABT core treatments. Different colored circles denote different pharmaceutical treatments to isolate bacteria, fungus, or neither (control, both present). Boxes indicate oxygen presence or absence in the samples. Finally, the number in each core refers to hours of
incubation before the core is sacrificed to analyze for N2O concentration.
Anoxic Oxic
0
0
0
3
3
3
6
6
6
0
0
0
3
3
3
6
6
6
B only
F only
FIGURE 2.5: Soil characteristics of both sites. CBR characteristics are in gray (a and b) and RCR data is shown in white (c and d). Letter distinguishes statistically significant values.
Porosity (% void space)
SOM (%)
0 50
0 50 100
MF HM LM ST
B
C
A B
B
C
A A
c
d
MF HM LM ST
C
A B B
AB
A
B AB
a
FIGURE 2.6 DEN potentials by habitat for C-DEN (a, b), B-DEN (c, d) and F-DEN (e, f) for both oxic and anoxic conditions. RCR data is shown in white and CBR data is shown in gray. Letters denote statistically significant groups. * indicates a significant difference between oxic and anoxic DEN potential.
DEN potential (mmol m
-2 day -1)
B *
B B A b * a Anoxic Oxic 0 0.5 1 1.5 2 Anoxic Oxic 0 0.5 1 1.5 2 0 0.5 1 1.5 2
MF HM LM ST MF HM LM ST
c e d f C-DEN B-DEN F-DEN B B AB A B A AB
B *
A B
B B
FIGURE 2.7: Relative contributions of F-DEN and B-DEN in anoxic and oxic conditions for the RCR (a) and CBR (b).
% contribution to DEN potential
0 50 100 0 50 100
a RCR
b CBR
elevation above HOBO (m)
1
0.5
0
1
0.5
0
Anoxic
Oxic
Bacteria
Fungi
Elevation
REFERENCES
Abd Aziz SA, Nedwell DB (1986) The nitrogen cycle of an east coast UK saltmarsh. II. Nitrogen fixation, nitrification, denitrification, tidal exchange. Estuar Coast Shelf S 22:689-704 Alexander M (1977) Introduction to soil microbiology, 2nd ed. John Wiley & Sons, New York. Anderson J, Domsch KH (1975) Measurement of bacterial and fungal contributions to
respiration of selected agricultural forest soils. Can J Microbiol 21: 314-322
Axford J, Dawson M, Brown D (2013) The ecology of wild horses and their environmental impact in the Victorian Alps. Parks Victoria
Badalucco L, Pomaré F, Grego S, Landi L, Nannipieri P (1994) Activity and degradation of streptomycin and cycloheximide in soil. Biol Fertil Soils 18: 334-340
Ball DF (1964) Loss-on-ignition as an estimate of organic matter and organic carbon in non- calcareous soils. Soil Sci 15(1): 84-92
Bardgett RD, Smith RS, Shiel RS, Peacock S, Simkin JM, Quirk H, Hobbs PJ (2006) Parasitic plants indirectly regulate below-ground properties in grassland ecosystems. Nature 439: 969-972
Benner R, Newell SY, Maccubbin AE, Hodson RE (1984) Relative contribution of bacteria and fungi rates of degradation of lignocellulosic detritus in salt-marsh sediments. Applied and Environmental Microbiology 48(1): 36-40
Buchan A, Newell SY, Butler M, Biers EJ, Hillibaigh JT, Moran MA (2003) Dynamics of bacterial and fungal communities on decaying salt marsh grass. Applied and Environmental Microbiology. 69(11): 6676-6687
Buesing N, Gessner MO (2006) Benthic bacterial and fungal productivity and carbon turnover in a freshwater marsh. Appl Environ Microb 72(1): 596-605
Caldwell WS (2001) Hydrologic and salinity characteristics of Currituck Sound and selected tributaries in North Carolina and Virginia, 1998-99. USGS, Water-Resources
Investigation Report: 01-4097. USGS, Denver
Currin CA, Newell SY, Paerl HM (1995) The role of standing dead Spartina alterniflora and benthic microalgae in salt marsh food webs: considerations based on multiple stable isotope analysis. Mar Ecol-Prog Ser 121: 99-116
Davis JL, Nowicki B, Wigand C (2004) Denitrification in fringing salt marshes of Narragansett Bay, Rhode Island, USA. Wetlands 24: 870-489
grasslands with contrasting nitrogen management. Soil Biol Biochem 38:2092-2103 De Vries FT, Van Groenigen JW, Hoffland E, Bloem J (2011) Nitrogen losses from two
grassland soils with different fungal biomass. Soil Biol Biochem 43:997-1005 Duarte CM, Dennison WC, Orth RJ, Carruthers TJB (2008) The Charisma of Coastal
Ecosystems: Addressing the Imbalance. Estuaries and Coasts: J CERF 31:233-238 Eriksson, PG, Svensson JM, Carrer GM (2003) Temporal changes and spatial variation of soil
oxygen consumption, nitrification and denitrification rates in a tidal salt marsh of the Lagoon of Venice, Italy. Estuar Coast Shelf Sci 58: 861-871
Fear JM, Thompson SP, Gallo TE, and Paerl HW (2005) Denitrification rates measured along a salinity gradient in the eutrophic Neuse river estuary, North Carolina, USA. Estuaries 28(4): 608-619
Fear J (2008) A comprehensive site profile for the North Carolina Estuarine Research Reserve. www.nerrs.noaa.gov/Doc/PDF/Reserve/NOC_SiteProfile.pdf. Accessed on December 23, 2013
Field DW, Reyer AJ, Genovese PV, Shearer BD (1991) Coastal Wetlands of the United States An Accounting of a Valuable National Resource. National Oceanic and Atmospheric Administration.
Francis CW, Mankin JB (1977) High nitrate denitrification in continuous flow-stirred reactors. Water Res 11: 289-294
Gareth Jones EB, Pang KL (2012) Marine Fungi and Fungal-Like Organisms. Walter de Gruyter, Boston
Gessner RV, Kohlmeyer J (1976) Geographical distribution and taxonomy of fungi from salt marsh Spartina. Can J Bot 54: 2023-2037
Glass C, Silverstein J, Oh J (1997) Inhibition of denitrification in activated sludge by nitrite. Water Environ Res 69(6): 1086-1093
Giblin AE, Weston NB, Banta GT, Tucker J, Hopkinson CS (2010) The effects of salinity on nitrogen losses from an oligohaline estuarine sediment. Estuar Coasts 33:1054-1068 Gordon H, Haygarth PM, Bardgett RD (2008) Drying and rewetting effects on soil microbial
community composition and nutrient leaching. Soil Biol Biochem 40: 302-311
Gribsholt B, Kostka JE, Kristensen E (2003) Impacts of fiddler crabs and plant roots on sediment biogeochemistry in a Georgia salt marsh. Mar Ecol Prog Ser 259: 237-251
Hammersley MR, Howes BL (2003) Contribution of denitrification top nitrogen, carbon, and oxygen cycling in tidal creek sediments of a New England salt marsh. Mar Ecol Prog Ser 262: 55-69
Hay M, Wells J (1998) Effects of feral horses on the production, distribution, abundance, and stability of salt marsh plants: Rachel Carson component of the National Estuarine Research Reserve. Final Report for NOAA grant NA87AA/AA-D-CZ023
Helmer C, Kunst S (1998) Simultaneous nitrification/denitrification in an aerobic biofilm system. Water Sci and Technol 37(4-5): 183-187
Herbert RA (1999) Nitrogen cycling in coastal marine ecosystems. FEMS Microbiol Rev 23: 563-590
Hofman PAG, SA de Jong, EJ Wagenvoort, AJJ Sandee (1991) Apparent sediment diffusion coefficients for oxygen and oxygen consumption rates measured with microelectrodes and bell jars: applications to oxygen budgets in estuarine intertidal sediments. Mar Ecol Prog Ser 69: 261-272
IPCC (2003) Climate Change 2001. Chapter 4.2.1.2 Nitrous oxide (N2O).
http://www.grida.no/publications/other/ipcc_tar/. Accessed 28 November 2013.
IPCC (2007) Climate Change 2007: Working Group I: The Physical Science Basis. 2.10.2 Direct Global Warming Potentials.
http://www.ipcc.ch/publications_and_data/ar4/wg1/en/ch2s2-10-2.html
Jebaraj CS, Raghukumar C (2010) Nitrate reduction by fungi in marine oxygen-depleted laboratory mesocosms. Bot Mar 53: 469-474
Kaplan W, Valiela I, Teal JM (1979) Denitrification in a salt marsh ecosystem. Limnol Oceanography 24(4): 726-734
Kendrick WB, Parkinson D (1990) Soil fungi, p. 49-68. In DL Dindall (ed) Soil Biology Guide. John Wiley & Sons, New York
Koch MS, Maltby E, Oliver GA, Bakker SA (1992) Factors controlling denitrification rates of tidal mudflats and fringing salt marshes in South-west England. Estuar Coast Shelf S 34:471-485
Koop-Jakobsen K, Giblin AE (2010) The effects of increased nitrate loading on nitrate reduction via denitrification in salt marsh sediments. Limnol Oceanogr 55(2): 789-802
Magalhaes CM, Joye SB, Moreira RM, Wiebe WJ, Bordalo AA (2005) Effect of salinity and inorganic nitrogen concentrations on nitrification and denitrification rates in intertidal sediments and rocky biofilms of the Douro River estuary, Portugal. Water Res 39: 1783- 1794
Mallin MA, Cahoon LB (2003) Industrialized animal production-a major source of nutrient and microbial pollution to aquatic ecosystems. Popul Environ 24(5): 269-385
Mohamed DJ, Martin JBH, (2011) Patterns of fungal diversity and composition along a salinity gradient. ISME J 5: 379-388
Newell SY, Miller JD, Fallon RD (1987) Ergosterol content of salt-marsh fungi: effect of growth conditions and mycelial age. Mycologia 79(5): 688-695
North Carolina Department of Environment and Natural Resources (2014) North Carolina Estuarine Research Reserve maps. Contact Kevin McVerry: [email protected] O’Meara T, Thompson SP, Piehler MP (In review) Effects of shoreline hardening on nitrogen
processing in estuarine marshes of the US mid-Atlantic Coast. Wetl Ecol Manage. Resubmitted April 8, 2014
Oremland RS, Capone DG (1988) Use of “specific” inhibitors biogeochemistry and microbial ecology. In Marshall KC (ed) Advances in Microbial Ecology. Plenum Press, New York, pp 285-383
Peterson JW, O’Meara TA, Seymour MD (2008) Experimental investigation of cephapirin adsorption to quartz filter sands and dune sands. Hydrogeology Journal 16(5): 879-892 Pettijohn FJ (1938) Manual of Sediment Petrology II: Shape Analysis, Mineralogical Analysis,
and Mass Properties. Appleton-Century-Croft, Inc., New York
Piehler, MF, Smyth AR (2011) Habitat-specific distinctions in estuarine denitrification affect both ecosystem function and services. Ecosphere 2(1): Article 12
Pugh GJF (1952) Studies on fungi in coastal soils. Trans Brit Mycol Soc 45(4): 560-566 Rubasinghege G, Spak SN, Stanier CO, Carmichael GR, Grassian VH (2011) Abiotic
mechanisms of atmospheric nitrous oxide from ammonium nitrate. Environ Sci Tech 45(7): 2691-2697
Rysgaard S, Thastum P, Dalsgaard T, Christensen PB, Sloth NP (1999) Effects of salinity on NH4+ adsorption capacity, nitrification, and denitrification in Danish estuarine sediments. Estuaries 22(1): 21-30
Seo DC, DeLaune RD (2010) Fungal and bacterial mediated denitrification in wetlands: influence of sediment redox conditions. Water Res 44: 2441-2450
Seo DC, Yu K, DeLaune RD (2008) Influence of salinity level on sediment denitrification in a Louisiana estuary receiving diverted Mississippi River water. Arch Ag Soil Sci 54(3): 249-257
Shoun H, Kim DH, Uchiyama H, Sugiyama J (1992) Denitrification by fungi. FEMS Microbiol Lett 94: 277-282
Slater JM, Capone DG (1989) Nitrate requirement for acetylene inhibition of nitrous oxide reduction in marine sediments. Microb Ecol 17:143-157
Smith CJ, DeLaune RD (1983) Gaseous nitrogen losses from Gulf Coast marshes. North Gulf Sci 6(1): 1-8
Smith CJ, DeLaune RD, Patrick WH Jr. (1983) Nitrous oxide emission from Gulf Coast wetlands. Geochim Cosmochim Ac 47: 1805-1814
Sumathi C, Raghukumar C (2009) Anareobic denitrification in fungi from the coastal marine sediments off Goa, India. Mycol Res 113(1): 100-109
Syakila A, Kroeze C (2011) The global nitrous oxide budget revisited. Green Gas Measure Manage 1(1): 17-26 http://dx.doi.org/10.3763/ghgmm.2010.0007
Thompson SP, Paerl HW, Go MC (1995) Seasonal patterns of nitrification and denitrification in a natural and a restored salt marsh. Estuaries 18(2): 399-408
Valiela I, Bowen JL (2001) Nitrogen sources to watersheds and estuaries: role of land cover mosaics and losses within watersheds. Environ Poll 118: 239-248
Van der Heijden, Bardgett RD, Van Straalen NM (2008). The unseen majority: soil microbes as drivers of plant diversity and productivity in terrestrial systems. Ecol Lett 11: 296- 310
Van der Valk AG (2012) The Biology of Freshwater Wetlands. Oxford University Press, New York
Van Raalte CD, Patriquin DG (1979) Use of the “acetylene blockage” technique for assaying denitrification in a salt marsh. Mar Biol 52: 315-320
Vitousek PM, Mooney HA, Lubchenco J, Melillo JM (1997) Human domination of Earth's ecosystems. Science 277:494-499
Ecological linkages between above ground and below ground biota. Science 304: 1629- 1933
Wardle D, Walker LR, Bargett RD (2004b) Ecosystem properties and forest decline in contrasting long-term consequences. Science 305:509-513
CHAPTER 3
Effects of shoreline hardening on nitrogen processing in estuarine marshes of the U.S mid-Atlantic Coast
3.1 Introduction
Human modification of the nitrogen cycle has been extraordinary (Vitousek et al. 1997). Prominent effects of anthropogenically-enhanced nitrogen loading in estuarine systems are the increased occurrence and frequency of algal blooms (toxic and non-toxic), fish kills,
hypoxia/anoxia, and habitat loss (Paerl et al. 2002; Cloern 2001). In coastal areas, excessive nitrogen loading has led to impairment of many of the world’s estuaries (NRC 2000). Sixty-five percent of all estuaries in the United States are affected by excessive nitrogen loading (Bricker et al. 2003; Corbett et al. 2008). For example, since 1960, the Neuse River Estuary in North
Carolina, USA has experienced a 45% increase in point-source nitrogen and 135% increase in nitrate (Paerl et al. 2004).
Shoreline hardening structures like bulkheads are an additional potential stressor
these habitats (Schlesinger 1991; Long and Mason 1983), impairing estuarine ecosystem
function (Bozek and Burdick 2005; Seitz et al. 2006). The combined effect of sea level rise and shoreline development has been deemed “the coastal squeeze” because of the negative forces on either side of marshes (Doody 2013).
Marshes contribute to estuarine function through shoreline stabilization, nutrient retention and removal, provision of habitat, and primary productivity (Millennium Ecosystem Assessment 2005). Anthropogenic hydromodification, or the alteration of natural flow pathways by
development, such as bulkhead installation, likely affects all marsh functions (Bozek and Burdick 2005; Gergel 2005), but the impacts on nutrient cycling have not been quantified in coastal systems. Nutrient processing is a prominent feature of wetland function. As nitrate (NO3 -) loading to estuaries continues to rise, any sinks and/or processes that remove NO3- from the system become increasingly important (Brush 2009). Denitrification (DEN) is the microbially-mediated process by which NO3- (biologically active) is converted to N gases (largely
process of DEN. While low levels of NO3- limit DEN, excess NO3- can make the process of DEN less efficient, producing more intermediate products (N2O, a harmful greenhouse gas) and reducing the rate of the process (Francis and Mankin 1977; Glass et al. 1997).
We hypothesized that the presence of a bulkhead and marsh width (Figure 3.1) would significantly affect denitrification rates. Bulkhead presence could directly alter nitrate or organic matter availability for denitrification, affecting the rates at which it occurs. Bulkheading of shoreline could cause a decrease in marsh width. With less surface area available, potential reaction sites for denitrification are lost, but smaller marshes may also have lower elevations and consist of fragmented habitat. Therefore, these changes to the marsh may alter nutrient cycling rates in these sediments. To test these hypotheses, we used flow through core incubations and analyzed dissolved gases in water using membrane inlet mass spectrometry to determine rates of DEN in systems with varying widths of fringing marsh and absence or presence of a bulkhead. In addition, to determine which factors would be most effective in predicting DEN rates, we characterized sediment oxygen demand, sediment organic matter content, and inorganic nitrogen fluxes.
3.2 Methods
3.2.1 Site Descriptions
5-15m), and wide (width >20m). These data were compared to a reference marsh (widths range from 14-20m), which did not have a bulkhead. Each site grouping contained 1 no marsh site, 1 narrow marsh site, 2 medium marsh sites, 1 wide marsh, and 1 reference marsh. Representative water was collected from each site at one or two sampling locations for use in continuous flow core incubations based on the proximity of sampling locations. If sites were <15 km apart, 1 water sample was used. Feed water attributes are shown in Table 3.2.
In the north, sampling locations were established at the convergence of Colling Creek and Kitty Hawk Bay (Figure 3.2a). The most common marsh vegetation included Spartina
cynosuroides (33%) with an average stem density of ~160/m2. The second most abundant species was Juncus roemerianus (19%). Water at the northern sites was lower salinity (1.05-8 psu) than the central and southern sites. One representative feed water was used for all
incubations of northern sampling locations and collected from site 6. Tides in the northern sites are primarily wind-driven and do not exhibit diurnal cycling (Fear and Currin, 2012).
Temperatures during sampling trips ranged from 10.8°C in the winter to 28.2°C in the summer. Central sites were established in Bogue Sound along Pine Knoll Shores and Atlantic Beach (Figure 3.2b). The most common marsh vegetation included Spartina alterniflora (89%) with an average stem density of ~180/m2. The next most abundant species was Salicornia spp. (4%). Cores from central sites were incubated with feed water collected from the Institute of Marine Sciences. Salinities ranged from 32-34 psu. Tides at the central sites are diurnal and are ~1m in range (Fear and Currin, 2012). Temperatures during sampling trips ranged from 6.3°C in the winter to 28°C in the summer.