Downloadedfrom https://journals.lww.com/stdjournalby BhDMf5ePHKav1zEoum1tQfN4a+kJLhEZgbsIHo4XMi0hCywCX1AWnYQp/IlQrHD3fB7RKAmTm9T9xFPjwtYLApDpbxgMO9LcI0SYS1M8d+M=on
05/08/2020
Chlamydia Prevalence Trends Among Women and Men
Entering the National Job Training Program From
1990 Through 2012
Emily R. Learner, PhD,* Elizabeth A. Torrone, PhD,
†
Jason P. Fine, ScD,
‡
Brian W. Pence, PhD,*
Kimberly A. Powers, PhD,* and William C. Miller, MD, PhD, MPH§
Background:Evaluating chlamydia prevalence trends from sentinel sur-veillance is important for understanding population disease burden over time. However, prevalence trend estimates from surveillance data may be misleading if they do not account for changes in risk profiles of individuals who are screened (case mix) and changing performance of the screening tests used.
Methods:We analyzed chlamydia screening data from a sentinel surveil-lance population of 389,555 young women (1990–2012) and 303,699 young men (2003–2012) entering the US National Job Training Program. This period follows the introduction of national chlamydia screening pro-grams designed to prevent transmission and reduce population disease burden. After ruling out bias due to case mix, we used an expectation-maximization–based maximum likelihood approach to account for mea-surement error from changing screening tests, and generated minimally biased long-term chlamydia prevalence trend estimates among youth and young adults in this sentinel surveillance population.
Results: Adjusted chlamydia prevalence among women was high throughout the study period, but fell from 20% in 1990 to 12% in 2003, and remained between 12% and 14% through 2012. Adjusted prevalence among men was steady throughout the study period at approximately 7%. For both women and men, adjusted prevalence was highest among Black and American Indian youth and young adults, and in the Southern and Mid-western regions of the United States throughout the study period. Conclusions:Our minimally biased trend estimates provide support for an initial decrease in chlamydia prevalence among women soon after the in-troduction of national chlamydia screening programs. Constant chlamydia
prevalence in more recent years suggests that screening may not be suffi-cient to further reduce chlamydia prevalence among high-risk youth and young adults.
C
hlamydia trachomatis (chlamydia) infection is usually asymp-tomatic, but can result in serious reproductive sequelae if left untreated. In response to the high burden of chlamydia among young women, the Centers for Disease Control and Prevention introduced a federally funded chlamydia screening program in the Northwestern region of the US in 1988. By 1995, screening programs were implemented in all regions of the United States as part of the Infertility Prevention Project.1,2The screening pro-grams strengthened clinical, educational, laboratory, and surveil-lance operations related to chlamydia and supported screening and treatment services for low-income, sexually active women at-tending public clinics. The goals were to identify and treat infec-tions, which in turn prevents transmission and reduces incidence and prevalence.3At the population level, a reduction in chlamydia preva-lence should be observable in sentinel populations if national screening programs have widespread impact.4A primary source
for sentinel surveillance of chlamydia in the United States is the National Job Training Program (NJTP), a vocational training pro-gram for socioeconomically disadvantaged adolescents and young adults administered by the Department of Labor.5–7 The NJTP has maintained consistent eligibility criteria over time and screens all entrants for chlamydia, making it a stable, high-risk population ideal for monitoring chlamydia prevalence. Among NJTP enrollees, chlamydia prevalence trends spanning short periods (2–7 years) between 1990 and 2008 have shown modest decreases,8–11but trend estimates over longer periods have not been reported.
Observed prevalence trends from sentinel surveillance should be interpreted cautiously because of potential biases. Two important sources of bias that can affect prevalence trend esti-mates are time-varying measurement error from changing screen-ing tests and sentinel population risk profiles. Changes in measurement error can bias prevalence trend estimates when new screening technologies with different sensitivities and speci-ficities are used.3,12Changes in population risk profiles, which
we refer to as“case mix,”can bias prevalence trend estimates when the relative proportions of high- and low-risk individuals screened in a sentinel population fluctuate.3 These biases may mask changes in prevalence over time, and trend estimates that do not properly account for changes in measurement error and case mix may be misleading.
We examined chlamydia prevalence trends over 23 years among female NJTP enrollees and over 10 years among male NJTP enrollees, accounting for potential biases associated with changing screening tests and case mix, to provide minimally biased estimates within a high-risk population over an extended period.
From the *Department of Epidemiology, University of North Carolina at Chapel Hill, Chapel Hill, NC;†Division of STD Prevention, Viral Hepatitis, STD and TB Prevention, National Center for HIV/AIDS, Centers for Disease Control and Prevention, Atlanta, GA;‡Department of Biostatistics, University of North Carolina at Chapel Hill, Chapel Hill, NC; and §Division of Epidemiology, The Ohio State University, Columbus, OH
Sources of funding: The project was supported by the National Insitute of Allergy and Infectious Diseases (NIAID), NIH, through Grant Award Number T32AI007001.
Conflicts of interest: None declared.
The findings and conclusions in this report are those of the authors and do not necessarily represent the official position of the Centers for Disease Control and Prevention.
Supplemental digital content is available for this article. Direct URL citations appear in the printed text, and links to the digital files are provided in the HTML text of this article on the journal’s Web site (http://www.stdjournal.com).
Correspondence: Emily Learner, PhD, Department of Epidemiology, Gillings School of Global Public Health, University of North Carolina atChapelHill.E‐mail:emlearner@gmail.com.
MATERIALS AND METHODS
Study Population
We analyzed annual cross-sectional chlamydia screening data from NJTP enrollees from 1990 through 2012. US residents age 16 through 24 years who meet low-income criteria and face barriers to employment can enroll in the NJTP. Universal chla-mydia screening of NJTP entrants began in 1990 for women and 2003 for men. Screening was performed by a national contract lab-oratory that used several tests. From 1990 through 1997, cervical swabs were tested by Pathfinder Enzyme Immunoassays (EIA) (Sanofi Diagnostics Pasteur, Inc, Redmond, WA). From 1998 through 2006, screening was done with Gen-Probe PACE 2 DNA hybridization probe (Gen-Probe Inc., San Diego, CA) of cervical swabs or urine (men only), or beginning in March 2000, BD ProbeTec ET strand displacement assay (SDA) (Becton-Dickinson, Sparks, MD) of urine (women and men). After 2006, screening was done by BD ProbeTec ET of vaginal or cervical swabs or urine (women and men).
Eligible participants for these analyses were women and men entering the NJTP who had a recorded chlamydia screen-ing test result. Enrollees were excluded if their chlamydia test result, race/ethnicity, region of residence, or screening test type was unknown.
Screening Test Sensitivity and Specificity
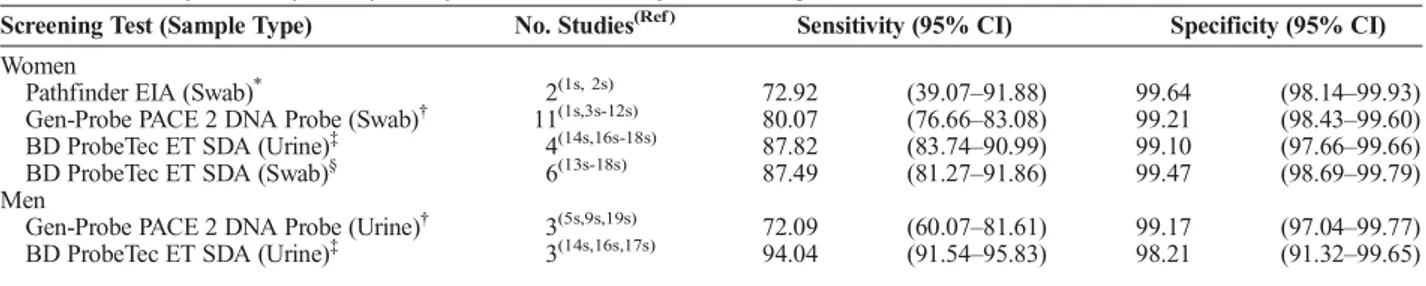
Pairs of sensitivity and specificity estimates for each screening test and sample type were generated through targeted meta-analyses of existing literature. We searched PubMed and Scopus using medical subject heading terms and keywords related to chlamydia screening and diagnostic accuracy (Appendix 1, http://links.lww.com/OLQ/A236). We included studies conducted in North America or Europe that reported the diagnostic accuracy of the Pathfinder EIA, Gen-Probe PACE 2, and BD ProbeTec ET, and from which counts of true positive, true negative, false posi-tive, and false negative tests could be extracted or calculated. Bi-variate generalized linear mixed effects models with a logit link were used to generate summary sensitivity and specificity esti-mates and corresponding 95% confidence intervals (CI) (Table 1).
Case Mix
Chlamydia prevalence and case rates are associated with race/ethnicity and geography, with Black youth and youth in the South having the highest burden.5,13,14To assess potential bias from longitudinal changes in the demographics of NJTP enrollees, we examined the racial/ethnic and geographical distributions of
enrollees over time. We visually inspected the distributions of race/ethnicity and enrollment region using stacked bar charts, and observed a uniform distribution over time for both factors (Figures S2, http://links.lww.com/OLQ/A238 and S3, http:// links.lww.com/OLQ/A239). We also examined temporal trends in enrollment by these factors using logistic regression, with race/ethnicity or region as the dependent variable, and study year (continuous) as the independent variable. No meaningful variation in the relative proportion of race/ethnicity and region over time was observed (results not shown). As these analyses suggested that no meaningful case mix variation occurred, we excluded this po-tential bias from further consideration in calculating adjusted chla-mydia prevalence trend estimates.
Prevalence Trends
We modeled chlamydia prevalence trends using an expecta-tion-maximization (EM)–based maximum-likelihood approach that accounts for measurement error due to imperfect screening test sensitivity and specificity.15This approach uses EM to esti-mate a maximum-likelihood logit regression model when the out-come is measured with uncertainty, and allows the sensitivity and specificity of screening tests to vary across observations. Our models accounted for sensitivity and specificity estimates gener-ated from our meta-analyses. Chlamydial infection (positive or negative) was the dependent variable in all models and study year (continuous) was the independent variable. The functional form of year was assessed using Akaike Information Criteria and visual in-spection, and included quadratic spline terms with three knots in models for women and a quadratic term in models for men. Param-eter estimates from maximum-likelihood regression models were used to calculate the predicted probability (prevalence) of chla-mydia across study years. Ninety-five percent CIs were obtained by bootstrapping (n = 200). We compared trends from the EM maximum-likelihood regression model (adjusted trends that ac-count for time-varying measurement error) to trends from a logis-tic regression model (unadjusted trends that do not account for time-varying measurement error) to assess the impact of changing screening tests on prevalence trend estimates. We also stratified by race/ethnicity and region to examine subgroup differences.
Sensitivity Analyses
We conducted sensitivity analyses to account for random and systematic error in the estimates of test sensitivity and speci-ficity that were used to model prevalence. To account for random error, we modeled prevalence using the upper and lower bounds of the 95% CI around our summary sensitivity and specificity esti-mates. To account for systematic error, we re-estimated GenProbe
TABLE 1.Summary Sensitivity and Specificity Estimates of Chlamydia Screening Tests
Screening Test (Sample Type) No. Studies(Ref ) Sensitivity (95% CI) Specificity (95% CI)
Women
Pathfinder EIA (Swab)* 2(1s, 2s) 72.92 (39.07–91.88) 99.64 (98.14–99.93)
Gen-Probe PACE 2 DNA Probe (Swab)† 11(1s,3s-12s) 80.07 (76.66–83.08) 99.21 (98.43–99.60)
BD ProbeTec ET SDA (Urine)‡ 4(14s,16s-18s) 87.82 (83.74–90.99) 99.10 (97.66–99.66)
BD ProbeTec ET SDA (Swab)§ 6(13s-18s) 87.49 (81.27–91.86) 99.47 (98.69–99.79)
Men
Gen-Probe PACE 2 DNA Probe (Urine)† 3(5s,9s,19s) 72.09 (60.07–81.61) 99.17 (97.04–99.77)
BD ProbeTec ET SDA (Urine)‡ 3(14s,16s,17s) 94.04 (91.54–95.83) 98.21 (91.32–99.65)
*
Used for screening from 1990 through 1997.
†Used for screening from 1998 through 2006 for women, and 2003 through 2006 for men. ‡Used for screening from 2000 through 2012 for women, and 2003 through 2012 for men.
§
PACE 2 and BD ProbeTec ET sensitivity and specificity using more selective inclusion/exclusion criteria for the meta-analyses. We excluded studies that used the test of interest in their reference test definition (reference test bias) or performed repeat testing. We used these new estimates to model adjusted prevalence. We did not reestimate sensitivity and specificity of the Pathfinder EIA due to the small number of studies in the initial meta-analysis.
Analyses were performed in Stata version 14.1 (College Station, TX, 2015).
RESULTS
Screening Test Sensitivity and Specificity
Sensitivity increased over the study period. The estimated sensitivity of EIA, DNA probe, and SDA for women was 73%, 80%, and 87%, respectively (Table 1). Among men, sensitivity of DNA probe and SDA was 72% and 94%, respectively. All tests had specificities greater than 98%.
Chlamydia Prevalence Among Women
From 1990 through 2012, 439,992 women were screened for chlamydia. Relatively few women had an uninterpretable screening test result (n = 3466, 0.8%), or missing race/ethnicity (n = 26,905, 6.1%) or region (n = 17,097, 3.9%). Chlamydia screening test type was unknown for a small number of women throughout the study period (n = 2969, 0.7%), and these data were considered missing. After excluding women with uninterpretable test results or missing data, 389,555 women (89% of women screened for chlamydia) were included in analyses.
Most women were Black (58%) and approximately half lived in the South (45%) (Table 2). Two thirds were age 16 through 19 (69%), and few reported symptoms (3%). Approximately 36% of women were tested for chlamydia via EIA, 24% were tested by DNA probe, and the remainder was tested via SDA of swabs (12%) or urine (28%).
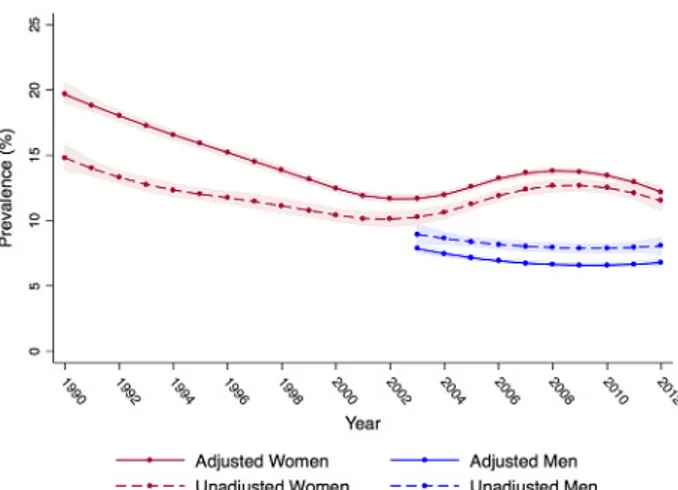
Unadjusted chlamydia prevalence was high overall, ranging between 15% and 10%. Unadjusted prevalence declined modestly from 1990 through 2003, before rising slightly through 2009 (Fig. 1). After accounting for measurement error associated with different screening tests, we observed a higher prevalence of chla-mydia across all years and a sharper decline in adjusted prevalence in the first half of the study, relative to unadjusted estimates (Fig. 1). Adjusted prevalence was highest in 1990 at approximately 20%, and steadily decreased to 12% by 2003. From 2004 through 2012, adjusted prevalence was relatively steady and rose to 14% before dropping to 12%.
Black women had the highest prevalence of chlamydia throughout the study, followed by American Indian, Hispanic, and White women (Fig. 2). For all race/ethnicities, adjusted prev-alence declined early on, with the sharpest decline occurring among American Indian women (24% to 12%) and Black women (23% to 14%). Among Hispanic and White women, adjusted prev-alence declined from approximately 15% to 10% and 13% to 7% respectively. Adjusting for time-varying measurement error re-vealed a larger decline in prevalence for all race/ethnicities early in the study, relative to unadjusted trends (Figure S4, http://links. lww.com/OLQ/A240). In the second half of the study, adjusted chlamydia prevalence remained relatively steady among White and Hispanic women. Adjusted prevalence in Black women rose modestly from 14% to 17% between 2003 and 2008, before begin-ning to drop. American Indian women experienced an increase in adjusted prevalence from 2008 through 2012 (12% to 16%).
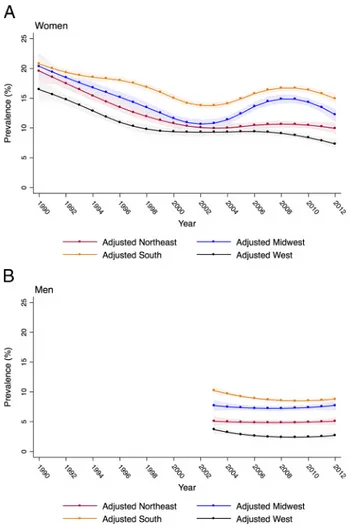
Chlamydia prevalence was highest throughout the study among women in the South, followed by the Midwest, Northeast,
and West. In all regions, adjusted prevalence was high in 1990, ranging between 16% among women in the West to 21% among women in the South (Figs. 3 and S5, http://links.lww.com/OLQ/ A241). Adjusted prevalence among women declined in the first half of the study in all regions, and leveled out in the second half among women in the West and Northeast. Modest increases in ad-justed prevalence occurred among women in the South and Mid-west between 2004 and 2009.
In sensitivity analyses, neither the magnitude nor shape of the overall prevalence trend was substantially altered by using the lower and upper bounds of the 95% CI around test sensitiv-ity and specificsensitiv-ity estimates (Figure S6, http://links.lww.com/ OLQ/A242). Reestimated test sensitivity and specificity values were very similar to initial estimates, and modeling trends with reestimated values also had minimal influence on the overall trend (results not shown).
Chlamydia Prevalence Among Men
From 2003 through 2012, 370,047 men were screened for chlamydia. Few men had an uninterpretable test result (n = 1288, 0.3%), or were missing race/ethnicity (n = 21,976, 5.9%). Region and chlamydia screening test type were missing for 7486 (2.0%) men and 35,598 (9.6%) men respectively. Overall, 303,699 men (82% of men screened for chlamydia) were included in analyses. Half of the men were Black (51%) and lived in the South (49%) (Table 2). Two thirds (67%) were aged 16 through 19 years. Few men reported symptoms (1%). Almost all men were screened with SDA (99%). Unadjusted chlamydia prevalence re-mained stable throughout the study, and fluctuated between 8% and 9% (Fig. 1).
After accounting for measurement error, the adjusted prev-alence of chlamydia among men decreased slightly in all years relative to unadjusted estimates but remained steady over time at approximately 7% (Fig. 1). Black men had the highest adjusted prevalence across all years (approximately 11%), followed by American Indian (approximately 5%), Hispanic (approximately 4%), and White men (approximately 1%) (Figs. 2 and S7, http:// links.lww.com/OLQ/A243). Adjusted prevalence was consis-tently highest among men in the South, followed by the Midwest, Northeast, and West (Fig. 3 and S8, http://links.lww.com/OLQ/ A244). Adjusted prevalence estimates generated from the upper and lower bounds of the 95% CI around test sensitivity and spec-ificity did not substantially alter trends (Figure S9, http://links. lww.com/OLQ/A245).
DISCUSSION
Sentinel surveillance of chlamydia among NJTP enrollees provides a unique opportunity to assess chlamydia prevalence trends in high-risk youth and young adults and gain insights into the possible impact of the national chlamydia screening pro-gram. After ruling out bias due to case mix and adjusting for time-varying measurement error associated with changing screening tests, chlamydia prevalence among women declined from 20% to 12% during the first 14 years of the study, and re-mained between 12% and 14% through 2012. Adjusted chla-mydia prevalence among men was stable from 2003 through 2012 (approximately 7%). For women and men, adjusted preva-lence was highest among Black and American Indian youth and young adults, and youth and young adults in the South and Midwest throughout the study. Despite longstanding national screening and treatment programs,5 chlamydia remains highly prevalent among youth and young adults entering the NJTP.
national screening program, possibly providing indirect support for the early success of screening programs in reducing chlamydia prevalence, specifically among high-risk young women.16The de-cline in prevalence stopped in 2003, raising the possibility that on-going screening efforts for high-risk young women are insufficient to reduce prevalence further.
Adjusted chlamydia prevalence among men was steady throughout the study. Screening for men started in 2003, when the prevalence among women began to stabilize. The flat trend suggests that ongoing prevention efforts have been ineffective at reducing
chlamydia among men since 2003. This trend is perhaps unsurpris-ing, as screening programs have primarily targeted women.
We observed large disparities in chlamydia prevalence by race/ethnicity and region, with black and American Indian youth and young adults, and youth and young adults in the South having consistently higher prevalence compared to other races/ethnicities and regions. Prevalence in these groups also increased modestly during the latter half of the study. The overall trends among women appear to be driven by prevalence trends among black women and women residing in the South and Midwest, based on
TABLE 2.Characteristics of National Job Training Program Enrollees and Unadjusted Chlamydia Prevalence, 1990–2012
Women (n = 389,555) Men (n = 303,699)
Unadjusted Unadjusted
Characteristic No. Tested (Col %) No. Positive Prevalence (%)*† No. Tested (Col %) No. Positive Prevalence (%)* Age, y
16–19 270,483 (69.4) 36,075 13.3 204,778 (67.4) 16,147 7.9
20–24 119,072 (30.6) 10,709 9.0 98,921 (32.6) 8567 8.7
Race/ethnicity
Black 224,936 (57.8) 32,424 14.4 155,045 (51.1) 19,031 12.3
White 91,173 (23.4) 6737 7.4 95,994 (31.6) 2761 2.9
Hispanic 61,449 (15.8) 6186 10.1 44,822 (14.8) 2713 6.1
American Indian 11,997 (3.1) 1437 12.0 7838 (2.6) 507 6.5
Region
Midwest 71,291 (18.3) 8672 12.2 51,361 (16.9) 4423 8.6
Northeast 67,385 (17.3) 7007 10.4 45,730 (15.1) 2893 6.3
South 174,056 (44.7) 24,288 14.0 149,464 (49.2) 14,983 10.0
West 76,823 (19.7) 6817 8.9 57,144 (18.8) 2415 4.2
Symptoms at Entrance
Yes 12,270 (3.2) 1834 15.0 3707 (1.2) 673 18.2
No 377,285 (96.9) 44,950 11.9 299,992 (98.8) 24,041 8.0
Test (sample type)
EIA (swab) 141,932 (36.4) 17,811 12.6 — — — —
DNA Probe (swab) 92,145 (23.7) 9463 10.3 — — — —
DNA Probe (urine) — — — — 954 (0.3) 83 8.7
SDA (swab) 47,690 (12.2) 6779 14.2 — — — —
SDA (urine) 107,788 (27.7) 12,731 11.8 302,745 (99.7) 24,631 8.1
Year of Test
1990 10,143 (2.6) 1518 15.0 — — — —
1991 18,086 (4.6) 2588 14.3 — — — —
1992 18,922 (4.9) 2380 12.6 — — — —
1993 20,132 (5.2) 2484 12.3 — — — —
1994 19,994 (5.1) 2722 13.6 — — — —
1995 18,151 (4.7) 2276 12.5 — — — —
1996 21,115 (5.4) 2235 10.6 — — — —
1997 15,389 (4.0) 1608 10.4 — — — —
1998 12,106 (3.1) 1424 11.8 — — — —
1999 12,709 (3.3) 1459 11.5 — — — —
2000 10,189 (2.6) 1138 11.2 — — — —
2001 5892 (1.5) 653 11.1 — — — —
2002 6443 (1.7) 674 10.5 — — — —
2003 16,095 (4.1) 1598 9.9 16,206 (5.3) 1447 8.9
2004 17,936 (4.6) 1862 10.4 32,593 (10.7) 2766 8.5
2005 19,114 (4.9) 1758 9.2 33,637 (11.1) 2849 8.5
2006 19,339 (5.0) 2611 13.5 32,652 (10.8) 2699 8.3
2007 20,825 (5.3) 2811 13.5 33,147 (10.9) 2683 8.1
2008 21,494 (5.5) 2743 12.8 33,158 (10.9) 2624 7.9
2009 21,288 (5.5) 2518 11.8 31,435 (10.4) 2411 7.7
2010 21,948 (5.6) 2669 12.2 30,421 (10.0) 2346 7.7
2011 22,162 (5.7) 2646 11.9 31,661 (10.4) 2581 8.2
2012 20,083 (5.2) 2409 12.0 28,789 (9.5) 2308 8.0
*
Unadjusted prevalence was calculated as the total number of positive tests divided by the total number tested. Estimates differ slightly from estimates derived from logistic regression models.
†A total of 9038 and 9717 women were tested for chlamydia in 2001 and 2002, respectively. Due to administrative changes in reporting, race/ethnicity was
similarities in trend shape. Similar racial and regional disparities have been observed among large population-based surveys and public high school students.13,14,17–19Targeted chlamydia
preven-tion efforts for these groups could be considered to address these racial and regional disparities.
The relatively stable chlamydia prevalence trends among women and men after 2003 and racial/ethnic and regional dispar-ities in trends highlight the need for a comprehensive understanding of factors that drive these trends. Future research could examine whether stable trends among NJTP enrollees have persisted after 2012 and investigate why trends have stopped declining and what is driving disparities in prevalence, particularly among Black women and women residing in the South and Midwest.
Our findings differ from previously reported chlamydia prevalence trends among NJTP enrollees with respect to trend di-rection, duration, and validity. In previous reports, prevalence de-clined but was estimated only over the short term.8–11 While
focusing on shorter periods may avoid bias from changing tests, it prohibits long-term trend estimation across periods with differ-ent tests. We examined 23-year prevalence trends to generate a comprehensive picture of chlamydia prevalence over time, and ob-served no substantial decline after 2003.
We also used robust methods to account for measurement error due to changing screening tests. In previous trend estimates, measurement error was addressed by adjusting for screening tests in generalized linear models or restricting by test type.9,10These methods do not properly account for test sensitivities and specific-ities.20To generate more valid prevalence estimates that correctly account for measurement error, we estimated screening tests' di-agnostic accuracy through meta-analyses, and used EM-based maximum-likelihood regression to incorporate sensitivities and specificities into prevalence trend estimation. We examined sev-eral sensitivity and specificity estimates to account for random and systematic error that may have influenced our diagnostic ac-curacy estimates. Sensitivity analyses showed that adjusted
prevalence trend estimates were generally unaffected by a range of plausible screening test sensitivity and specificity values.
We also evaluated the need to account for case mix by ex-amining race/ethnicity and region of residence of NJTP enrollees over time. The NJTP entrance criteria for socioeconomic status, education, and age were constant throughout the study,6and we did not observe meaningful variation in race/ethnicity or region over time. We could not assess whether other characteristics of NJTP enrollees changed over time, so although entrance criteria were consistent, enrollees’risk profiles, particularly their sexual behavior, may have changed. For example, nationally, condom use among high school students increased from 1991 through 2003 but decreased between 2003 and 2015, indicating that poten-tial changes in sexual behaviors could be a source of residual case mix biases.21
Multiple factors other than the screening program and biases in surveillance data could have influenced chlamydia prev-alence trends. These factors include changes in sexual activity, in-creased condom use, and older age of sexual debut. Dein-creased
Figure 1.Adjusted and unadjusted chlamydia prevalence among
women entering the NJTP (n = 389,555) from 1990 to 2012 (red lines), and men entering the NJTP (n = 303,699) from 2003 to 2012 (blue lines). Adjusted prevalence estimates and 95% CIs account for measurement error associated with use of increasingly sensitive chlamydia screening tests over time (Pathfinder EIA of swabs [1990–1997], Gen-Probe PACE 2 DNA hybridization probe of swabs or urine [1998–2006], and BD ProbeTec ET SDA of urine [2000–2012] or swabs [2007–2012]). Adjusted estimates were modeled using an EM algorithm incorporated into logistic regression. Unadjusted estimates were generated from a logistic regression model, and do not account for changes in the diagnostic accuracy of tests.
Figure 2. Adjusted chlamydia prevalence and 95% CIs among
sexual activity and increased condom use drove falling teen preg-nancy trends,22which declined in parallel with chlamydia in the 1990s, suggesting that multiple factors played a role in the early decline of chlamydia. But teen pregnancy continued to drop steadily through 2012 while chlamydia trends plateaued or rose.
Our study is the first to generate long-term chlamydia prevalence trend estimates among NJTP enrollees while properly accounting for biases that influence observed prevalence in senti-nel populations. We observed an initial decline in chlamydia prev-alence among women, followed by a period of relative stability. We also observed stable trends among men. The trends offer indi-rect evidence that chlamydia screening programs may have been initially effective among women on a population level, but the on-going impact of screening in the current social context may be in-sufficient to further reduce prevalence. Chlamydia prevalence among high-risk youth and young adults remains alarmingly high and supports ongoing screening and prevention efforts.
REFERENCES
1. Recommendations for the prevention and management of Chlamydia trachomatis infections, 1993. Centers for Disease Control and Preven-tion. MMWR Recomm Rep 1993; 42(No. RR-12):1–39.
2. Centers for Disease Control and Prevention. Infertility Prevention Pro-ject [Accessed December 10, 2015]. 2013; (http://www.cdc.gov/std/ infertility/ipp-archive.htm).
3. Miller WC. Epidemiology of chlamydial infection: Are we losing ground? Sex Transm Infect 2008; 84:82–86.
4. Miller WC. Screening for chlamydial infection: Are we doing enough? Lancet 2005; 365:456–458.
5. Centers for Disease Control and Prevention. Sexually Transmitted Dis-ease Surveillance 2016. Atlanta: US Department of Health and Human Services, 2017.
6. U.S. Department of Labor Office of Job Corps. Policy and Handbook Requirements. 2015.
7. US Department of Labor. US Department of Labor Job Corps Annual Report 2009; 17:6–8.
8. Mertz KJ, Ransom RL, St. Louis ME, et al. Prevalence of genital chlamydial infection in young women entering a National Job Training Program, 1990–1997. Am J Public Health 2001; 91: 1287–1290.
9. Joesoef MR, Mosure DJ. Prevalence trends in chlamydial infections among young women entering the National Job Training Program, 1998–2004. Sex Transm Dis 2006; 33:571–575.
10. Satterwhite CL, Tian LH, Braxton J, et al. Chlamydia prevalence among women and men entering the National Job Training Program: United States, 2003–2007. Sex Transm Dis 2010; 37:63–67. 11. Tian L, Satterwhite CL, Braxton JR, et al. Application of the
time-series approach to assess the temporal trend of racial disparity in chlamydia prevalence in the US National Job Training Program. Am J Epidemiol 2011; 173:217–224.
12. Dicker LW, Mosure DJ, Levine WC, et al. Impact of switching labora-tory tests on reported trends inChlamydia trachomatisinfections. Am J Epidemiol 2000; 151:430–435.
13. Miller WC, Ford CA, Morris M, et al. Prevalence of chlamydial and gonococcal infections among young adults in the United States. JAMA 2004; 291:2229–2236.
14. Torrone E, Papp J, Weinstock H. Prevalence of Chlamydia trachomatis genital infection among persons aged 14-39 years—United States, 2007–2012. MMWR 2014; 63:2011–2013.
15. Magder LS, Hughes JP. Logistic regression when the outcome is mea-sured with uncertainty. Am J Epidemiol 1997; 146:195–203. 16. Miller WC, Zenilman JM. Epidemiology of chlamydial infection,
gon-orrhea, and trichomoniasis in the United States—2005. Infect Dis Clin North Am 2005; 19:281–296.
17. Torrone EA, Johnson RE, Tian LH, et al. Prevalence ofNeisseria gonorrhoeaeamong persons 14 to 39 years of age, United States, 1999 to 2008. Sex Transm Dis 2013; 40:202–205.
18. Nsuami MJ, Nsa M, Brennan C, et al. Chlamydia positivity in New Orleans public high schools, 1996–2005: Implications for clinical and public health practices. Acad Pediatr 2013; 13:308–315. 19. Asbel LE, Newbern EC, Salmon M, et al. School-based screening
for Chlamydia trachomatis and Neisseria gonorrhoeae among Philadelphia public high school students. Sex Transm Dis 2006; 33: 614–620.
20. Rothman K, Greenland S, Lash T. Modern Epidemiology. Third Edit. Philadelphia, PA: Lippincott, Williams, & Wilkins, 2008.
21. Centers for Disease Control and Prevention. Trends in the Preva-lence of Sexual Behaviors and HIV Testing National Youth Risk Behavior Survey: 1991–2015 [Accessed October 1, 2017]. 2016; 1–2. (www.cdc.gov/yrbs).
22. Santelli JS, Lindberg LD, Finer LB, et al. Explaining recent declines in adolescent pregnancy in the United States: The contribution of absti-nence and improved contraceptive use. Am J Public Health 2007; 97: 150–156.
Figure 3.Adjusted chlamydia prevalence and 95% CIs among