Received 10 Jul 2016|Accepted 9 Feb 2017|Published 7 Apr 2017
Lkb1
inactivation drives lung cancer lineage
switching governed by Polycomb Repressive
Complex 2
Haikuo Zhang
1,2,*, Christine Fillmore Brainson
3,4,5,*
,w, Shohei Koyama
1,2, Amanda J. Redig
1,2, Ting Chen
1,2,
Shuai Li
1,2, Manav Gupta
3,4,5, Carolina Garcia-de-Alba
3,4,5, Margherita Paschini
3,4,5, Grit S. Herter-Sprie
1,2,
Gang Lu
1,2, Xin Zhang
1,2, Bryan P. Marsh
3, Stephanie J. Tuminello
6, Chunxiao Xu
1,2, Zhao Chen
1,2,
Xiaoen Wang
1,2, Esra A. Akbay
1,2, Mei Zheng
2, Sangeetha Palakurthi
7, Lynette M. Sholl
1,2, Anil K. Rustgi
8,
David J. Kwiatkowski
1,2, J Alan Diehl
9, Adam J. Bass
1,2, Norman E. Sharpless
10, Glenn Dranoff
1,2,
Peter S. Hammerman
1,2, Hongbin Ji
11,12, Nabeel Bardeesy
13, Dieter Saur
14,15, Hideo Watanabe
7, Carla F. Kim
3,4,5& Kwok-Kin Wong
1,2,7,16Adenosquamous lung tumours, which are extremely poor prognosis, may result from cellular plasticity. Here, we demonstrate lineage switching of KRASþ lung adenocarcinomas (ADC) to squamous cell carcinoma (SCC) through deletion ofLkb1(Stk11) in autochthonous and transplant models. Chromatin analysis reveals loss of H3K27me3 and gain of H3K27ac and H3K4me3 at squamous lineage genes, includingSox2,DNp63 andNgfr. SCC lesions have higher levels of the H3K27 methyltransferase EZH2 than the ADC lesions, but there is a clear lack of the essential Polycomb Repressive Complex 2 (PRC2) subunit EED in the SCC lesions. The pattern of high EZH2, but low H3K27me3 mark, is also prevalent in human lung SCC and SCC regions within ADSCC tumours. Using FACS-isolated populations, we demonstrate that bronchioalveolar stem cells and club cells are the likely cells-of-origin for SCC transitioned tumours. These findings shed light on the epigenetics and cellular origins of lineage-specific lung tumours.
DOI: 10.1038/ncomms14922 OPEN
L
ung adenocarcinoma (ADC) and squamous cell carcinoma (SCC) are regarded as segregated entities of non-small-cell lung cancer. These two tumour types largely have unique genetic profiles, with KRAS and EGFR activation common in ADC, while PTEN inactivation, PI3KCA activation and NOTCH2 activation are common in SCC tumours1,2. However, there are cases of mixed histology tumours, where at least 10% of the biopsied tumour cells have one histology (either ADC or SCC) and the remainder are the other histology3. Adenosquamous (ADSCC) disease accounts for 2–3% of all diagnoses, though this diagnosis can only be made with wedge biopsy or tumour resection, which could lead to underestimation of its prevalence in patient populations3,4. ADSCC is a particularly poor prognosis tumour type5,6, and genetic studies have demonstrated that both histological components share mutations, suggesting a monoclonal tumour origin7. Notably, in many cases of disease progression after targeted therapy for EGFR mutation, when it is clinically justifiable to take a second biopsy, conversion of ADC to SCC has been observed8. Given these data, a better understanding of lung cancer lineage relationships could shed light on both the origins of lung cancer and how to overcome therapeutic resistance.SCCs have long been proposed to arise from tracheal basal cells and ADCs have been proposed to arise from alveolar type II (AT2) cells or club (Clara) cells, due to markers of these cell types being present in the malignant lesions4,9. However, given the shared genetics of ADC and SCC lesions in ADSCC tumours, it must be possible for certain lung cells to drive both histologies. Basal cells, which express nerve growth factor receptor (NGFR), p63 and cytokeratin 5 (KRT5), serve as stem cells for the trachea, main bronchi and upper airways. Basal cells can replace the pseudostratified epithelium including secretory club cells, mucus-producing goblet cells and ciliated cells10–12. In more distal airways, club cells are a self-renewing population that maintain the ciliated cells13; subsets of club cells can give rise to ciliated and club cell lineages after injury14,15. In the alveolar space where gas exchange is carried out by alveolar type I cells, the surfactant-expressing AT2 cells act as stem cells16,17. Cells expressing club cell secretory protein (CCSP), including bronchioalveolar stem cells (BASCs), can give rise to AT2 cells18–22. There is also extensive plasticity in the lung and tracheal epithelium, as club cells can give rise to basal cells23, and may give rise to KRT5þ/p63þ cells or alveolar cells under certain injury conditions24,25. Cellular lineage switching, either in the normal situation or in cancer, could be modulated by epigenetic mechanisms, including histone modification governed in part by the Polycomb Repressive Complex 2 (PRC2). Genetically engineered mouse models are unparalleled in their capacity to allow the study lung tumour origins and evolution. Using a LSL:KrasG12D/þ; Lkb1flox/flox (LSL¼Lox-stop-Lox) mouse model of lung cancer, we demonstrated previously that
Lkb1 inactivation dramatically accelerated KRAS-driven lung cancer progression and changed the tumour spectrum from purely ADC to ADC and SCC26. While KRAS is a common oncogene in lung ADC, LKB1/STK11, encoding a serine-threonine kinase implicated in energy sensing and cell polarity, is notable as being among the most commonly mutated tumour suppressors in ADC2. Additionally, mutations inLKB1
predominantly co-occur with KRAS activating mutations27,28. Subsequent studies with theLSL:KrasG12D/þ; Lkb1flox/floxmouse model demonstrated that the SCC tumours arise later during tumour progression than ADC and that SCCs are characterized by decreased lysyl oxidases and increased reactive oxygen species29–31. However, because of the simultaneous activation of KRAS and inactivation of Lkb1, it remained unclear if a unique pool of SCC competent cells were transformed only
whenLkb1was deleted, or if existing KRAS-induced ADC could convert to a squamous fate in response to Lkb1 deletion. Furthermore, due to the intranasal inhalation method to introduce Cre to drive the genetics, the cell-of-origin of this tumour type was unknown.
Here, we describe a stepwise mouse model of lung tumorigen-esis that strongly supports the theory that established ADC cells can transition to SCC fate upon additional genetic perturbations, such as Lkb1 deletion. Using this model, we found that de-repression of squamous genes through loss of Polycomb-mediated gene repression accompanies the squamous transition. We also show that club cells and BASCs are the most fit populations to give rise to adenosquamous tumours. Together these data add to our understanding of the underlying epigenetic programmes and cellular origins of lineage-specific lung tumours.
Results
Lkb1deletion drives SCC transition of established KRAS ADCs. Previously, we showed that Stk11 (Lkb1) deletion concomitant with induction of oncogenic KRAS drove acquisition of aggressive tumour characteristics, including SCC transition, not observed in KRAS tumours when Lkb1 is intact26. These data were confounded by the fact that Lkb1 mutations are relatively infrequent in pure SCC tumours (2%, see ref. 1). However, the model of KRAS and Lkb1 is actually a mixed histology model, containing ADC, SCC and mixed ADSCC tumours. Thus, we hypothesized that LKB1 mutations may be more frequent in patient lung ADSCC samples. Data from a published study32and from a cohort of ADSCC tumours at DFCI showed that of 23 ADSCC tumour cases, 6 harbouredLKB1inactivation. These data suggest thatLKB1mutations may be more frequent (26.1%), or at least as frequent, in ADSCC tumours as in ADC tumours (15.6%, 111 of 602 ADC tumours, P¼0.24). Together with data demonstrating KRAS is often activated in ADSCC tumours33, we propose that ADSCC in KRAS/Lkb1 mice is a clinically relevant recapitulation of the genetics found in human lung adenosquamous patients.
To dissect the contributions of KRAS and Lkb1 mutations during lung tumorigenesis, we used the dual recombinase model to activate oncogenic KRAS and vary the time-point of Lkb1
deletion. Our model includes that alleles FSF:KrasG12D/þ;
FSF:R26:CreERT2; Lkb1flox/flox (FSF¼Fret-Stop-Fret) and combines flippase-FlpO-Fret and tamoxifen (Tam) inducible Cre-loxP recombination to make KRASG12D activation and
Lkb1 inactivation separable (Fig. 1a). Mice were randomized into four arms: (1) KRAS activation with Lkb1 deletion at the same time (concomitant), (2) KRAS activation followed byLkb1deletion after 2 weeks, (3) KRAS activation followed by
approximately 40% of mice harbouring at least one tumour with purely squamous characteristics at the end of the study (P¼0.96 concomitant versus 10 week; Fig. 1c). Consistent with previous observations34, tumours that develop when KRAS is activated by FlpO were uniformly low-grade lung tumours that always present as glandular adenomas and ADCs (Fig. 1d).
In Lkb1-deleted tumours, purely squamous and transitioning tumours with areas of both ADC and SCC histology, as determined by immunohistochemistry (IHC) for the squamous markers KRT5, p63 and SOX2, were present (Fig. 1e,f). By contrast, the distal lung marker TTF1 (NKX2.1) was highest in the ADC lesions, and decreased during squamous transition.
c
Survival (%)
*P=0.0084 NS P=0.96
*P=0.004
Mice (%)
n
=13
n
=13
n
=9
n
=15
b
Only ADC At least one SCC
100
80
60
FlpO+Tam
FlpO-2 wks-TamFlpO-10wks-Tam FlpO
40
20
0 d
e
f
SCC
ADC
ADC→SCC
TTF1
SCC ADC
KRT5 P63 SOX2
a
Lkb1 Lkb1
LoxP LoxP
Kras Kras G12D
Fret Fret
Stop
R26 CreERT2
Fret Fret
Stop
2 weeks +
10 weeks
FlpO Tamoxifen
Cohort 1
Cohort 2
Cohort 3
Cohort 4
FlpO n=10 FlpO+Tam n=10 FlpO-2 wks-Tam n=14 FlpO-10 wks-Tam n=10
60 40
Weeks 0
50 100
20 0
ADC→SCC
Consistent with the microenvironment also being affected35,36, we observed that the tumour-associated myeloid cells changed during transition from ADC to SCC. As previously observed37, ADC lesions stained positively for the macrophage marker F4/80, while the SCC lesions stained positively for MPO, a marker of tumour-associated neutrophils (Supplementary Fig. 1c).
Our first set of experiments demonstrated thatLkb1deletion in cells that had KRAS activation long before was sufficient to produce tumours with squamous characteristics. It was tempting to speculate that this was evidence of a true transition from a KRASþ ADC cellular state to a KRASþ/Lkb1-null
squamous state. However, because the two genetic manipulations were performed on cells that remained within the same mouse during the entirety of the process, the possibility remained that Lkb1 deletion was allowing growth of a latent population of squamous-predisposed KRASþ cells. To address this issue, we isolated KRASþ lung ADC cells prior to tamoxifen treatment and transplanted them into immunocompromised mouse recipients (Fig. 2a). Cohorts of mice received either tamoxifen or placebo were aged until signs of tumour distress, and were then assessed for tumour histology. The tamoxifen naı¨ve cohort uniformly presented with ADC, which could be serially transplanted and never transitioned to SCC (Fig. 2b). In contrast, upon tamoxifen administration 2 weeks after transplant, the tumours in mice treated with tamoxifen took on squamous characteristics, with 40% of mice having at least one lesion that was completely SCC at the time of killing (P¼0.0225 Tam versus no Tam, Fig. 2c). In our previous studies, we observed that KRAS tumour propagating cells (TPCs) were present in both Sca1þ and Sca1- compartments, and a purely squamous model generated by bialleleic inactivation of Lkb1 and
Pten (Lkb1/Pten) harboured Sca1þ and NGFRþ TPCs37. To explore these populations in the transplanted tumours, we collected tumours from each mouse, dissociated and analysed EpCAMþ/CD31/CD45 cells for expression of NGFR and Sca1. We observed that KRAS transplant tumours had very few Sca1þ/NGFRþ cells and were indistinguishable from adeno-Cre induced KRAS tumours (P¼0.368; Fig. 2d and Supplementary Fig. 2a,b). By contrast, tamoxifen-treated mice harboured tumours with high levels of Sca1 and NGFR, and the population of Sca1þ/NGFRþ cells was the same proportion of tumour as found in the pure Lkb1/Pten SCC tumours (P¼0.004 Tam versus no Tam, P¼0.720 Tam versus
Lkb1/Pten). We also confirmed cell surface NGFR staining in the tamoxifen-treated mouse tumours by IHC (Supplementary Fig. 2c). Lastly, we isolated cells from squamous transitioned lesions for transplant, and found that both Sca1HighNGFRHigh and Sca1HighNGFRLowtumour cells could successfully transplant squamous disease (Fig. 2e). Together these data demonstrate that purely ADC lesions derived from transplanted KRASþ cells can transition to SCC, and that tumours can acquire the SCC TPC expression profile of Sca1þ/NGFRþ upon Lkb1
deletion. Once the squamous transition has happened, the phenotype perpetuates.
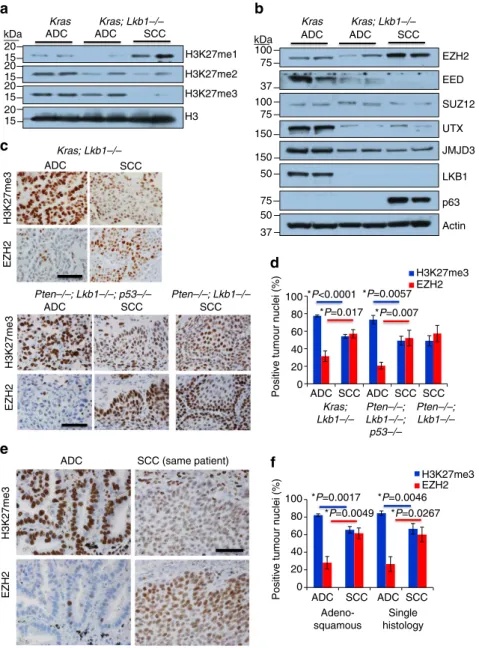
Loss of PRC2 activity accompanies SCC transition. We hypothesized that the switch from ADC to SCC could be controlled in part through epigenetic mechanisms. The decreased, yet not absent, expression of TTF1 in the SCC lesions could be indicative of epigenetic memory of prior TTF1 positivity before the squamous differentiation process occurred, as was observed in other studies30. To examine the possibility that an epigenetic mechanism such as PRC gene repression was involved in the ADC-SCC transition, we performed western blots for the common methylation marks catalysed by PRC, H3K27me1,
H3K27me2 and H3K27me3, on whole tumour extracts from KRAS-induced ADCs (no tamoxifen), KRAS/Lkb1 ADCs and KRAS/Lkb1SCCs (both tamoxifen at 10 weeks post FlpO). When compared to KRAS ADC or KRAS/Lkb1 ADC, there was a marked increase in histone H3 lysine 27 mono-methylation (H3K27me1) accompanied by a decrease in H3K27me3 in the KRAS/Lkb1SCC lesions (Fig. 3a). We next examined expression of the components of the PRC2, the protein complex that catalyses the H3K27me3 mark, by western blotting. Interestingly, although SCC lesions have higher levels of the methyltransferase EZH2 than the ADC lesions, there is a clear lack of the essential PRC2 subunit EED in the SCC lesions (Fig. 3b). In a published data set from KRAS ADC, KRAS/Lkb1 ADC and KRAS/Lkb1
SCC31, transcriptional levels of EED were not significantly different, suggesting regulation of protein stability. To explore this inverse correlation between EZH2 and H3K27me3 expression, we performed immunostaining for the two markers on serial tumour sections from KRAS/Lkb1 adenosquamous tumours,Pten/Lkb1/p53adenosquamous tumours andPten/Lkb1
squamous tumours (Fig. 3c). Consistently, we observed that ADC regions had sparse EZH2 staining and robust H3K27me3 staining. In contrast, squamous lesions on the same slides showed higher levels of EZH2 staining, and lower, but not absent, H3K27me3 staining (Fig. 3d and Supplementary Fig. 3a). We performed similar staining on human tumours, including six confirmed cases of adenosquamous cancer (Fig. 3e). Again, the pattern of higher EZH2 and slightly lower, but not completely absent, H3K27me3 was present in squamous lesions as compared to ADC lesions, which were H3K27me3 high and had lower levels of EZH2 (Fig. 3f and Supplementary Fig. 3b). While analysing these sections, we noted that normal airway and alveolar epithelium shared the ADC staining pattern of high H3K27me3 and low EZH2, while the oesophagus, which is the closest stratified squamous organ to the lung, had increased EZH2 staining and lower H3K27me3 (Supplementary Fig. 3b). This observation implies that normal lung epithelium may be maintained in a glandular state by PRC2 gene repression, and that loss of H3K27me3 gene repression may de-repress a programme predisposed to the squamous cell sate.
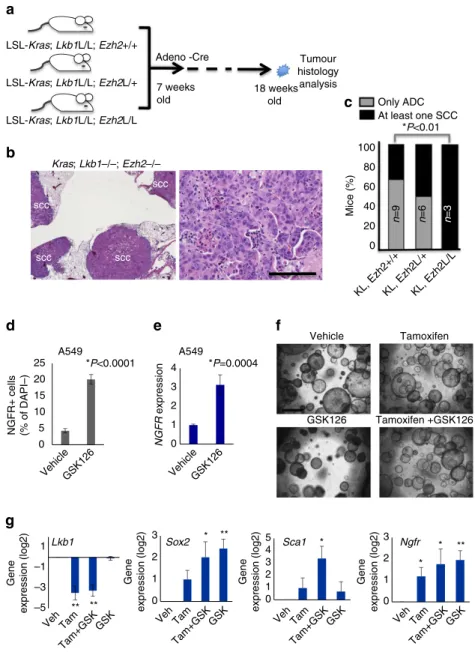
Despite the obvious lack of EZH2’s catalytic mark, higher levels of EZH2 in the squamous tumours suggested that EZH2 may be required for squamous tumour growth and could represent a therapeutic target. Therefore, we bred theEzh2floxed alleles38 to the Cre-based LSL:KrasG12D; Lkb1flox/flox model. We generated three genotypes with the Kras/Lkb1 alleles in the setting of Ezh2þ/þ,Ezh2flox/þ or Ezh2flox/floxalleles (Fig. 4a). Cohorts of these genotypes were analysed for tumour histology 11 weeks post Adeno-Cre virus administration. While theEzh2þ/þ
andEzh2flox/þcohorts both hadB40% of mice with at least one purely squamous lesion at this time-point, all of the mice from the Ezh2flox/flox cohorts had squamous lesions (Fig. 4b,c). We confirmed that both H3K27me3 and EZH2 were decreased in theseEzh2flox/floxtumours by IHC (Supplementary Fig. 4a,b). This result suggests that EZH2 is dispensable for the squamous state, and that loss of the PRC2 complex activity could potentiate the switch to SCC. This result is unique from those observed when the PRC2 complex was depleted in KRAS or KRAS/p53
tumours—without Lkb1 deletion the squamous phenotype does not appear39.
The genetic results described above suggest that loss of EZH2 function can perpetuate the squamous fate over several weeks of tumour development. We next wanted to test if inhibiting the catalytic function of EZH2 with a small molecule could drive the acquisition of squamous markers in short-termin vitro
GSK126 (ref. 40). As measured by flow cytometry, the NGFRþ cells within this cell line increased from 4.9 to 20.4% after 6 days in 10mM GSK126 (Po0.0001, Fig. 4d). RNA from the treated A549 cells likewise showed a fourfold increase in NGFR transcript level in response to GSK126 relative to vehicle-treated cultures, consistent with a de-repression of EZH2-mediated silencing of the locus (P¼0.0004; Fig. 4e). Although the
LSL:KrasG12D cells that are WT for p53 are not able to grow as two-dimensional adherent cultures, they can be grown as three-dimensional (3D) cultures37. We confirmed that growing 3D tumour organoids derived from FlpO induced KRAS lesions in 100 nM 4-hydroxy tamoxifen was able to drive deletion of the
Lkb1allele, making this a tractable system in which to observe the
early changes associated withLkb1loss (Supplementary Fig. 4c). Firstly, we observed an increase in organoid re-seeding ability with tamoxifen treatment, consistent with the acquisition of more aggressive tumour characteristics upon Lkb1 deletion in vivo
(P¼0.04; Fig. 4f and Supplementary Fig. 4d). Whereas KRAS tumour organoids were significantly decreased when passaged in continued 5mM GSK126, organoids grown in the presence of tamoxifen (and therefore Lkb1 null) were equally passaged in continued presence of the EZH2 inhibitor (P¼0.0113 for
Kras, P¼0.132 for KRAS/Lkb1; Supplementary Fig. 4d). Lastly, we observed that treating cultures with tamoxifen for 9–12 days (primary organoids) and re-seeding the cells in drug for an additional 9–12 days (secondary organoids) led a marked
1.71 0.5
10.7 87.1
0.55 14.3
80 5.17
a
b
c
SCC SCC ADC
ADC
ADC ADC
+ Tamoxifen derived SCC No tamoxifen only ADC
d
Sca1 Tam
No tam
NGFR
No Tam
Tam
*P=0.0225
Mi
c
e
(
%
)
Only ADC At least one SCC
100
80
60
40
20
0
n
=10
n
=7
7 weeks old
FlpO
ADC Tumour nodule
Tamoxifen
Tumour inoculation
SCC
KRAS ADC
ADC
Immunocompromised mice Serially passage
Delete Lkb1
e
NGFRHSca-1H cell derived SCC
transplants (100%)
0 102 103 104 105
0 102 103 104 105
0 102
103
104
105
0 102
103
104
105
NGFRLSca-1H cell derived SCC
(100%, 8 out of 8) FSF-Kras;
FSF-CreERT2
Lkb1flox/flox
decrease in Lkb1expression and an increase in Sox2, Ngfrand
Sca1 expression (Fig. 4g and Supplementary Fig. 4e). Interestingly, GSK126 treatment potentiated the increase in both Sca1 and Sox2, consistent with loss of H3K27me3 transcriptional repression allowing the SCC transition process.
Chromatin landscapes reveal de-repression of squamous genes. To characterize the chromatin landscapes of KRAS/Lkb1
tumours, we performed chromatin immunoprecipitation (ChIP) on microdissected tumours confirmed to be either ADC or SCC by histology and qPCR (Supplementary Fig. 5a). The two activating marks, histone H3 lysine 4 tri-methylation (H3K4me3)
and histone H3 lysine 27 acetylation (H3K27ac), and the PRC2-derived silencing mark, histone H3 lysine 27 tri-methylation (H3K27me3) were immunoprecipitated, followed by sequencing the chromatin bound DNA (ChIP-seq). ADC and SCC tumours could be clearly distinguished by differential H3K4me3 enrichment (Fig. 5a). Of the most significantly differential enrichment on H3K4me3 and/or H3K27ac marks between SCC and ADC tumours (Supplementary Fig. 5c and Suppleme-ntary Tables 1–4), we found much higher load of H3K27ac and H3K4me3 marks in the SCC tumour compared to the ADC tumour on the squamous genes Sox2, DNp63, Ngfr and
Krt5/6 (Fig. 5b and Supplementary Fig. 5a). Furthermore, we observed a significantly lower level of H3K27me3 mark inSox2,
H3K2
7me3
H3
K2
7
m
e3
ADC SCC (same patient) a
d H3K27me1
H3 H3K27me2
H3K27me3
ADC SCC
ADC
b
Kras Kras; Lkb1–/–
Pten–/–; Lkb1–/–; p53–/– Pten–/–; Lkb1–/–
EZH2
c
H3K27me3
EZH2
EZH2
0 20 40 60 80 100
H3K27me3 EZH2
SCC SCC SCC
ADC ADC
Positiv
e tumour
nuclei
(%) *P<0.0001
*P=0.017 *P=0.0057
*P=0.007
e
0 20 40 60 80 100
H3K27me3 EZH2
SCC SCC
ADC ADC
Adeno-squamous
Single histology
Positiv
e
tumour
nuclei
(%
)
*P=0.0017 *P=0.0049
*P=0.0046 *P=0.0267 f
ADC SCC SCC
ADC
Kras; Lkb1–/–
SCC 20
15 20 15 20 15 20 15 kDa
UTX EZH2
Actin
Kras Kras; Lkb1–/–
ADC
JMJD3 SUZ12 EED
LKB1
p63
ADC SCC
100
37 75
75 100 kDa
150
150 50
37 50 75
Pten–/–; Lkb1–/– Kras;
Lkb1–/–
Pten–/–; Lkb1–/–; p53–/–
Ngfr and Krt5/6 loci compared to those in ADC tumours, consistent with de-repression of these squamous loci in SCC tumours (Fig. 5b). The differentially enriched regions for active histone marks also included the loci for the neutrophil chemoatractants Cxcl3/5, and the interferon-response induced
Ifitm1/2/3, which were higher in the SCC tumours (Supple-mentary Fig. 5a). For ADC, the known expressed genesScgb1a1,
Foxa2 and SftpB had activating marks which were lost is SCC (Supplementary Fig. 5b). We also used the ROSE algorithm41to call super-enhancers, many of which were shared between ADC and SCC, indicating that the tumours share some epigenetic memory (Supplementary Tables 5 and 6). For ADC, a unique super-enhancer was called atScgl1a1, while
Ifitm3 was a unique super-enhancer for SCC (Supplementary
Tables 5 and 6). We next ran GREAT42 on the significantly enriched H3K4me3 loci in SCC tumours and found that the genes adjacent to these loci are enriched for H3K27me3, methylated CpG islands and PRC2 components in human embryonic stem cells and murine embryonic fibroblasts, suggesting that the activated loci in SCC tumours are normally repressed by PRC2 in other cell types (Fig. 5c). A closer examination of the H3K27ac-enriched regions in each tumour type indicated that unlike the H3K27ac-marked loci that were common to all samples, which were devoid of H3K27me3, the uniquely SCC- or ADC-enriched loci were very often bivalently marked with H3K27me3 and H3K37ac in ADC, and became monovalently marked with H3K27ac in SCC due to a loss of PRC2-mediated gene repression (Sox2is an example) (Fig. 5d). g
Gene
e
x
pr
ession (log2)
*P=0.0004 *P<0.0001
NGFR+ cells (% of
DAP
I–)
A549 A549
0 1 2 3 4
NGFR
e
x
pr
ession
0 5 10 15 20 25
e f
Vehicle
GSK126
Tamoxifen
Tamoxifen +GSK126
–5
Veh Tam
Tam+GSK GSK126
Vehicle VehicleGSK126
GSK Veh Tam Tam+GSK
GSK Veh Tam
Tam+GSK
GSK Veh Tam
Tam+GSK GSK
–3 –1
1Lkb1
0 1 2 3
Sox2
0 1 2 3 4 5 Sca1
0 1 2 3 Ngfr
* **
* *
Gene
e
x
pr
ession (log2)
** **
* **
Gene
e
x
pr
ession (log2) Gene
e
x
pr
ession (log2)
d
Tumour histology
analysis LSL-Kras; Lkb1L/L; Ezh2+/+
LSL-Kras; Lkb1L/L; Ezh2L/+ LSL-Kras; Lkb1L/L; Ezh2L/L
7 weeks old Adeno -Cre
18 weeks old
a
b
scc scc
scc
scc
Kras; Lkb1–/–; Ezh2–/–
*P<0.01
n
=9
n
=6
n
=3
Mic
e
(
%
)
c Only ADC At least one SCC 100
80 60 40 20
KL, Ezh2+/+KL, Ezh2L/+KL, Ezh2L/L
0
Lkb1k L/L
Figure 4 | Deletion or inhibition of EZH2 potentiates SCC transition.(a) Schematic of deletion ofEzh2in addition to KRAS activation andLkb1deletion. (b) Haematoxylin and eosin staining of tumours at 11 weeks post Adeno-Cre show predominant SCC histology in theEzh2fl/fl;KrasG12D;Lkb1fl/flmice, scale bar, 50mm. (c) Percentage of mice with at least one purely squamous lesion as determined by histology at end point in the four cohorts,nandPvalues indicated in the figure,Pvalues representw2-test. (d) Flow for NGFR in the KRASþ/LKB1-nullhuman line A549 treated 10mM of EZH2 inhibitor GSK126 for
6 days, data are mean±s.e.m.,n¼4,Po0.0001. (e) RT-qPCR forNGFRexpression in the A549-treated lines, data are mean±s.e.m.,n¼4,P¼0.0004. (f) Representative images of indicated secondary tumour organoids plated at 20,000 cells per transwell, scale bar, 200mm. (g) RT-qPCR forSox2,Sca1and
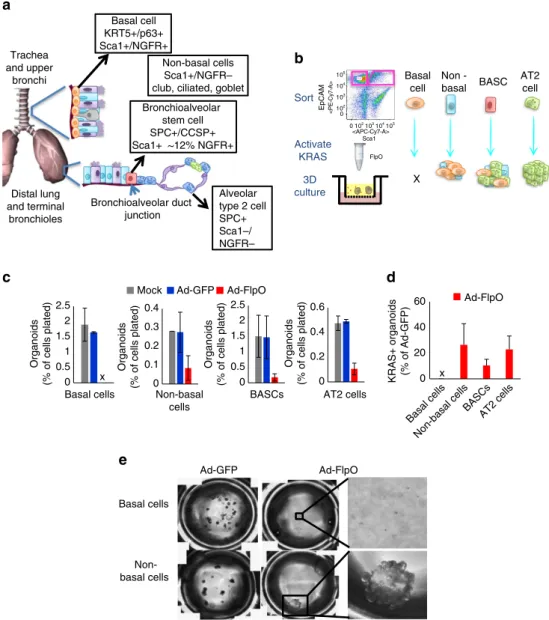
BASCs and club cells are cells-of-origin for SCC transition. We reasoned that the ‘choice’ of cells to transition to the squamous fate upon Lkb1 deletion may be predetermined by the tumour cell-of-origin. To test this theory, we used a fluorescence activated cell sorting (FACS) approach to enrich for populations of lung cells that are likely tumour cells-of-origin and which can be easily enriched using cell surface markers, including tracheal basal cells (enriched using positive selection for NGFR), non-basal cells of the trachea (the NGFR- fraction from the trachea that contains club, ciliated and goblet cells23,43), distal lung BASCs (enriched in the EpCAMþ Sca1þ fraction) and distal lung alveolar type II (AT2) cells (enriched in the EpCAMþ Sca1- fraction)12,21 (Fig. 6a and Supplementary Fig. 6a). To directly test the fitness of each population to propagate after activation of oncogenic KRAS we incubated each FACS-isolated population with no virus, adeno-GFP virus or adeno-FlpO virus before plating for organoid cultures12,20 (Fig. 6b and Supplementary Fig. 6b). Strikingly, while the non-basal cells, BASCs and AT2 populations were all able to give rise to organoids after KRAS activation (Fig. 6c–d and Supplementary
Fig. 6c), the basal cell population was consistently unable to produce any organoid after adeno-FlpO virus (Fig. 6c,d, n¼4). Visual inspection of the basal cell cultures showed single non-dividing cells several days after plating. The non-basal cells, despite having a dramatically decreased organoid forming efficiency compared to basal cells, were consistently able to grow robust KRASþ organoids (Fig. 6c–e). Both non-basal and BASC-derived organoids were predominantly bronchiolar in phenotype, while AT2-derived organoids were alveolar (Supplementary Fig. 7a).
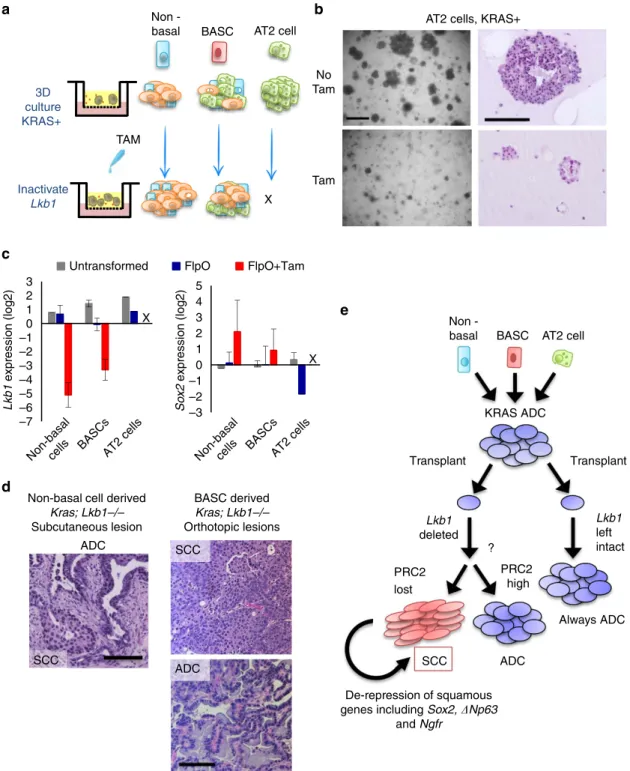
Having formed KRASþ organoids with our in vitro culture system, we next sought to delete Lkb1 in these cultures and assess if organoids could take on squamous characteristics. To accomplish this, we serially passaged the cultures and added 100 nM 4-hydroxy tamoxifen to the transwell culture media (Fig. 7a). The non-basal cell-derived and BASC-derived cultures continued robust growth in tamoxifen, but the AT2-derived cultures reproducibly failed to grow in tamoxifen (Fig. 7b and Supplementary Fig. 7a). Tamoxifen administration to AT2-derived cultures from WT mice continued to grow normally d
0 20 40 60 80 100 H3K27me3 bound genes in human ES cellsSUZ12 bound genes in human ES cells
EED bound genes in human ES cells CpG bound genes with H3K27me3 in MEFs
All H3K27ac sites Unique ADC H3K27ac sites
Unique SCC H3K27ac sites
Distance from peak centre
ADC H3K27me3 signal –1,000 –500 0 500 1,000
Distance from peak centre 0 500 1,000 –1,000 –500
0.32 0.44 0.40 0.36
SCC H3K27me3 signal0.18
0.33 0.28 0.23
a
H3K4me3 H3K27ac
H3K27me3
Sox2 Ngfr Krt6b/6a/5
ADC SCC ADC SCC ADC SCC
0 5 0 5 0 150 150 100 10
0 5 0 5 0 300 300 200 20
0 5 0 5 0 150 150 100 10
c
SCC ADC
High Low
–500 +500 +500 –500 H3K4me3
b
-Log10 (P-value)
(data not shown), suggesting that tamoxifen itself was not detrimental and that KRASþ AT2 cells cannot tolerate loss of Lkb1. We confirmed Lkb1 mRNA levels were decreased by tamoxifen administration in non-basal cell and BASC-derived cultures, and also that Sox2 gene expression was increasing in these cultures, though Sox2 expression was variable (Fig. 7c). The variability of Sox2 increase fit with the observation that only some organoids in each culture took on squamous characteristics (Supplementary Fig. 7b). Lastly, to demonstrate that we had taken a normal cell population and transformed it to a fully malignant state in vitro, we subcutaneously transplanted cells from the non-basal cell-derived cultures into immunocom-promised mice. Large tumours formed (4500mm3), and upon histological examination, these tumours had regions of squamous differentiation right next to regions of ADC differentiation (n¼2; Fig. 7d). We also transplanted cells orthotopically from
BASC-derived cultures, while one mouse had solely squamous differentiated tumour, the other had solely mucinous ADC (n¼2, Fig. 7d and Supplementary Fig. 7c). Therefore, our experiments rule out the basal cells and AT2 cells as likely cells-of-origin for adenosquamous tumours, whereas both non-basal tracheal cells and distal lung BASCs could drive squamous disease.
Discussion
Lung cancer lineage plasticity is an emerging concept that could influence the diagnosis and treatment of this devastating disease. In this manuscript, we used a unique model system to study lineage switching in KRAS-driven tumours in response to Lkb1 deletion. To validate the clinical utility of our model, we first examined a cohort of ADSCC lung cancer, finding that
Trachea and upper
bronchi
Basal cell KRT5+/p63+ Sca1+/NGFR+
Bronchioalveolar duct junction
Bronchioalveolar stem cell SPC+/CCSP+ Sca1+ ~12% NGFR+
Alveolar type 2 cell SPC+ Sca1–/ NGFR–
a
b
Non-basal cells Sca1+/NGFR– club, ciliated, goblet
Basal cell
Non -basal
AT2 cell BASC
<APC-Cy7-A>
30.6 10.6
EpCAM
Sort
Activate KRAS
3D culture
FlpO
X
c
e
d
0 0.5 1 1.5 2 2.5
0 0.1 0.2 0.3 0.4
0 0.5 1 1.5 2 2.5
0 0.2 0.4 0.6
Non-basal cells
Basal cells BASCs AT2 cells x
Basal cells
Non-basal cells
Ad-GFP Ad-FlpO
KRAS+ organoids (% of Ad-GFP)
Organoids
(% of cells plated)
Mock Ad-GFP Ad-FlpO
Organoids
(% of cells plated)
Organoids
(% of cells plated)
Organoids
(% of cells plated) 0
20 40
60 Ad-FlpO
x Distal lung
and terminal bronchioles
Basal cells Non-basal cells
BASCs AT2 cells 105
105 104
104 103
103 102
102 0
0
<PE-Cy7-A>
Sca1
the LKB1 mutation was present in more than one quarter of the patients. We next demonstrated that KRAS-driven ADCs, either in the autochthonous setting or after transplant, retained the ability to transition into squamous tumours when Lkb1was
deleted many weeks or months after KRAS induction. We further demonstrated that a loss of PRC2-mediated gene repression was a hallmark of the lineage switched SCC tumours. Lastly, our lung organoid data suggest that a combination genetic alterations,
KRAS ADC
Transplant
Lkb1 left intact
Always ADC Lkb1
deleted
PRC2 high PRC2
lost
ADC SCC
De-repression of squamous genes including Sox2, Np63
and Ngfr
a
Inactivate
Lkb1 X
3D culture KRAS+
Non
-basal BASC AT2 cell
b
? Transplant TAM
Non
-basal BASC AT2 cell
Tam No Tam
AT2 cells, KRAS+
–3
Non-basalcells BASCsAT2 cells Non-basalcells BASCsAT2 cells –2
–1 0 1 2 3 4 5
So
x2
e
x
pr
ession (log2) X
d c
e
Non-basal cell derived Kras; Lkb1–/– Subcutaneous lesion
BASC derived Kras; Lkb1–/– Orthotopic lesions –7
–6 –5 –4 –3 –2 –1 0 1 2 3
Lkb1
e
x
pr
ession (log2)
Untransformed FlpO FlpO+Tam
X
ADC SCC ADC
SCC
Figure 7 |Lkb1deletion drives squamous transition of club cell- and BASC-derived KRASþ populations.(a) Schematic ofLkb1deletion in three-dimensional KRASþcultures derived from non-basal tracheal cells, bronchioalveolar stem cells (BASCs) or alveolar type II (AT2) cells. (b) Representative brightfield images of KRASþcolonies from alveolar type II cells treated with placebo or 4-hydroxy tamoxifen for 7 days, scale bar, 200mm. (c) RT-qPCR forLkb1andSox2in tumour organoid 3D cultures treated with 100 nM tamoxifen for 9–12 days, mean±s.e.m. on log2scale is graphed,nvaries by sample. (d) Representative haematoxylin and eosin staining from non-basal cell derived subcutaneous tumour (left) and BASC-derived orthotopic tumours (right), tumour histologies are indicated, scale bar, 100mm. (e) Model: Here we combined Cre and FlpO recombinase technologies to temporally deleteLkb1in established KRAS-driven lung adenocarcinomas. Serially transplanted KRASþadenocarcinoma could transdifferentiate into squamous disease whenLkb1
was deleted in the transplanted tumours. The Polycomb Repressive Complex 2 (PRC2), which represses genes through the histone H3K27me3 mark, was abrogated in the KRAS/Lkb1squamous tumours through loss of expression of the EED subunit. This led to derepression of key squamous genes including
epigenetic state and cell-of-origin ultimately determine tumour phenotype (Fig. 7e).
Our data indicate that after Lkb1 is deleted in established KRAS ADCs, epigenetic reprogramming drives cells to take on squamous characteristics, ultimately resulting in full squamous transition of some tumours. These transitioned SCC tumours are characterized in both the mouse and human by a loss of the PRC2 H3K27me3 repressive chromatin mark, leading to activation of previously bivalently marked chromatin regions. Loss of PRC2-mediated gene repression leads to activation of squamous transcriptional programme, including the key squamous-associated genes Ngfr, Sox2, DNp63 and Krt5/6.
Sox2 and DNp63 are both well known to drive the squamous fate44–47. Thus, it is likely derepression of these genes that allows perpetuation of the squamous fate after the initial transition has occurred.
EZH2, which is the PRC2 methyltransferase that catalyses H3K27me3, has been proposed to be an oncogene in both lung ADC and SCC because its expression is correlated with poor prognosis of both histologies and its overexpression can drive ADC in mouse models39,48–50. Intriguingly, we and others have observed a decoupling of EZH2 expression levels from H3K27me3 levels in cancers51–53. In ADC regions, high and uniform H3K27me3 was found with relatively low expression of EZH2. It may be possible that EZH2 is only expressed in proliferating cells to replace the H3K27me3 marks lost during division. In SCC regions, there was often high EZH2, but lower levels of H3K27me3 mark than in ADC regions. We determined that reduction of H3K27me3 in SCCs was likely due to downregulation of the PRC2 component EED. EED loss may be the key to maintain an EZH2 high/H3K27me3 low state in other tumour types, or even in normal cells such as the oesophageal epithelium, and will warrant more study in the future. Because EZH2 was overexpressed in SCC tumours, it remained possible that EZH2 was critical for maintenance of the squamous fate with roles outside of the PRC2 complex, as has been observed in other tumour types54–56. However, genetic depletion of Ezh2actually potentiated KRAS/Lkb1SCC tumour growth, and EZH2 inhibition had no effect on KRAS/Lkb1
3D cultures. These data are supported by a recent study that demonstrated that Eed deletion accelerates KRAS/p53 tumour development by driving a switch to mucinous ADC39. Both of these studies suggest that the PRC2 complex may act as a tumour suppressor in lung cancer by limiting lineage identity.
There has been much controversy over the possible cells-of-origin of subtype and genotype-specific lung tumours. After using intranasal adenovirus-Cre to induce oncogenic KRAS, the first hyperproliferative cells observed were BASCs, implicating this population as possible ADC cells-of-origin19. More recent studies with lineage-specific KRAS activation in vivo suggested that AT2 cells appeared to be the only cells capable of giving rise to advanced ADC in the alveolar space, while club cells and BASCs appeared to be limited to driving bronchiolar hyperplasia within the same time frame57. Importantly, results varied when the genotype was altered to include SOX2 activation or p53 loss58,59. Our data add to this picture by indicating that NGFRþ basal cells cannot tolerate oncogenic KRAS. Given that basal cells express high levels of EGFR37, and that KRAS activation and EGFR activation cannot be tolerated by the same cell60, it is conceivable that basal cells undergo oncogene-induced senescence upon KRAS activation. In the more distal lung, we observed that both AT2 cells and BASCs could efficiently form KRASþ organoids. However, the AT2-derived cultures could not proliferate after Lkb1 deletion. It was the non-basal cells of the trachea, a population enriched for club, ciliated and goblet cells23,43, and the BASCs of the
distal lung that could survive both KRAS activation and
Lkb1 deletion. Both cell types gave rise to organoids that could grow in vivo, with some ADC and some SCC histology. These findings are in strong agreement with a recent paper using cell type restricted Cre virus, which also found the club cells to be more likely cells-of-origin of adenosquamous tumours of the KRAS/Lkb1 genotype36. These results are consistent with recent evidence that both CCSP and SPC expressing cells can give rise to SCCs with activation of SOX2 and inactivation of Pten and Cdkn2a45. Overall our data suggest that club cells and BASCs are the most likely cells of origin of KRAS/Lkb1 ADSCC, and that further characterization of these cell types in their normal state and in the context of oncogenic activation will shed new light on the subtype of adenosquamous cancer in patients.
What remains unclear is what why certain cells respond to Lkb1 deletion by downregulation EED and ultimate loss of PRC2-mediated gene repression of the squamous transcriptional programme. Because LKB1 affects many metabolic processes, one possibility is that metabolism of methionine is a link between LKB1 and EED. Studies with an inhibitor of S-adenosyl homocysteine hydrolase have demonstrated that decreased methionine metabolism can cause destabilization of the PRC2 components at the protein level61. Future studies will focus on identifying the link between the cellular genotype and the epigenetic identity of lung cancer cells from different subtypes of lung cancer, including ADC, SCC and ADSCC, with the ultimate goal of identifying unique vulnerabilities of each that can be used in new therapeutic approaches.
Methods
Mouse cohorts.Mouse cohorts of Lkb1flox/flox/Ptenflox/flox; LSL:KrasG12D/þ, LSL:KrasG12D/þ; Lkb1flox/flox, and FSF:KrasG12D/þ; FSF:R26:CreERT2; Lkb1flox/floxand LSL:KrasG12D/þ; Lkb1flox/flox, Ezh2floxedwere all maintained in virus-free conditions on a mixed 129/FVB background. FSF:KrasG12D(Krastm5Tyj) mice were purchased from The Jackson Laboratory; Foxn1/Foxn1Nu/Numice were purchased from Charles River Laboratories International Inc. All care and treatment of experimental animals were in strict accordance with Good Animal Practice as defined by the US Office of Laboratory Animal Welfare and approved by the Dana-Farber Cancer Institute Institutional Animal Care and Use Committee. Mice were given 2108pfu of Adeno-FlpO virus via intranasal infections at 6–8 weeks old. Mice were administrated daily by intraperitoneal injection of tamoxifen-free base (SIGMA T5648) in corn oil (12mg ml1) at 132mg tamoxifen per gram of body weight per day for five consecutive days. Magnetic resonance imaging scan was used for mouse lung tumour burden measurement as previously described37. Intratracheal transplants were performed as described62. Mice were monitored for signs of lung tumour onset and killed for gross and histological analysis and tumour isolation upon signs of distress.
Flow cytometry analysis and sorting.Tumours were dissected from the lungs of primary mice and tumour tissue was prepared as described62. Single-cell suspensions were stained using rat-anti-mouse antibodies. Antibodies for tumour cell analysis included anti-human-NGFR (EMD Millipore 05-446) coupled with goat-anti-mouse-PECy7 (BioLegend 405315), anti-mouse-NGFR (AbCAM ab8875) coupled with donkey-rabbit-PE (eBiosciences 12-4739-81), anti-mouse-Sca1-APCCy7 (Fisher Scientific BDB560654), anti-mouse-EpCAMPECy7 (BioLegend 118216), anti-mouse-CD31-APC (Fisher Scientific BDB551262) and anti-mouse-CD45-APC (Fisher Scientific BDB559864). Live cells were gated by exclusion of 40,6-diamidino-2-phenylindole (DAPI)-positive cells (SIGMA). Immune cell analysis is described in a previous study63. All antibodies were incubated for 10-15 min at 1:100 dilutions for primaries and 1:200 for secondary antibodies. Cell sorting was performed with a BD FACS Aria II with an 85 mm nozzle, and flow cytometric analysis was performed with a BD Fortessa and data were analysed with FlowJo software (Tree Star).
for the same time to control for anoikis. Cells were then pelleted by pulse spin and resuspended in 1phosphate-buffered saline (PBS) twice to wash and finally resuspended for 3D culture. Tracheal cells were cultured as described in ref. 12, with additional 25 ng ml1rmFGF2 (RþD Systems 3139-FB/CF) and in a total starting volume of 100ml of cells in media mixed with 100ml of growth factor reduced Matrigel (Fisher Scientific). Previously it was demonstrated that distal lung stem cells can differentiate into lineage-specific organoids when grown in cultures with primary lung endothelial cells (see ref. 20), and we employed these cultures for NGFRþand NGFR- BASCs as well as AT2 cells. Tracheal cells grown in the same endothelial cell cultures grew similarly hollow spheres composed of basal-like p63þcells, what appear to be lineage-negative cells and ciliated cells, just as they do in the MTEC media.
Immunofluorescence on organoid cultures.Cultured colonies were fixed with 10% neutral-buffered formalin in overnight at room temperature. After rinsing with 70% ethanol, fixed colonies were immobilized with Histogel (Thermo Scientific) for paraffin embedding. Sectioned embedded colonies were stained with haematoxylin and eosin and immunostained with antibodies for CCSP (1:200, Santa Cruz clone T-18), pro-SPC (1:200, Santa Cruz clone FL-197), p63 (1:200, Biocare clone 4A4), acetylated-tubulin (1:1,000; Sigma, clone 6-11B-1). Secondary antibody staining included donkey a-mouse 488, donkey a-rabbit 594, donkey a-goat 647 (1:400, Invitrogen) and Prolong Gold with DAPI (Life Technologies).
Tumour cell 3D culture.Dissociated tumour cells were resuspended in DME/F12 media (GIBCO) containing 1penicillin/streptomycin (Invitrogen), 4 mM L-glutamine (Invitrogen), 10% fetal bovine serum (HyClone), 10mg ml1insulin (SIGMA I-6634), 1insulin/transferrin/selenium mixture (Corning 25-800-CR), 12.5mg ml1bovine pituitary extract (Invitrogen 13028-014), 0.1mg ml1cholera toxin (SIGMA C-8052), 25 ng ml1mEGF (Invitrogen 53003018) and 25 ng ml1 rmFGF2 (RþD Systems 3139-FB/CF), mixed 1:1 with growth factor-reduced Matrigel (Fisher Scientific), and pipetted into a 12-well 0.4mm Transwell insert (Falcon). MTEC/Plus (described above) medium (500ml) was added to the lower chamber and refreshed every other day. GSK126 was purchased from Xcess Bio as a 10 mM solution in DMSO, and 4-hydroxy-Tamoxifen (SIGMA) was resuspended to a concentration of 100mM in sterile 100% ethanol. Both were diluted 1:1,000–1:2,000 into tissue culture media for use.
Quantitative RT PCR.RNA from treated cell lines was extracted using Absolutely RNA kits (Agilent) and cDNA was made using the SuperScript III kit (Invitrogen). Relative gene expression was assayed with Taqman probes on the StepOnePlus Real-Time PCR System (Applied Biosystems). Relative expression was calculated by Gene of Interest (CtreferenceCtexprimental)CYPA(CtreferenceCtexperimental) and graphed on the log2scale or converted to linear scale. Statistics were performed on log2data. For all experiments, the reference sample was a matched vehicle treated or control transduced cell line.
Statistical analysis.Statistical analyses were carried out using GraphPad Prism. All numerical data are presented as mean±s.e.m. Grouped analysis was performed
using two-way ANOVA. Column analysis was using one-way ANOVA ort-test. AP-value less than 0.05 was considered statistically significant.
Histology and immunohistochemistry.Mice were killed with CO2and the right lobe was dissected and snap-frozen for biochemical analysis. The remainder of the lungs was inflated with neutral-buffered 10% formalin overnight at room temperature, and then transferred to 70% ethanol, embedded in paraffin and sectioned at 5mm. Haematoxylin and eosin stains were performed in the Department of Pathology in Brigham and Women’s Hospital. Tumour burden analysis was performed with ImageJ software. Immunohistochemistry was performed as previously described37. Antibodies used for other markers are listed below: LKB1 (Cell Signaling 3047S), TTF1 (DAKO M3575), p63 (AbCAM ab53039), SOX2 (Millipore AB5603), NGFR (Epitomics 1812-1), MPO (Novus R-1073), F4/80 (eBioscience 14-4801-82) and p63 (Santa Cruz sc-25268). Scoring of H3K27me3 (Cell Signaling 9733) and EZH2 (Cell signaling 5246S) nuclear staining was performed with Nikon NIS-Elements AR software. Magnification images of 20 or 40 were captured of both ADC and SCC regions as judged by a pathologist. Regions of stroma (blood cells, vessels, fibroblasts and connective tissue) were deleted from the images by hand, prior to using the dot detection module to quantify all nuclei on the red channel, and to quantify stained nuclei with increasing stringency on the blue channel. Visual confirmation of one dot per nucleus and cutoff for stained signal were confirmed by the user for each set of images. Importantly, cutoff settings remained the same for ADC and SCC images from the same slide, allowing direct comparison of staining intensities in the mixed adenosquamous cases. Percentages of positive nuclei were quantified and graphed.
Western blot.Whole-cell extracts were made in RIPA buffer (0.5% deoxycholate, 1% IGEPAL-CA630, 0.1% sodium dodecyl sulfate, 150 mM NaCl, 50 mM Tris-8.1), lysates were cleared by centrifugation and protein concentrations were quantified with the Pierce BCA Protein Assay Kit (Thermo). For western blotting, 25mg of protein extract per sample was denatured with heat and reducing agents, separated on a 4–12% acrylamide gel (BioRad) and transferred to nitrocellulose (GE Healthcare). Antibodies used for western blotting were EZH2 (BD Trans-duction Laboratories 612666, 1:1,000), LKB1 (Cell Signaling 3047S, 1:1,000), SUZ12 (AbCAM ab12073, 1:1,000), EED (Millipore 09-774, 1:500), JMJD3 (Aviva Systems Biology ARP40101_P050, 1:500), UTX (GeneTex GTX121246, 1:1,000), total Erk1,2 (Cell Signaling Technology 4695S 1:2,000), pERK1,2 (Cell Signaling Technology 4376S, 1:1,000), pAMPK (Thr172) (40H9 Cell Signaling 2535 1:1,000), Histone H3 (AbCAM ab1791, 1:20,000), H3K27me1 (Millipore 07-448 1:2,000), H3K27me2 (Millipore 07-452 1:2,000) and H3K27me3 (Millipore 07-449; 1:4,000) all incubated overnight at 4°C.b-Actin-HRP (SIGMA A3854, 1:20,000) was used as a loading control. All antibodies have detailed species validation available online from vendors. Secondary antibody Anti-rabbit IgG, HRP-linked Antibody (Cell Signaling 7074, 1:2,000) or Anti-mouse IgG, HRP-linked Antibody (Cell Signaling 7076, 1:2,000) was incubated for 1 h at room temperature. After washing, chemiluminescence was visualized with Western Lightning Plus-ECL (PerkinElmer) and exposed onto KODAK BioMax XAR film.
Chromatin immunoprecipitation and sequencing (ChIP-seq).Lung tumours were pulverized, crosslinked with 1% formaldehyde in PBS for 10 min at RT, washed in 5 mg ml1bovine serum albumin in PBS and then in just cold PBS, re-suspended in lysis buffer (50 mM Tris-HCl, pH 8.1, 10 mM EDTA, 1% SDS, 1complete protease inhibitors (Roche)) and sonicated with the Covaris E210 or S2 sonicator to obtain chromatin fragment lengths of 200-to-1,500 bp judged by Bioanalyzer DNA High sensitivity kit (Agilent). Fragmented chromatin was diluted in IP buffer (20 mM Tris-HCl pH 8.1, 150 mM NaCl, 2 mM EDTA, 1% Triton X-100) and incubated overnight at 4°C with Protein G magnetic beads (Dynabeads: Life Technologies) that had been pre-incubated with H3K4me3 (Millipore 07-473), H3K27Ac (Abcam ab4729) or H3K27me3 (Cell Signaling Technologies C36B11) antibodies. Immunoprecipitates were washed six times with wash buffer (50 mM HEPES pH 7.6, 0.5 M LiCl, 1 mM EDTA, 0.7% Na deoxycholate, 1% NP-40) and twice with TE buffer. Immunoprecipitated (or no IP input) DNA was treated with RNase A and Proteinase K on the beads, recovered in 1% SDS and 0.1 M NaHCO3over a period of 5 h at 65°C, column purified with DNA clean and concentrator-25 (Zymo Research). After a sonication to enrich DNA fragment lengths between 100 and 300 bp, 5–10 ng of DNA were used for the library construction using NEBNext Ultra DNA Library Prep Kit (NEB E7370). Sequencing was performed on a NextSeq (Illumina) for 38 nucleotides from paired ends according to the manufacturer’s instructions.
ChIP-seq analysis.Sequenced reads were mapped to reference mouse genome build 38 (mm10), using bowtie2 aligner64. H3K4me3, H3K27Ac modified regions were identified using MACS (version 1.4.2) as previously described (Zhanget al., 2008)65, with aP-value cutoff of 105and with default values for other parameters. Computer code is available upon request. Quantitative differences of histone modification between ADC and SCC tumours fromKras/ Lkb1mice were analysed using the MAnorm algorithm66with aP-value cutoff of 1010and41 log2fold change for H3K4me3 and H3K27Ac.
Wiggle files with a 10 bp resolution for H3K4me3, H3K27ac and H3K27me3 modifications were generated by MACS v1.4.2 with tag shift and then rescaled to a larger of total number of uniquely alignable sequences in two data sets. Histone modification profiles were then generated with the ‘heatmap’ function or the SitePro module in Cistrome analysis pipeline (http://cistrome.org/). Wiggle files were also visualized in the Integrative Genomics Viewer (Robinsonet al., 2011)67.
To correlate ChIP-Seq and gene set enrichment, peaks were associated with genes using GREAT42, allowing for a maximum distance of 10 kb between peak and associated gene, irrespective of directionality. Data are available at GEO repository (accession number GSE94365).
hybrid capture kit and an Illumina HiSeq 2500 sequencer. Data were analysed by an internally developed bioinformatics pipeline composed of reconfigured publicly available tools and internally developed algorithms including Indelocator http://www.broadinstitute.org/cancer/cga/indelocator and Oncotator69,70. Samples with a mean target coverage ofo50were excluded from further analysis. Individual variants present ato10% allele fraction or in regions with
o50coverage were flagged for manual review and interpreted by the reviewing laboratory scientists and molecular pathologists based on overall tumour percentage, read depth, complexity of alteration and evidence for associated copy number alterations.
Data availability.Supporting data are available upon request from the corresponding authors.
References
1. TCGA. Comprehensive genomic characterization of squamous cell lung cancers.Nature489,519–525 (2012).
2. TCGA. Comprehensive molecular profiling of lung adenocarcinoma.Nature
511,543–550 (2014).
3. Travis, W. Pathology of lung cancer.Clin. Chest Med.32,669–692 (2011). 4. Davidson, M. R., Gazdar, A. F. & Clarke, B. E. The pivotal role of
pathology in the management of lung cancer.J. Thorac. Dis.S463–S478
ð2013Þ:
5. Filosso, P. L.et al.Adenosquamous lung carcinomas: a histologic subtype with poor prognosis.Lung Cancer74,25–29 (2011).
6. Guo, Y.et al.Clinicopathological characteristics and prognosis of patients with adenosquamous lung carcinoma.J. Huazhong Univ. Sci. Technol. [Med. Sci.]
35,350–355 (2015).
7. Vassella, E.et al.Molecular profiling of lung adenosquamous carcinoma: hybrid or genuine type?Oncotarget6,23905–23916 (2015).
8. Hou, S. H. & Xiangkun, J. H. Squamous transition of lung adenocarcinoma and drug resistance.Trends Cancer2,463–466 (2016).
9. Langer, C. J., Besse, B., Gualberto, A., Brambilla, E. & Soria, J. C. The evolving role of histology in the management of advanced non-small-cell lung cancer.
J. Clin. Oncol.28,5311–5320 (2010).
10. Hegab, A. E.et al.novel stem/progenitor cell population from murine tracheal submucosal gland ducts with multipotent regenerative potential.Stem Cells29,
1283–1293 (2011).
11. Rock, J. R. & Hogan, B. L. M. Epithelial progenitor cells in lung development, maintenance, repair, and disease.Annu. Rev. Cell Dev. Biol.27,493–512
ð2011Þ:
12. Rock, J. R.et al.Basal cells as stem cells of the mouse trachea and human airway epithelium.Proc. Natl Acad. Sci. USA106,12771–12775 (2009).
13. Rawlins, E. L.et al.The role of Scgb1a1þClara cells in the long-term maintenance and repair of lung airway, but not alveolar, epithelium.Cell Stem Cell4,525–534 (2009).
14. Teixeira, V. H.et al.Stochastic homeostasis in human airway epithelium is achieved by neutral competition of basal cell progenitors.eLife2,e00966 (2013).
15. Teisanu, R. M., Lagasse, E., Whitesides, J. F. & Stripp, B. R. Prospective isolation of bronchiolar stem cells based upon immunophenotypic and autofluorescence characteristics.Stem Cells27,612–622 (2009).
16. Desai, T. J., Brownfield, D. G. & Krasnow, M. A. Alveolar progenitor and stem cells in lung development, renewal and cancer.Nature507,190–194 (2014).
17. Barkauskas, C. E.et al.Type 2 alveolar cells are stem cells in adult lung.J. Clin. Invest.123,3025–3036 (2013).
18. Tropea, K. A.et al.Bronchioalveolar stem cells increase after mesenchymal stromal cell treatment in a mouse model of bronchopulmonary dysplasia.Am. J. Physiol. - Lung Cell. Mol. Physiol.302,L829–L837 (2012).
19. Kim, C.et al.Identification of bronchioalveolar stem cells in normal lung and lung cancer.Cell121,823–835 (2005).
20. Lee, J. H.et al.Lung stem cell differentiation in mice directed by endothelial cells via a BMP4-NFATc1-thrombospondin-1 axis.Cell156,
440–455 (2014).
21. Zacharek, S. J.et al.Lung stem cell self-renewal relies on BMI1-dependent control of expression at imprinted loci.Cell Stem Cell9,272–281
ð2010Þ:
22. Rock, J. R.et al.Multiple stromal populations contribute to pulmonary fibrosis without evidence for epithelial to mesenchymal transition.Proc. Natl Acad. Sci.
108,E1475–E1483 (2011).
23. Tata, P. R.et al.Dedifferentiation of committed epithelial cells into stem cells
in vivo.Nature503,218–223 (2013).
24. Vaughan, A. E.et al.Lineage-negative progenitors mobilize to regenerate lung epithelium after major injury.Nature517,621–625 (2015).
25. Ray, S.et al.Rare SOX2þairway progenitor cells generate KRT5þcells that repopulate damaged alveolar parenchyma following influenza virus infection.
Stem Cell Rep.7,817–825 (2016).
26. Ji, H.et al.LKB1 modulates lung cancer differentiation and metastasis.Nature
448,807–810 (2007).
27. Matsumoto, S.et al.Prevalence and specificity of LKB1 genetic alterations in lung cancers.Oncogene26,5911–5918 (2007).
28. Liu, W.et al.LKB1/STK11 inactivation leads to expansion of a prome-tastatic tumor subpopulation in melanoma.Cancer Cell21,751–764
ð2012Þ:
29. Gao, Y.et al.YAP inhibits squamous transdifferentiation of Lkb1-deficient lung adenocarcinoma through ZEB2-dependent DNp63 repression.Nat. Commun.
5,4629 (2014).
30. Li, F.et al.LKB1 inactivation elicits a redox imbalance to modulate non-small cell lung cancer plasticity and therapeutic response.Cancer Cell27,698–711 (2015).
31. Han, X.et al.Transdifferentiation of lung adenocarcinoma in mice with Lkb1 deficiency to squamous cell carcinoma.Nat. Commun.5,3261 (2014).
32. Koivunen, J. P.et al.Mutations in the LKB1 tumour suppressor are frequently detected in tumours from Caucasian but not Asian lung cancer patients.Br. J. Cancer99,245–252 (2008).
33. Shi, X.et al.Screening for major driver oncogene alterations in adenosquamous lung carcinoma using PCR coupled with next-generation and Sanger sequencing methods.Sci. Rep.6,22297 (2016).
34. Snyder, Eric L.et al.Nkx2-1 represses a latent gastric differ. program in lung adenocarcinoma.Mol. Cell50,185–199 (2013).
35. Koyama, S.et al.STK11/LKB1 deficiency promotes neutrophil recruitment and proinflammatory cytokine production to suppress T-cell activity in the lung tumor microenvironment.Cancer Res.76,999–1008 (2016).
36. Nagaraj, A. S.et al.Cell of origin links histotype spectrum to immune microenvironment diversity in non-small-cell lung cancer driven by mutant Kras and loss of Lkb1.Cell Rep.18,673–684 (2017).
37. Xu, C.et al.Loss of Lkb1 and Pten leads to lung squamous cell carcinoma with elevated PD-L1 expression.Cancer Cell25,590–604 (2014).
38. Shen, X.et al.EZH1 mediates methylation on histone H3 lysine 27 and complements EZH2 in maintaining stem cell identity and executing pluripotency.Mol. Cell32,491–502 (2008).
39. Serresi, M.et al.Polycomb Repressive Complex 2 is a barrier to KRAS-driven inflammation and epithelial–mesenchymal transition in non-small-cell lung cancer.Cancer Cell29,17–31 (2016).
40. McCabe, M. T.et al.EZH2 inhibition as a therapeutic strategy for lymphoma with EZH2-activating mutations.Nature492,108–112 (2012).
41. Love´n, J.et al.Selective inhibition of tumor oncogenes by disruption of super-enhancers.Cell153,320–334 (2013).
42. McLean, C.et al.GREAT improves functional interpretation of cis-regulatory regions.Nat. Biotechnol.28,495–501 (2010).
43. Hogan, Brigid L. M.et al.Repair and regeneration of the respiratory system: complexity, plasticity, and mechanisms of lung stem cell function.Cell Stem Cell15,123–138 (2014).
44. Mukhopadhyay, A.et al.Sox2 cooperates with Lkb1 loss in a mouse model of squamous cell lung cancer.Cell Rep.8,40–49 (2014).
45. Ferone, G.et al.SOX2 is the determining oncogenic switch in promoting lung squamous cell carcinoma from different cells of origin.Cancer Cell30,519–532 (2016).
46. Watanabe, H.et al.SOX2 and p63 colocalize at genetic loci in squamous cell carcinomas.J. Clin. Invest.124,1636–1645 (2014).
47. Ramsey, M. R., He, L., Forster, N., Ory, B. & Ellisen, L. W. Physical association of HDAC1 and HDAC2 with p63 mediates transcriptional repression and tumor maintenance in squamous cell carcinoma.Cancer Res.71,4373–4379 (2011).
48. Kikuchi, J.et al.Distinctive expression of the polycomb group proteins Bmi1 polycomb ring finger oncogene and enhancer of zeste homolog 2 in nonsmall cell lung cancers and their clinical and clinicopathologic significance.Cancer
116,3015–3024 (2010).
49. Huqunet al.Enhancer of zeste homolog 2 is a novel prognostic biomarker in nonsmall cell lung cancer.Cancer118,1599–1606 (2012).
50. Zhang, H.et al.Oncogenic deregulation of EZH2 as an opportunity for targeted therapy in lung cancer.Cancer Discov.6,1006–1021 (2016).
51. Chen, X.et al.High expression of trimethylated histone H3 at lysine 27 predicts better prognosis in non-small cell lung cancer.Int. J. Oncol.43,1467–1480 (2013).
52. Holm, K.et al.Global H3K27 trimethylation and EZH2 abundance in breast tumor subtypes.Mol. Oncol.6,494–506 (2012).
53. Chen, S.et al.H2AK119Ub1 and H3K27Me3 in molecular staging for survival prediction of patients with pancreatic ductal adenocarcinoma.Oncotarget5,
10421–10433 (2014).
55. Shi, B.et al.Integration of estrogen and Wnt signaling circuits by the Polycomb Group Protein EZH2 in breast cancer cells.Mol. Cell. Biol.27,5105–5119 (2007).
56. Lee, S. T.et al.Context-specific regulation of NFKB target gene expression by EZH2 in breast cancers.Mol. Cell43,798–810.
57. Xu, X.et al.Evidence for type II cells as cells of origin of K-Ras-induced distal lung adenocarcinoma.Proc. Natl Acad. Sci.109,4910–4915 (2012). 58. Sutherland, K. D.et al.Multiple cells-of-origin of mutant K-Ras-induced mouse
lung adenocarcinoma.Proc. Natl Acad. Sci.111,4952–4957 (2014). 59. Xu, X.et al.The cell of origin and subtype of K-Ras-induced lung tumors are
modified by Notch and Sox2.Genes Dev.28,1929–1939 (2014).
60. Unni, A. M., Lockwood, W. W., Zejnullahu, K., Lee-Lin, S.-Q. & Varmus, H. Evidence that synthetic lethality underlies the mutual exclusivity of oncogenic KRAS and EGFR mutations in lung adenocarcinoma.eLife4,e06907 (2015). 61. Choudhury, S. R.et al.(-)-Epigallocatechin-3-gallate and DZNep reduce
polycomb protein level via a proteasome-dependent mechanism in skin cancer cells.Carcinogenesis32,1525–1532 (2011).
62. Curtis, S. J.et al.Primary tumor genotype is an important determinant in identification of lung cancer propagating cells.Cell Stem Cell7,127–133 (2010).
63. Akbay, E. A.et al.Activation of the PD-1 pathway contributes to immune escape in EGFR-driven lung tumors.Cancer Discov.3,1355–1363 (2013).
64. Langmead, B., Trapnell, C., Pop, M. & Salzberg, S. L. Ultrafast and memory-efficient alignment of short DNA sequences to the human genome.Genome Biol.10,R25 (2009).
65. Zhang, Y.et al.Model-based Analysis of ChIP-Seq (MACS).Genome Biol9,
R137 (2008).
66. Shao, Z., Zhang, Y., Yuan, G. C., Orkin, S. H. & Waxman, D. J. MAnorm: a robust model for quantitative comparison of ChIP-Seq data sets.Genome Biol.
13,R16 (2012).
67. Robinson, J. T.et al.Integrative genomics viewer.Nat Biotechnol29,24–26 (2011).
68. Wagle, N.et al.High-throughput detection of actionable genomic alterations in clinical tumor samples by targeted, massively parallel sequencing.Cancer Discov.2,82–93 (2012).
69. Cibulskis, K.et al.Sensitive detection of somatic point mutations in impure and heterogeneous cancer samples.Nat. Biotech.31,213–219 (2013).
70. Ramos, A. H.et al.Oncotator: cancer variant annotation tool.Hum. Mutat.36,
E2423–E2429 (2015).
Acknowledgements
We thank the Kim and Wong Labs for helpful discussions. This work was supported in part by PF-12-151-01-DMC from the American Cancer Society, the Uniting Against Lung Cancer Young Investigator Award and NCI K22 CA201036 (to C.F.B.),
R01 HL090136, R01 HL132266, R01 HL125821, U01 HL100402 RFA-HL-09-004, American Cancer Society Research Scholar Grant RSG-08-082-01-MGO, the V Foundation for Cancer Research, a Basil O’Conner March of Dimes Starter Award and the Harvard Stem Cell Institute (to C.F.K.), the NIH/NCI P01 CA120964,
5R01CA163896-04, 1R01CA195740-01, 5R01CA140594-07, 5R01CA122794-10 and 5R01CA166480-04 grants and Support from Gross-Loh Family Fund for Lung Cancer Research and Susan Spooner Family Lung Cancer Research Fund at Dana-Farber Cancer Institute (to K.K.W.).
Author contributions
H.Z., C.F.B., S.K., H.W., C.F.K. and K.K.W conceived the ideas and designed the experiments, acquired the data and performed the analyses and interpretations. M.G., C.G.A., M.P., G.S.H, G.L., X.Z., B.P.M., S.J.T., C.X., Z.C., X.W. and E.A. provided technical assistance. T.C. and S.L. assisted with mouse experiments. A.J.R., L.M.S. and M.Z. provided clinical samples and contributed to clinical data analyses. S.P., A.K.R., D.J.K, J.A.D., A.J.B., N.E.S., G.D., P.S.H., H.J., N.B. and D.S. provided materials and contributed to data interpretation and manuscript preparations. L.M.S. contributed to pathological examination. H.Z., C.F.B., C.F.K. and K.K.W. wrote the manuscript.
Additional information
Supplementary Informationaccompanies this paper at http://www.nature.com/ naturecommunications
Competing interests:The authors declare no competing financial interests.
Reprints and permissioninformation is available online at http://npg.nature.com/ reprintsandpermissions/
How to cite this article:Zhang, H.et al. Lkb1inactivation drives lung cancer lineage switching governed by Polycomb Repressive Complex 2.Nat. Commun.8, 14922 doi: 10.1038/ncomms14922 (2017).
Publisher’s note:Springer Nature remains neutral with regard to jurisdictional claims in published maps and institutional affiliations.
This work is licensed under a Creative Commons Attribution 4.0 International License. The images or other third party material in this article are included in the article’s Creative Commons license, unless indicated otherwise in the credit line; if the material is not included under the Creative Commons license, users will need to obtain permission from the license holder to reproduce the material. To view a copy of this license, visit http://creativecommons.org/licenses/by/4.0/
Erratum:
Lkb1
inactivation drives lung cancer
lineage switching governed by Polycomb
Repressive Complex 2
Haikuo Zhang, Christine Fillmore Brainson, Shohei Koyama, Amanda J. Redig, Ting Chen, Shuai Li, Manav Gupta,
Carolina Garcia-de-Alba, Margherita Paschini, Grit S. Herter-Sprie, Gang Lu, Xin Zhang, Bryan P. Marsh,
Stephanie J. Tuminello, Chunxiao Xu, Zhao Chen, Xiaoen Wang, Esra A. Akbay, Mei Zheng, Sangeetha Palakurthi,
Lynette M. Sholl, Anil K. Rustgi, David J. Kwiatkowski, J. Alan Diehl, Adam J. Bass, Norman E. Sharpless,
Glenn Dranoff, Peter S. Hammerman, Hongbin Ji, Nabeel Bardeesy, Dieter Saur, Hideo Watanabe, Carla F. Kim
& Kwok-Kin Wong
Nature Communications8:14922 doi: 10.1038/ncomms14922 (2017); Published 7 Apr 2017; Updated 9 Jun 2017
The affiliation details for Hideo Watanabe are incorrect in this Article. The correct affiliation details for this author are given below:
Department of Medicine, Division of Pulmonary, Critical Care and Sleep Medicine; Tisch Cancer Institute, Icahn School of Medicine at Mount Sinai, New York, New York 10029, USA.
Open AccessThis article is licensed under a Creative Commons Attribution 4.0 International License, which permits use, sharing, adaptation, distribution and reproduction in any medium or format, as long as you give appropriate credit to the original author(s) and the source, provide a link to the Creative Commons license, and indicate if changes were made. The images or other third party material in this article are included in the article’s Creative Commons license, unless indicated otherwise in a credit line to the material. If material is not included in the article’s Creative Commons license and your intended use is not permitted by statutory regulation or exceeds the permitted use, you will need to obtain permission directly from the copyright holder. To view a copy of this license, visit http://creativecommons.org/licenses/by/4.0/