R E S E A R C H A R T I C L E
Open Access
Infection and RNA-seq analysis of a
zebrafish
tlr2
mutant shows a broad
function of this toll-like receptor in
transcriptional and metabolic control and
defense to
Mycobacterium marinum
infection
Wanbin Hu
1†, Shuxin Yang
1,2†, Yasuhito Shimada
1,3, Magnus Münch
4,5, Rubén Marín-Juez
1,6,
Annemarie H. Meijer
1and Herman P. Spaink
1*Abstract
Background:The function of Toll-like receptor 2 (TLR2) in host defense against pathogens, especially Mycobacterium tuberculosis(Mtb) is poorly understood. To investigate the role of TLR2 during mycobacterial infection, we analyzed the response oftlr2zebrafish mutant larvae to infection withMycobacterium marinum(Mm), a close relative to Mtb, as a model for tuberculosis. We measured infection phenotypes and transcriptome
responses using RNA deep sequencing in mutant and control larvae.
Results:tlr2mutant embryos at 2 dpf do not show differences in numbers of macrophages and neutrophils
compared to control embryos. However, we found substantial changes in gene expression in these mutants, particularly in metabolic pathways, when compared with the heterozygotetlr2+/−control. At 4 days after Mm infection, the total bacterial burden and the presence of extracellular bacteria were higher intlr2−/−larvae than in tlr2+/−, ortlr2+/+larvae, whereas granuloma numbers were reduced, showing a function of Tlr2 in zebrafish host defense. RNAseq analysis of infectedtlr2−/−versustlr2+/−shows that the number of up-regulated and down-regulated genes in response to infection was greatly diminished intlr2mutants by at least 2 fold and 10 fold, respectively. Analysis of the transcriptome data and qPCR validation shows that Mm infection oftlr2mutants leads to decreased mRNA levels of genes involved in inflammation and immune responses, includingil1b,tnfb,cxcl11aa/ ac,fosl1a, andcebpb. Furthermore, RNAseq analyses revealed that the expression of genes for Maf family
transcription factors, vitamin D receptors, and Dicps proteins is altered intlr2mutants with or without infection. In addition, the data indicate a function of Tlr2 in the control of induction of cytokines and chemokines, such as the CXCR3-CXCL11 signaling axis.
(Continued on next page)
© The Author(s). 2019Open AccessThis article is distributed under the terms of the Creative Commons Attribution 4.0 International License (http://creativecommons.org/licenses/by/4.0/), which permits unrestricted use, distribution, and reproduction in any medium, provided you give appropriate credit to the original author(s) and the source, provide a link to the Creative Commons license, and indicate if changes were made. The Creative Commons Public Domain Dedication waiver (http://creativecommons.org/publicdomain/zero/1.0/) applies to the data made available in this article, unless otherwise stated.
* Correspondence:h.p.spaink@biology.leidenuniv.nl
†Wanbin Hu and Shuxin Yang contributed equally to this work.
1Institute of Biology, Leiden University, P.O. Box 9505, 2300 RA Leiden, the
Netherlands
(Continued from previous page)
Conclusion:The transcriptome and infection burden analyses show a function of Tlr2 as a protective factor against mycobacteria. Transcriptome analysis revealedtlr2-specific pathways involved in Mm infection, which are related to responses to Mtb infection in human macrophages. Considering its dominant function in control of transcriptional processes that govern defense responses and metabolism, the TLR2 protein can be expected to be also of importance for other infectious diseases and interactions with the microbiome.
Keywords:Tuberculosis, Mycobacterium, TLR2, RNAseq, RNA deep sequencing, Transcriptomics, Zebrafish
Background
Mycobacterium tuberculosis (Mtb) is the causative agent
of tuberculosis (TB), which infects nearly 23% of the world’s population, and kills about 1.6 million people an-nually (WHO Global Tuberculosis Report 2018). TB is characterized by the formation of granulomas, aggregates of infected macrophages and other immune cells, not only in the lung but also in other tissues and organs [1]. The formation of granulomas is the result of a concerted ac-tion of host innate and adaptive immunity [2–4].
Innate immune responses play a critical role in defense against TB infection in the host, and for a major part these processes are mediated by Toll-like receptors (TLRs), a conserved family of pattern recognition recep-tors. TLR2 is one of the most widely reported members of the TLR family to be involved in defense against Mtb by virtue of its recognition of cell wall-associated com-ponents associated with this pathogen [5–7]. Following mycobacterial infection in human cell cultures, TLR2 di-merizes with TLR1 or TLR6, and recognizes mycobac-terial components such as cell wall glycolipids LAM and LM [8], 38-kDa and 19-kDa mycobacterial glycoprotein (LpqH) [9–11], phosphatidylinositol mannoside (PIM) [12], and triacylated (TLR2/TLR1) [13, 14] or diacylated (TLR2/TLR6) lipoproteins [15, 16]. Then, these hetero-dimers recruit the MYD88 and TIRAP (MAL) proteins to activate the IRAK (1 and 4)/TRAF6/IKK (αorβ) cas-cade, which subsequently leads to the ubiquitination of IκBαand the activation of transcription factor NF-κB or AP-1 to induce the expression of host defense genes and cytokine and chemokine responses [17, 18]. Once re-leased after further processing, these cytokines and che-mokines attract migration of macrophages and neutrophils to the infection site and activate the micro-bicidal functions of these cells.
TLR2 has been shown to be important for granuloma formation in Mtb infection in mouse infection model [19]. Other studies have reported thatTlr2−/− mice lose control to high dose infection of Mtb delivered by aero-sol administration and show higher susceptibility to Mtb infection compared to the wild type [20, 21]. However, using lower doses of infection of 100 bacteria, there are controversial results as to the function of TLR2 in
defense to Mtb in rodent models [20–22]. Furthermore, the function of TLR2 in susceptibility to Mtb is still un-clear because several independent studies have reported polymorphisms of TLR2 (TLR1 and TLR6) in humans that have been linked with TB susceptibility, whereas others have been unable to find such links [23,24].
Several studies suggest that the interaction between TLR2 and Mtb or other pathogens does not always pro-mote the killing of bacteria, but can in fact be part of the pathogens’s strategy to evade the immune system [25–27]. TLR2 has been reported to inhibit MHC-II ex-pression on the surface of murine macrophages, thereby preventing presentation of Mtb antigens, which may allow intracellular Mtb to evade immune surveillance and maintain chronic infection [11, 28]. Furthermore, LprG from Mtb was reported to inhibit human macro-phage class II MHC antigen processing through TLR signaling [25]. In other infection systems, Tlr2 mutant mice have an increased resistance against infection of Candida albicans [29] and Yersinia pestis [30]. It has been proposed that this phenotype is the result of Tlr2-dependent induction of the anti-inflammatory cytokine IL-10 [30]. Furthermore, TLR2 activation inhibits the re-lease of IL-12 via activation of the cFos transcription fac-tor. It also has been shown that IFN-γor IFN-γ-induced signals [31] are inhibited after infection of murine mac-rophages in a Tlr2-dependent fashion [32]. These effects show that TLR2 activation can yield a bias to T helper Type 2 (Th2) cells [33], and by breaking the Th1/Th2 balance can lead to less Th1 type responses and redu-cing the killing of intracellular pathogens. However, most of the molecular mechanisms underlying TLR2 functions remain unknown and a better understanding of the TLR2-mediated immune response and immune evasion can help in planning prevention and therapy strategies against Mtb infection.
[34,35], which gives the possibility to study the host in-nate immune response to infection in the absence of adaptive immune responses. Second, zebrafish can be in-fected by Mycobacterium marinum (Mm), a natural pathogen of cold-blooded vertebrates and a close relative of Mtb, which can induce granuloma formation in zeb-rafish, similar to human TB [36,37]. Third, the transpar-ent larvae are ideal for imaging the early steps of the infection process in real time. Hence, zebrafish has earned its place of being a versatile tuberculosis model [1, 38, 39]. Although zebrafish has no lungs and there-fore the route of infection is through other tissues, it has been shown that the parasitism of immune cells and the aggregation of infected cells into granulomatous aggre-gates are highly similar to that in mammals [40]. Never-theless, there are some notable difference with the progression of the tuberculosis infection processes in mice [41].
The TLR signaling pathway in zebrafish appears to be highly conserved with that in mammals [42]. The zebra-fish tlr2 gene and the genes encoding its adaptor pro-teins are highly similar in sequence to those of mammals and mutation of the down-stream signaling gene myd88 leads to phenotypes that correlate with those seen in ro-dent and human cell culture studies [43,44]. In our pre-vious study, we demonstrated that the mammalian TLR2 ligand Pam3CSK4, a synthetic triacylated lipopeptide that mimics the triacylated lipoprotein of mycobacteria, could also specifically activate the zebrafish Tlr2 path-way, inducing fosl1a and cebpb gene upregulation [45]. In the current study, to further explore the involvement of Tlr2 in Mm infection, we conducted infection studies usingtlr2mutant zebrafish. We found that atlr2 muta-tion led to an overall increased Mm bacterial burden, corresponding with reduced presence of macrophages in the granulomatous aggregates and more extracellular growth. These results indicate that Tlr2 plays an import-ant role in protecting the host during the early stage of mycobacterial infection. In addition, we performed RNA deep sequencing (RNAseq) and determined a Tlr2-specific gene list for the response to Mm infection. This analysis revealed that most of transcriptional downregu-lation caused by Mm infection in control animals was abrogated by tlr2mutation, in addition to a dampening effect on the upregulation of transcription factors and inflammatory genes.
Results
Characterisation of atlr2mutant zebrafish line
The tlr2sa19423 mutant (tlr2−/−) carries a thymine to ad-enine point mutation that creates a premature stop codon (Fig. 1a), which is located in the sequence coding for the C-terminus of the leucine-rich repeat (LRR) do-main. This leads to a truncated protein without the Toll/
IL-1 receptor (TIR) domain, which is required for the interaction with Myd88 and Tirap (Mal) [46,47].
To confirm whether tlr2 mutation blocks its down-stream pathway, we analyzed the gene expression pro-files of zebrafish treated with the TLR2 agonist, Pam3CSK4 similarly as in our previous work [48], now also including the heterozygote mutant (tlr2+/−). Pam3CSK4 was injected into the blood island of zebra-fish embryos at 27 h post fertilization (hpf). One hour after injection (hpi), we collected samples and performed qPCR to analyze the expression levels of CCAAT/enhan-cer-binding protein beta (cebpb) and FOS Like Antigen 1a (fosl1a), previously shown to be specific targets of Tlr2 signaling [45]. In wild-type siblings and tlr2+/ sa19423
heterozygotes (tlr2+/−), the expression levels of cebpb and fosl1a, as well as the inflammatory gene il1b were significantly induced upon Pam3CSK4 injection, whereas tlr2−/−showed no significant response (Fig.1 b-d). tlr2+/− animals showed a lower induction of these marker genes than the wild-types, indicating that there is an effect of thetlr2mutation even in the heterozygote. To confirm that these results are specific to the Tlr2 pathway, we injected flagellin, a Tlr5 agonist, into 27 hpf embryos. Flagellin induced il1b expression, but not cebpband fosl1aexpression in wild-type siblings, tlr2+/− and tlr2−/− larvae (Fig. 1e-g). Overall, these data show that tlr2 mutation specifically blocks the Tlr2 down-stream pathways.
To determine if immune cell development was affected by tlr2 mutation, we used the double-transgenic line
tlr2+/+ Tg (mpeg1:mCherry-F);TgBAC (mpx: EGFP) and
tlr2−/− Tg (mpeg1:mCherry-F);TgBAC (mpx: EGFP) to
count the number of macrophages and neutrophils at 2 dpf. The results show that there is no significant differ-ence in the number of macrophages and neutrophils at 2 dpf between the wild type and mutant (Fig.1j, k).
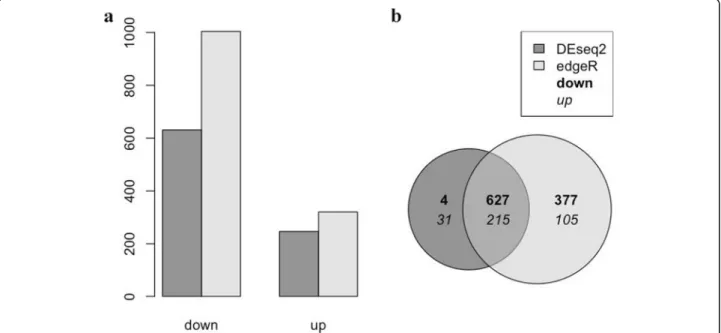
Comparison of gene expression profiles oftlr2
homozygote and heterozygote mutants in the absence of infection
showed such a surprisingly large number of significant differences we also used another statistical method for analyses, called edgeR, that differs in normalization and estimation of the dispersion parameters [49]. EdgeR ana-lyses confirmed the statistical significance of the differ-ences between the homozygote and heterozygote mutants (Fig. 2a and b). While no differences in num-bers of mpeg-positive macrophages were detected (Fig.1j, k), the RNAseq analysis showed that the mpeg1 gene is expressed approximately 2 fold higher in thetlr2+/− con-trol than in thetlr2−/−mutant (Additional file12: Table S1). This was confirmed by pixel count measurements in the transgenic line tlr2+/+ Tg (mpeg1:mCherry-F);TgBAC
(mpx: EGFP) and tlr2−/− Tg (mpeg1:mCherry-F);TgBAC
(mpx: EGFP)(Additional file1: Figure S1 a, b).These re-sults showed lower fluorescence of the mCherry mpeg1 reporter as compared to the wild-type siblings at 2 dpf (Additional file 1: Figure S1 a) whereas no difference
was detected for the eGFP mpxreporter (Additional file
1: Figure S1 b). Therefore these in vivo results confirm the RNAseq data. We also examined the expression levels of thetlr2 gene in the homozygote and heterozy-gote mutants in the RNAseq data (Additional file2: Fig-ure S2). The results show that, although tlr2 is very lowly expressed, there is no difference in expression levels between the homozygote and heterozygote mu-tants, indicating that there is no non-sense mediated mRNA decay (NMD).
To investigate whether the basal expression level dif-ferences of genes might be relevant to the Tlr2 pathway, we performed GO analysis of a set of genes that were expressed differently with the very low FDR adjust P value of 10−10(Additional file13: Table S2). Gene ontol-ogy analyses of the gene sets that differ with an FDR of 10−10in both analyses show that there is a large enrich-ment of genes belonging to the GO terms related to
(See figure on previous page.)
Fig. 1Characterization of the Tlr2 mutant.amutant DNA and protein sequence. A point mutation (T to A) in the C-terminal of the second LRR domain of zebrafish Tlr2 introduces a premature stop codon. The predicted truncated protein lacks the whole TIR domain. Nucleotide and amino acid positions are indicated with respect to the translation start codon.tlr2+/+,tlr2+/−andtlr2−/−embryos were injected at 27 hpf with 1 ng Pam3CSK4 (b-d) or 0.1 ng flagellin (e-g) and expression levels ofil1b,fosl1aandcebpbwere determined at 1 h post injection by qPCR. Data (mean ± SEM) are combined from three biological replicates (n= 10 embryos per group) and expressed relative to their corresponding mock injection (water) control (ctrl), which is set at 1. Statistical significance of differences between ctrl and PAMPs injection groups was determined by two-way ANOVA with Tukey’s Multiple Comparison method as a post-hoc test (b-g), ns, non-significant; *,P< 0.05; ***,P< 0.001; ****,P< 0.0001.
h,i. Representative Stereo images of the caudal hematopoietic tissue oftlr2+/+Tg(mpeg1:mCherry-F);TgBAC (mpx: EGFP)(h) andtlr2−/−Tg
(mpeg1:mCherry-F);TgBAC (mpx: EGFP)(i) were taken at 2 dpf for quantification of macrophages and neutrophils numbers. At 2 dpf, numbers of mCherry-labeled macrophages (j) and GFP-labeled neutrophils (k) were counted using Leica TCS SP8 confocal laser scanning microscopy (CLSM) of transgenic lines. Data (mean ± SEM) were combined from two independent experiments. No significant differences (ns) in the number of macrophages (j) and neutrophils (k) was detected with a t-test
neural development (Additional file 13: Table S2). In addition, we have also analyzed differences with a fold change criterion of two and FDR of 0.05. These analyses indicated that under the GO category “Transcription factor genes” only two categories of genes including the c-Maf transcription factor were present (Add-itional file 14: Table S3). Pathway analysis shows that genes that function in glucose metabolism are differen-tially expressed in thetlr2homozygote versus heterozy-gote mutant (Additional file3: Figure S3).
Tlr2-specific gene expression profiles after Mm infection To study the role of Tlr2 in Mm infection we tested the tlr2 mutant line in comparison with the heterozygote and wild-type sibling controls (Fig. 3). No differences in bacterial burden were observed at 3 dpi (Fig. 3d).
However, we found that bacterial burden was signifi-cantly higher in tlr2−/−than intlr2+/−and wild-type lar-vae at 4 dpi (Fig.3e). There was no significant difference in bacterial infection burden between the heterozygote mutant strain (tlr2+/−) and the wild-type siblings (tlr2+/+). At 4 dpi, tlr2−/− larvae showed a significantly decreased percentage of survival compared with tlr2+/− and wild-type larvae (Fig. 3f). There was no significant difference in percentage of survival between tlr2+/−and wild-type larvae at 4 dpi. For further analysis of the in-fection phenotype we performed confocal laser scanning microscopy (CLSM) in the tlr2+/+ Tg (mpeg1:EGFP),
tlr2+/− Tg (mpeg1:EGFP) and tlr2−/− Tg (mpeg1:EGFP)
transgenic lines in which macrophages are fluorescently labelled (Fig.4a, b and Additional file4: Figure S4). The results using fluorescent automated pixel count analyses
Fig. 3Quantification of bacterial burden and survival afterM. marinuminfection.tlr2+/+(a),tlr2+/−(b) andtlr2−/−(c) embryos were infected with
mCherry-labeledM. marinumstrain Mma20 at a dose of ~ 150 CFU by caudal vein infection at 28 hpf. Representative images for bacterial pixel count intlr2+/+(a),tlr2+/−(b) andtlr2−/−(c) were taken at 4 dpi. Bacterial burden oftlr2+/+,tlr2+/−andtlr2−/−were also quantified at 3 dpi (d) and
4 dpi (e). Bacterial burdens were quantified by using bacterial fluorescence pixels. Red stars in (e) indicate the data for the representative images shown in (a-c). In (d,e), data (mean ± SEM) were combined from two independent experiments. Statistical significance of differences was determined by one-way ANOVA with Tukey’s Multiple Comparison method as a post-hoc test for comparison between more than two groups (d,
e). Percent of survival curves fortlr2+/+(n= 47),tlr2+/−(n= 49) andtlr2−/−(n = 49) (f) are based on two independent experiments. Statistical
showed that in the tlr2 mutant the number of bacteria that were not present within macrophages was signifi-cantly higher than in the heterozygote and wild-type sib-ling controls (Fig. 4c). We also observed by manual counting that in the tlr2 mutant a significantly higher number of bacteria in large extracellular clusters (Fig. 4d), indicative for cording structures [50]. Manual counting of infected macrophage clusters showed a sig-nificantly lower number of granulomas in the tlr2 mu-tant (Fig. 4e). However, the percentage of larvae with at least one granuloma was not different from the hetero-zygote and wild-type sibling controls (Fig. 4f). These re-sults show that the tlr2 mutation results in a defect in the defense response against mycobacteria at 4 dpi.
Next, we set out to assess the general inflammation and specific immune responses intlr2mutants. We ana-lyzed these parameters at 4 dpi to correlate transcrip-tional responses with the first microscopically measured effect of the mutation on the progression of infection process as measured by bacterial burden (Fig. 3e). For
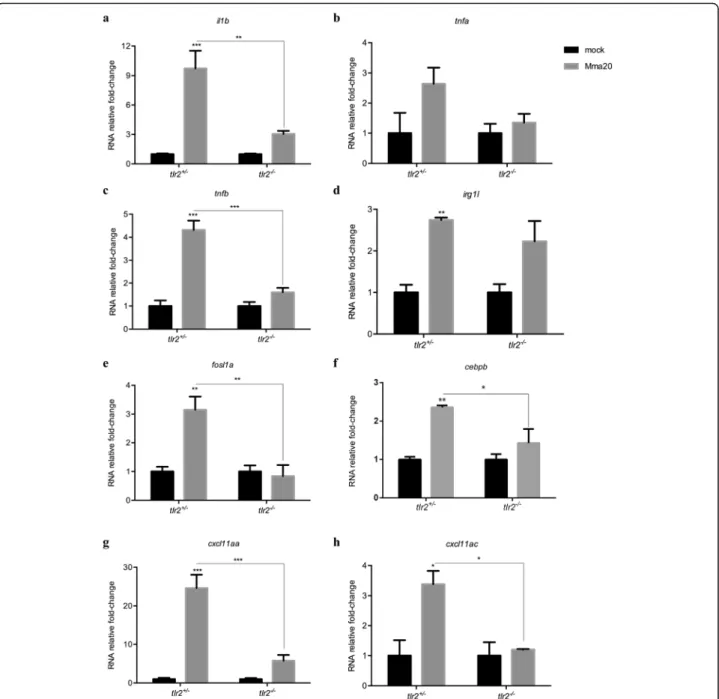
this, genes that were shown previously to be specifically or aspecifically responding to Pam3CSK4 [45] were ana-lyzed by qPCR of tlr2−/− and tlr2+/− larvae upon Mm (strain Mma20) infection at 4 dpi:tlr2-aspecific response genes il1b, tnfa, tnfb, irg1l, and tlr2-specific response genesfosl1aandcebpb. Our results show that the induc-tion levels ofil1b,tnfb, fosl1a andcebpbintlr2−/−larvae were significantly reduced when compared to the het-erozygotes in the infected condition (Fig.5). The induc-tion levels of irg1l and tnfa were less clearly affected. tlr2−/− larvae failed to upregulate fosl1a and cebpb ex-pression in response to Mm administration (Fig. 5e, f). In our previous work, we showed that Cxcl11-like che-mokines expressed in macrophages play a crucial role in granuloma formation upon Mm infection [51, 52]. We therefore conducted qPCR to assess the expression levels
of cxcl11-like genes, previously shown to be induced by
infection [51], including cxcl11aaand cxcl11ac (Fig. 5g, h). The expression levels of cxcl11aa and cxcl11ac was significantly higher in tlr2+/−larvae than intlr2−/−upon Fig. 4Quantification of Mma20 infection phenotype in thetlr2mutant. Embryos were infected at 28 hpf with ~ 150 CFUM. marinumMma20 strain. Confocal images of green fluorescent macrophages and red fluorescent bacteria in a granuloma oftlr2+/+Tg (mpeg1:EGFP)larva (a) and
extracellular bacteria intlr2−/−Tg (mpeg1:EGFP)larva (b) was conducted at 4 dpi with 10 (a,b, bright view images) and 63 (a,b, fluorescent view images) times magnification objectives. White arrowheads indicates a granuloma (a) and extracellular bacteria (b). In the bright view images of (a,
b), the scale bar represents 50μm. In the fluorescent view images of (a,b), the scale bar represents 10μm. For quantification of bacteria outside macrophages by pixel count (c) large extracellular clusters of at least 8μm diameter (d) and average number of granulomas in the CHT region (e) three groups of at least 37 embryos oftlr2+/+Tg (mpeg1:EGFP), tlr2+/−Tg (mpeg1:EGFP)andtlr2−/−Tg (mpeg1:EGFP)embryos were analysed at 4
Mm infection (Fig.5g, h). These results indicate thattlr2 mutation results in a defective immune or inflammatory response to Mm infection.
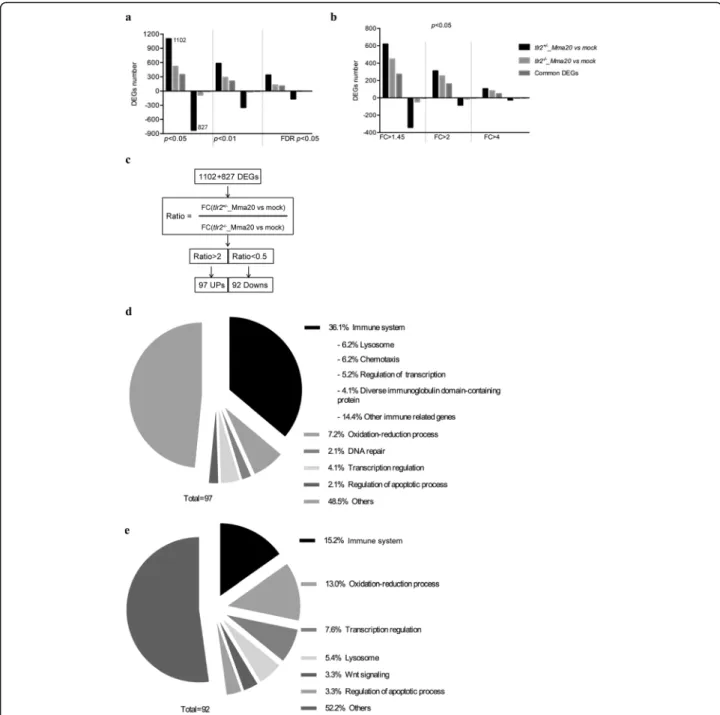
To further study the function oftlr2in defense against mycobacterial infection, we performed RNAseq of tlr2+/− and tlr2−/− larvae at 4 dpi with M. marinum strain (strain Mma20) and PBS as control. We summa-rized the number of differential expressed genes (DEGs) according to P-value (Fig. 6a, b) and in volcano plots
(Additional file 5: Figure S5). The number of DEGs in tlr2+/− infected with Mm was higher than those in tlr2−/− at any given P-value or false discovery rate less than 0.05, or any given fold-change with a P-value less than 0.05. These data also show that most of the genes downregulated by the Mm infection in the control remained unchanged intlr2mutants (Fig.6a, b). To fur-ther analyze these RNAseq data, we chose the genes with a threshold of a P-value less than 0.05 in tlr2+/− Fig. 5Immune genes expression intlr2+/−andtlr2−/−fish lines infected with Mm. The expression levels ofil1b(a),tnfa(b),tnfb(c),irg1l(d),fosl1a
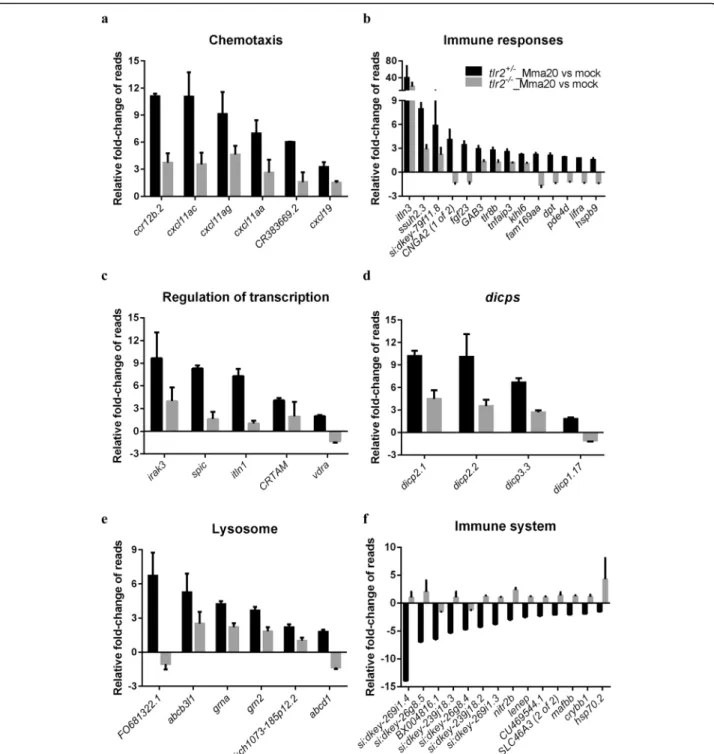
with Mm infection (1102 up- and 827 down-regulated genes, Fig.6a). Then, for these genes, we calculated the fold-change ratio oftlr2+/−versustlr2−/−, and genes with ratios greater than 2 or less than 0.5 were selected for further analysis (Fig. 6c). As a result, 97 and 92 genes were scored as tlr2 specific up- and down-regulated genes, respectively. Next, we conducted GO analysis (Fig.6d, e) showing that genes grouped into the immune system category are the most prominently deregulated (36%) in the whole tlr2 up-regulated 97-gene set
are poorly annotated and include genes encoding cyst-eine proteases, a nitr gene, a mafb transcription factor gene and hsp70. Categories encompassing non-immune related genes are listed in Additional file 7: Figure S7. These results show that, upon infection with Mm, tlr2 mutants show a dampened response of immune genes.
To show the relationship between DEGs, we con-structed networks based on common expression targets
in the 97 up- and 92 down-regulated genes [53]. The in-volved networks with the up-regulated genes contain lipc,nr0b2, hmgcr, itln1,fgf23,vdr,irak3andtlr8 (Add-itional file8: Figure S8). Intlr2+/− controls we observed positively regulatedhmgcr,fgf23, vdrandtlr8, and nega-tively regulatednr0b2, whereastlr2−/−showed an oppos-ite regulation for most of these genes. However,lipcand
irak3, were positively regulated in both tlr2+/− and
tlr2−/−. For the 92 downregulated genes, a network con-tainingnr0b2andmafbwas constructed (Additional file9: Figure S9). nr0b2and mafb were positively regulated in tlr2−/−zebrafish and down regulated intlr2+/−.
Enrichment analysis of Tlr2 specific genes after Mm infection
To link our data to gene sets defined based on prior bio-logical knowledge (including GO), we conducted Gene-Set Enrichment Analysis (GSEA) of the differently expressed genes. This method derives its power by fo-cusing on gene sets, that is, groups of genes that share common biological function, chromosomal location, or regulation [54]. Because the number of predicted gene sets were too large for our analysis method (more than 1000 withP< 0.05), we focused on the gene sets related to metabolic, immunological and inflammation path-ways. GSEA predicted 61 pathways in tlr2+/− and 67 pathways intlr2−/−zebrafish responsive to Mm infection (Additional file 15: Table S4A and 4B). Interestingly, most of these pathways are common in tlr2+/− and tlr2−/−, however some of them are detected as being anti-correlated in regulation, including some pathways underlying natural killer cell functions and omega-6-fatty acid metabolism (Additional file 15: Table S4C). We also performed Sub-Network Enrichment Analysis (SNEA) [55] to identify possible key genes that are responsible for the difference in response of the tlr2+/− andtlr2−/−group to Mm infection (P< 0.05). SNEA pre-dicted 565 and 503 pathways fortlr2+/− and tlr2−/− zeb-rafish that are linked to the response to infection, respectively (Additional file 15: Table S4D and 4E), and 264 and 202 of them are specific for the response in tlr2+/− and tlr2−/− fish, respectively (Additional file 15: Table S4F). Since the RNAseq was conducted with the total RNA from whole body of zebrafish, it is not pos-sible to define which pathways are involved in macro-phage functions related totlr2expression. Therefore, we analyzed previously published DNA microarray data (GDS4781) of human macrophages transfected withMtb from Gene Expression Omnibus [56]. SNEA analysis of human macrophages shows that 659 pathways are linked to Mtb infection (Additional file 15: Table S4G). By comparing the human SNEA result to tlr2+/− specific pathways in zebrafish, 56 pathways were defined as tlr2+/−-specific (Additional file15: Table S4H). Of these, the pathway of TLR8, which has the lowest P-value in both zebrafish and human enrichment (Additional file15: Table S4H), and its network is depicted as example in Additional file 10: Figure S10. Overall, these analyses show that tlr2−/− mutants have a strongly altered immune response of which many pathways that are linked to human tuberculosis are differently responding.
Discussion
TLR2 has been shown to play a role in host defense against Mtb in several rodent studies but its role in host innate immunity during infection is still not clear. More-over, little is known about the systemic regulation of down-stream signaling of TLR receptors in animal models. As part of this study we generated a tlr2 zebra-fish mutant to study Tlr2 function in the innate immune system during mycobacterial infection. Our results show a function of Tlr2 in defense against mycobacterial in-fection. This function is apparent by a larger number of extracellular bacteria and a lower number of granulomas in the tlr2mutant compared to the controls. This result is in agreement with in vivo studies in mice infected with tuberculosis bacteria that show a defect in granu-loma formation in a Tlr2 mutant [19]. To obtain expla-nations and genetic markers for further studies of the effect of the tlr2 mutation on infection we performed deep RNA sequencing to study the whole transcriptome profile in our mycobacterial infection model at the sys-tems level. There are only a few RNA sequencing results of tuberculosis studies in rodents [57,58], human serum [59], human pulmonary epithelial cells [60], and bovine systems.
[66, 67], and in addition, c-Maf is also expressed in T helper cells [67]. c-Maf was also reported to directly regulate IL-10 expression induced by LPS in macro-phages [68]. Double deficiency of Mafb/c-Maf promotes self-renewal of differentiated macrophages [69]. We did not detect differences in macrophage numbers between tlr2 mutants and controls, but it remains to be further investigated if macrophage differentiation is altered as a result of Tlr2 deficiency.
Recently, we have shown that Tlr2 and its adaptor MyD88 are important for the response of the zebrafish host to the microbiome [48]. Therefore, it is very well pos-sible that the transcriptional differences we find in thetlr2 mutant versus the controls are due to an aberrant re-sponse to the microbiome. Similarly, we have found that mutation inmyd88leads to a large difference in the zebra-fish gene expression profile, even in the absence of patho-genic infection [48]. This difference appeared to be dependent on the presence of a microbiome. In future work we therefore aim to study the transcriptome re-sponse of thetlr2mutant under germfree conditions and in the presence of a microbiome under gnotobiotic condi-tions and investigate whether the dysregulation of neural development pathways intlr2mutants might be linked to control of the gut-brain axis [70–74]. Such studies could also show whether the composition of the microbiome af-fects the progression of mycobacterial infection. This could be clinically relevant, considering that recent studies show a correlation of the occurrence of tuberculosis with aberrations of the microbiome in human patients [75].
The analysis of differential gene expression during infec-tion showed that there is a very pronounced effect of muta-tion of the tlr2 gene. However, the expression of many genes is independent of tlr2 as expected, since also other TLR receptors play a role in recognition of mycobacterial in-fections [76–79]. With respect to the number of genes af-fected, the strongest effect was observed in genes that are down regulated during infection, since this category was strongly diminished in thetlr2 mutant (Fig.6a, b and Add-itional file5: Figure S5). This observation suggests that Tlr2 has an important function in anti-inflammatory responses, in line with previous reports of studies in mice that showed a strongly decreased anti-inflammatory response in Tlr2 knockouts [77,78]. In a further analysis of the quantitative effects on the differences in expression levels of genes in both the up regulated and down regulated groups, we se-lected a number of genes that were most significantly af-fected in GO analysis (Fig.6d, e). This GO analysis showed many groups to be affected with the immune response as the biggest group. We also performed GSEA and SNEA analyses (Additional file8: Figure S8, Additional file9: Fig-ure S9, Additional file10: Figure S10 and Additional file15: Table S4) showing that thetlr2mutant has a very different immune response than heterozygote controls. Furthermore,
we show that many signaling pathways that have been re-ported to be linked to tuberculosis infection in humans are differentially regulated in our data set. Most significantly, ac-tivation of the Tlr8 pathway was strongly affected (Add-itional file 10: Figure S10). This evidence suggests that the Tlr2 signaling is strongly connected with Tlr8 function. TLR8 mutations (polymorphisms) increase susceptibility to mycobacteria in the human population [79,80]. Recently it was shown that TLR8 is a sensor of various bacteria in hu-man primary monocytes [81]. This indication that TLR8 is a more important sensor in the antibacterial defense system than previously known might explain our SNEA results. In addition, our analysis revealed differential expression of three other interesting categories of immune genes, dis-cussed below.
The vitamin D receptor pathway genes that are nor-mally up-regulated during infection in zebrafish larvae were down regulated in the tlr2 mutant. Furthermore, pathway analysis (Additional file 8: Figure S8 and Add-itional file10: Figure S10) also implicated the expression of the Tlr8 pathway connected to vitamin D signaling as being strongly affected in the tlr2 mutant. Vitamin D has been shown to be an important regulatory factor during tuberculosis [82] and has been linked previously to TLR2 function in studies in cell cultures [83]. There-fore, aberrant vitamin D signaling could be a major con-tributing factor to the hyper-susceptibility phenotype of tlr2mutants in Mm infection.
Tlr2 has been shown to be essential for the up-regulation of a group of genes that encode the Diverse Immunoglobulin Domain-Containing Proteins (DICPS) (Fig.6d). This group is as novel multigene family encod-ing diversified immune receptors. Haire et al. [84] re-ported that recombinant DICP Ig domains bind lipids and lipid extracts of different bacteria, including Mtb and Mm, a property shared by mammalian CD300 and TREM family members. In the down-regulated set also several DICP members appear to be dependent on Tlr2, such asdicp1.17,dicp3.3, that are linked to the GO term insulin-like growth factor binding. These correlations might relate to functions of Tlr2 in other processes such as the control of diabetes type II by gut microbiota. However, the DICP gene family lacks easily recognizable genetic homologs in mammals, making a translation to a function in mammalian tuberculosis and other diseases currently not yet possible [85].
(FACS) of Mm-infected cells, we recently showed that cxcl11a is a robust marker of infected macrophages [52]. The infection induced expression of this chemokine is dependent on Myd88, the common adaptor of the majority of Tlrs, includingtlr2 [52]. In agreement, thetlr2 mutant shows a significant lower expression ofcxcl11aaand also of an related chemokine, cxcl11ac, during Mm infection (Fig.5). Considering the large number of other chemokines that are controlled by Tlr2 during infection, it is clear that the integrative network of connections cannot yet be understood from these expression studies and need more detailed functional analyses, e.g. by combinations of differ-ent mutations or directed studies on responses to chemo-kines as shown by Torraca et al [51]. However, we can state that the phenotype of thetlr2mutant, at the infection level, and the level of transcriptional control such as the men-tioned effects on regulation of MafB/c-Maf and chemokines shows a clear connection with macrophage chemotaxis. These evidences do not exclude that Tlr2 has many other functions during infection such as phagocytosis. For in-stance, Blander et al. [86] and Rahman et al. [87] showed that phagocytosis of bacteria and phagosome maturation are impaired in the absence of TLR signaling. Therefore, the large number of unannotated genes of which the ex-pression during infection is dependent on Tlr2 is also worth studying in more detail in future studies.
Conclusion
Our study shows that Tlr2, as a part of innate immunity, plays an important role in controlling mycobacterial infection as observed on the transcriptome and infection level. This function may be mediated by several mecha-nisms, including a general attenuation of the inflamma-tory response, reduced mycobacterial dissemination by dampening of CXCR3-CXCL11 signaling, and anti-mycobacterial effects like vitamin D signaling. Our results show that Tlr2 is a major Tlr family member up-stream of Myd88 that activates the CXCR3-CXCL11 sig-naling axis. The tlr2 mutant is therefore a valuable model for further studies using published infection models for other pathogens and the study of the interac-tions with gut microbiota in zebrafish larvae.
Methods
Zebrafish husbandry
All zebrafish were handled in compliance with the local animal welfare regulations and maintained according to standard protocols (zfin.org). Larvae were raised in egg water (60 g/ml Instant Ocean sea salts) at 28.5 °C. For the duration of bacterial injections, larvae were kept under anesthesia in egg water containing 0.02% buffered 3-aminobenzoic acid ethyl ester (Tricaine, Sigma-Aldrich, the Netherlands). The culture of zebrafish with mutations in immune genes was approved by the local
animal welfare committee (DEC) of the University of Leiden (protocol 14,198). All protocols adhered to the international guidelines specified by the EU Animal Pro-tection Directive 2010/63/EU.
The tlr2sa19423 mutant line (ENU-mutagenized) was ob-tained from the Sanger Institute Zebrafish Mutation Re-source (Hinxton, Cambridge, UK) and shipped by the Zebrafish Resource Center of the Karlsruhe Institute of Technology. The mutant allele was identified by sequencing. Heterozygous carriers of the mutation were outcrossed three times against wild type (ABstrain), and were subsequently incrossed three times. Heterozygous fish of the resulting family were used to produce embryos. Homozygous mu-tants were outcrossed to theTg(mpeg1:mCherry-F);TgBAC (mpx: EGFP) double transgenic line [88, 89], and the off-spring with GFP and mCherry fluorescence were subse-quently incrossed to produce the Tg (mpeg1:mCherry-F); TgBAC (mpx: EGFP)line.
Bacterial strain preparation
The bacterial strain, Mycobacterium marinum m20 (Mma20) expressing mCherry fluorescent protein [90], was used in this study. For the infection to zebrafish lar-vae, the bacteria were prepared as previously described [91]. The infection inoculum was prepared in 2% poly-vinylpyrrolidone40 solution (Calbiochem, the Netherlands), and 150 colony-forming units (CFU) of bacteria were injected into the blood stream at 28 h post fertilization (hpf) as previously described [92].
Ligands injection
Purified Pam3CSK4 (InvivoGen, France) and flagellin from S. typhimurium (Flagellin FliC VacciGrade™, Invi-trogen, France) were diluted in 1 mg/ml and 100μg/ml in sterile water, respectively. For injection, 1 nl of the lig-and solutions were injected into the blood stream at 28hpf. Sterile water was injected as a control experiment. Injections were performed using a FemtoJet microinjec-tor (Eppendorf, the Netherlands) equipped with a capil-lary glass needle.
Bacterial burden imaging and quantification
Pools of 20 larvae were collected at 3- and 4-day post in-fection (dpi) and imaged by using the Leica MZ16FA Fluorescence Stereo Microscope (Leica Microsystems, Wetzlar Germany) equipped with the DFC420C color camera (Leica Microsystems). Bacterial loads were ana-lyzed using dedicated pixel counting software as previ-ously described [93].
Confocal laser scanning microscopy imaging and image quantification
performed by using a Leica TCS SP8 confocal micro-scope (Leica Microsystems) with a 10 times magnifica-tion objective (N.A. 0.40). Acquisimagnifica-tion settings and area of imaging (in the caudal vein region) were kept the same across the groups for macrophages and neutrophils number counting (Fig. 1 j, k) and pixel counting (Add-itional file1: Figure S1). Experiments were performed in two independent series. Double fluorescent lines tlr2+/+
Tg (mpeg1:mCherry-F);TgBAC (mpx: EGFP) and tlr2−/−
Tg (mpeg1:mCherry-F);TgBAC (mpx: EGFP) were used
for macrophages and neutrophils number counting. Macrophage and neutrophil cell counting was either per-formed manually or by using the plugin Find Maxima in Fiji (http://imagej.nih.gov/ij/docs/menus/ process.html#-find-maxima) (Fig. 1 j, k) using projections of the z-series. 25 individual larvae for each group were used for counting and representative images are given in Fig.1h, i. With manual counting the z-series data was examined in cases when it was unclear whether the fluorescent pixels presented one or multiple cells. The result of manual cell counting (Additional file 11: Figure S11) is comparable with the result of automated cell counting using Fiji. Pixel counting of the double transgenic lines (Additional file 1: Figure S1 a, b) was performed using dedicated pixel counting software as well as previously described [93]. For CLSM analysis of progression of in-fection of Fig. 4 we used Fiji software. To quantify the number of bacteria outside macrophages, total bacteria pixel count was quantified by Fiji software and followed by subtracting this number with the number of co-localised pixels. Co-localisation of macrophage and bac-terial pixels was performed using a custom made script written in Java. For this experiment we used three objec-tives: 10x (N.A. 0.40), 20x (N.A. 0.75), 63x (oil immersion, N.A. 1.40) magnification.
RNA isolation, cDNA synthesis and qPCR
Total RNAs were extracted using TRIzol Reagent (Life Technologies) and purified using RNeasy MinElute Cleanup Kit (Qiagen, the Netherlands). The concentra-tion and quality of RNAs were evaluated by NanoDrop 2000 (Thermo Scientific, the Netherlands). cDNAs were synthesized from 1μg total RNAs and qPCR were per-formed by using the iScript™ cDNA Synthesis Kit (BioRad, the Netherlands) and iQ™ SYBR Green Super-mix (BioRad) and normalized against the expression of ppialas a housekeeping gene [94]. Results were analyzed using the ΔΔCt method [95]. Primer sequences are de-scribed in Additional file16: Table S5.
Deep sequencing and data analysis
Triplicates of 10 larvae oftlr2+/−andtlr2−/−with PBS (as control) or Mma20 injection, were homogenized in 300ul of TRIzol reagent, and total RNAs were purified as
described above. RNAseq was performed using Illumina Hi-Seq 2500 as previously described [96]. The raw data is available in the NCBI GEO database under accession number GSE102766. The RNAseq data were mapped on the zebrafish genome (version GRCz10) and tag counts were performed by Bowtie 2 using GeneTiles software (http://www.genetiles.com) [97]. Then, we performed normalization and gene expression analysis using the R package and DESeq2 [98]. After statistical tests, we per-formed further bioinformatics analyses Gene-Set Enrich-ment Analysis [54], Sub-Network Enrichment Analysis [55] and Pathway Enrichment Analysis [99]. For creating gene networks based on common regulatory targets, we used Pathway Studio 9.0 (Elsevier, Amsterdam, the Netherlands) as previously described [53].
Comparison of edgeR and DEseq2: EdgeR and DEseq2 differ mainly in the aspects of normalization and estimation of the dispersion parameters. Normalization in edgeR is done via the trimmed mean of M values, while in DEseq2 this is done by comparing each library with a virtual library based on the relative log expressions. The dispersion param-eters in edgeR are estimated by empirical Bayes and are therefore shrunken towards the overall mean of the esti-mates. Dispersion in DEseq2 is estimated by taking the max-imum of the individual dispersions and the mean trend of the dispersions. As a consequence, edgeR tends to be more sensitive to outliers, while DEseq2 is less powerful [49].
Statistical analyses
Graphpad Prism software (Version 8.1.1; GraphPad Soft-ware, San Diego, CA, USA) was used for statistical ana-lysis. All experiment data are shown as mean ± SEM. In the gene expression profiles of zebrafish treated with the TLR2 agonist (Fig. 1 b-g) and in immune gene expres-sion in tlr2+/− and tlr2−/− fish lines infected with Mm (Fig. 5), statistical significance of differences was deter-mined by two-way ANOVA with Tukey’s Multiple Com-parison test as a post-hoc test. The other experiments were analyzed by using unpaired, two-tailed t-tests for comparisons between two groups and one-way ANOVA with Tukey’s multiple comparison methods as a post-hoc test for comparisons between more than two groups. For percent survival analysis (Fig. 3f), statistical significance of difference was determined by a log-rank (Mantel-Cox) test. (ns, no significant difference; *p< 0.05; **p< 0.01; ***p< 0.001; ****p< 0.0001).
Supplementary information
Supplementary informationaccompanies this paper athttps://doi.org/10. 1186/s12864-019-6265-1.
Additional file 1: Figure S1.Pixel count analysis for double transgenic linesTg(mpeg1:mCherry-F);TgBAC (mpx: EGFP)of 2 dpftlr2+/+andtlr2−/−
Additional file 2: Figure S2.RNAseq read counts oftlr2transcripts in heterozygotes (tlr2+/−) control versustlr2mutant (tlr2−/−) larvae. RNAseq data comparing reads mapped totlr2transcript (ENSDART0000012256). Heterozygotes and mutant reads are mapped to the entire length of the mutant transcript indicating that the mutant transcript is not subjected to nonsense mediated decay. Mutant data (MEAS) and heterozygotes (CTRL) data have been submitted to the NCBI gene expression Omnibus database, accession number is GSE102766.
Additional file 3: Figure S3.Analysis of differential expression of genes functioning in glycolysis and gluconeogenesis between uninfected
tlr2+/−andtlr2−/−. The red boxes represent up regulated genes (FC > 2); blue boxes represent down regulated genes (FC < -2); yellow boxes represent the genes that are differentially expressed with aPvalue lower than 0.05; green represent not-significantly differentially expressed genes.
Additional file 4: Figure S4.Representative images of the quantification of Mma20 infection phenotype in thetlr2mutant, heterozygote and wild type siblings. One representative picture is shown for the entire sets of 38, 47 and 37 larvae were analysed for thetlr2
mutant, the heterozygote and the wild-type, respectively. Macrophages are in green and bacteria are in red. The scale bar represents 50μm.
Additional file 5: Figure S5.Volcano plots showing the significance cutoff applied totlr2+/−infected with strain Mma20 versus control with
PBS (a) andtlr2−/−infected with strain Mma20 versus control with PBS
(b). In these volcano plots, the transcripts were considered significant (red) or non-significant (blue) by the conditions of |fold change|≥1,45 and adjustedPvalue threshold≤0,05. Fold changes for each transcript was plotted on the X-axis against -log10 transformedp-values on the Y-axis.
Additional file 6: Figure S6.tlr2-dependent up regulation of genes with various GO terms.
Additional file 7: Figure S7.tlr2-dependent down regulation of genes with various GO terms.
Additional file 8: Figure S8.Sub-network enrichment analysis. Net-works of common targets of the 97 up regulated genes (Fig.6d) in
tlr2+/−(a) andtlr2−/−(b) with Mma20 infection. Red represents up
regula-tion, blue represents down regulation and grey represents genes for which no expression was detected.
Additional file 9: Figure S9.Sub-network enrichment analysis. The net-works of common targets of the 92 down regulated genes (Fig.6e) in
tlr2+/−(a) andtlr2−/−(b) with Mma20 infection. Red represents
up-regulation, blue represents down-regulation and grey represents genes for which no expression was detected.
Additional file 10: Figure S10.Sub-network enrichment analysis be-tween zebrafish and human. The Tlr8 pathway in zebrafish (a) with Mm infection and human macrophages (b) with Mtb infection. Red represents up-regulation, blue represents down-regulation.
Additional file 11: Figure S11.Manual counting analysis forTg
(mpeg1:mCherry-F);TgBAC (mpx: EGFP)of neutrophils (a) and macrophages (b) in 2 dpftlr2+/+andtlr2−/−embryos.
Additional file 12: Table S1.Reads ofmpeg1.1andmpxgenes of the
tlr2+/−control and thetlr2−/−mutant in RNAseq analysis.
Additional file 13: Table S2.GO analysis of genes that have a different basal expression level in the absence of infection in the Tlr2 mutant versus the heterozygote control. Shown is the GO analysis of the group of 878 genes that were different with a FDRPvalue of 10−10indicated in Fig.2.
Additional file 14: Table S3.Two categories of genes including the c-Maf transcription factor were significantly affected in the GO category.
Additional file 15: Table S4.A-H Gene lists of GSEA and SNEA analysis.
Additional file 16: Table S5.List of primers.
Abbreviations
CFU:Colony-forming units; CLSM: Confocal laser scanning microscopy; DEGs: Differential expressed genes; Dpf: Days post fertilization; Dpi: Days post injection; FACS: Fluorescence-activated cell sorting; FDR: False discovery rate;
GSEA: Gene-Set Enrichment Analysis; Hpf: Hours post fertilization; Hpi: Hours post injection; Mm:Mycobacterium marinum; Mtb:Mycobacterium tuberculosis; NMD: Non-sense mediated mRNA decay; qPCR: Quantitative polymerase chain reaction; RNAseq: Deep sequencing of cDNA derived from polyA RNA; SNEA: Sub-Network Enrichment Analysis; TB: Tuberculosis
Acknowledgments
We thank all members of the fish facility team for fish caretaking. We would like to thank our colleagues from Leiden University: Lanpeng Chen and Gerda E.M. Lamers for assistance with confocal laser scanning imaging and Joost J. Willemse for providing microscopic analysis programs. We also thank Vincenzo Torraca (London School of Hygiene & Tropical Medicine) for helpful discussions and the qPCR primers ofcxcl11-like genes. The zebrafishtlr2
mutant was obtained from the Sanger Institute Zebrafish Mutation Resource (ZF-MODELS Integrated Project funded by the European Commission; contract number LSHG-CT-2003-503496), also sponsored by the Welcome Trust [grant number WT 077047/Z/05/Z].
Authors’contributions
SY and WH carried out all the experimental operations. SY, YS, and HPS performed RNAseq data analysis. SY, WH and HPS wrote the first draft of the manuscript. SY, WH and HPS participated in the design of the study and coordination. AHM and RMJ helped to revise the final manuscript. HPS conceived the study. MM assisted in statistical analysis of RNAseq data. All authors read and approved the final manuscript.
Funding
S. Y. and W. H were supported by grants from the China Scholarship Council (CSC). This funding body had no role in the design of the study and collection, analysis, and interpretation of data and in writing the manuscript.
Availability of data and materials
The raw data of the RNAseq experiments is available in the NCBI GEO database under accession number GSE102766.
Ethics approval and consent to participate
No animals were used for experimentation. Larvae for experiments were obtained from zebrafish lines that were handled in compliance with the local animal welfare regulations and maintained according to standard protocols (zfin.org). The breeding of adult fish was approved by the local animal welfare committee (DEC) of the University of Leiden. All protocols adhered to the international guidelines specified by the EU Animal Protection Directive 2010/63/EU for which larvae under the age of 5 days post fertilization are not considered test animals.
Consent for publication
Not applicable.
Competing interests
The authors declare that they have no competing interests.
Author details
1Institute of Biology, Leiden University, P.O. Box 9505, 2300 RA Leiden, the
Netherlands.2Institute of Synthetic Biology, Shenzhen Institutes of Advanced
Technology, Chinese Academy of Sciences, Shenzhen 518055, China.
3Department of Integrative Pharmacology, Mie University Graduate School of
Medicine, Tsu, Japan.4Mathematical Institute, Leiden University, Leiden, the
Netherlands.5Department of Epidemiology & Biostatistics, Amsterdam Public
Health Research Institute, Amsterdam University Medical Center, Amsterdam, the Netherlands.6Department of Developmental Genetics, Max Planck
Institute for Heart and Lung Research, Ludwigstrasse 43, 61231 Bad Nauheim, Germany.
Received: 12 April 2019 Accepted: 5 November 2019
References
1. Ramakrishnan L. The zebrafish guide to tuberculosis immunity and treatment. Cold Spring Harbor Symp Quant Biol. 2013;78:179–92. 2. Co DO, Hogan LH, Kim SI, Sandor M. Mycobacterial granulomas: keys to a
3. Salgame P. Host innate and Th1 responses and the bacterial factors that controlMycobacterium tuberculosisinfection. Curr Opin Immunol. 2005;17(4): 374–80.
4. Ramakrishnan L. Revisiting the role of the granuloma in tuberculosis. Nat Rev Immunol. 2012;12(5):352–66.
5. Jo EK, Yang CS, Choi CH, Harding CV. Intracellular signalling cascades regulating innate immune responses to Mycobacteria: branching out from Toll-like receptors. Cell Microbiol. 2007;9(5):1087–98.
6. Tapping RI, Tobias PS. Mycobacterial lipoarabinomannan mediates physical interactions between TLR1 and TLR2 to induce signaling. J Endotoxin Res. 2003;9(4):264–8.
7. Means TK, Jones BW, Schromm AB, Shurtleff BA, Smith JA, Keane J, Golenbock DT, Vogel SN, Fenton MJ. Differential effects of a Toll-like receptor antagonist onMycobacterium tuberculosis-induced macrophage responses. J Immunol. 2001;166(6):4074–82.
8. Quesniaux VJ, Nicolle DM, Torres D, Kremer L, Guerardel Y, Nigou J, Puzo G, Erard F, Ryffel B. Toll-like receptor 2 (TLR2)-dependent-positive and TLR2-independent-negative regulation of proinflammatory cytokines by mycobacterial lipomannans. J Immunol. 2004;172(7):4425–34. 9. Jung SB, Yang CS, Lee JS, Shin AR, Jung SS, Son JW, Harding CV, Kim HJ,
Park JK, Paik TH, et al. The mycobacterial 38-kilodalton glycolipoprotein antigen activates the mitogen-activated protein kinase pathway and release of proinflammatory cytokines through Toll-like receptors 2 and 4 in human monocytes. Infect Immun. 2006;74(5):2686–96.
10. Brightbill HD, Libraty DH, Krutzik SR, Yang RB, Belisle JT, Bleharski JR, Maitland M, Norgard MV, Plevy SE, Smale ST, et al. Host defense mechanisms triggered by microbial lipoproteins through toll-like receptors. Science. 1999;285(5428):732–6.
11. Noss EH, Pai RK, Sellati TJ, Radolf JD, Belisle J, Golenbock DT, Boom WH, Harding CV. Toll-like receptor 2-dependent inhibition of macrophage class II MHC expression and antigen processing by 19-kDa lipoprotein of
Mycobacterium tuberculosis. J Immunol. 2001;167(2):910–8. 12. Gilleron M, Quesniaux VF, Puzo G. Acylation state of the
phosphatidylinositol hexamannosides from Mycobacterium bovis bacillus Calmette Guerin andMycobacterium tuberculosisH37Rv and its implication in Toll-like receptor response. J Biol Chem. 2003;278(32):29880–9. 13. Gilleron M, Nigou J, Nicolle D, Quesniaux V, Puzo G. The acylation state of
mycobacterial lipomannans modulates innate immunity response through toll-like receptor 2. Chem Biol. 2006;13(1):39–47.
14. Takeuchi O, Sato S, Horiuchi T, Hoshino K, Takeda K, Dong Z, Modlin RL, Akira S. Cutting edge: role of Toll-like receptor 1 in mediating immune response to microbial lipoproteins. J Immunol. 2002;169(1):10–4.
15. Takeuchi O, Kawai T, Mühlradt PF, Morr M, Radolf JD, Zychlinsky A, Takeda K, Akira S. Discrimination of bacterial lipoproteins by Toll-like receptor 6. Int Immunol. 2001;13(7):933–40.
16. Marinho FAV, de Paula RR, Mendes AC, de Almeida LA, Gomes MTR, Carvalho NB, Oliveira FS, Caliari MV, Oliveira SC. Toll-like receptor 6 senses
Mycobacterium aviumand is required for efficient control of mycobacterial infection. Eur J Immunol. 2013;43(9):2373–85.
17. Basu J, Shin DM, Jo EK. Mycobacterial signaling through toll-like receptors. Front Cell Infect Microbiol. 2012;2:145.
18. Underhill DM, Ozinsky A, Smith KD, Aderem A. Toll-like receptor-2 mediates mycobacteria-induced proinflammatory signaling in macrophages. Proc Natl Acad Sci U S A. 1999;96(25):14459–63.
19. Carlos D, Frantz FG, Souza-Junior DA, Jamur MC, Oliver C, Ramos SG, Quesniaux VF, Ryffel B, Silva CL, Bozza MT, et al. TLR2-dependent mast cell activation contributes to the control ofMycobacterium tuberculosisinfection. Microbes Infect. 2009;11(8–9):770–8.
20. Reiling N, Holscher C, Fehrenbach A, Kroger S, Kirschning CJ, Goyert S, Ehlers S. Cutting edge: Toll-like receptor (TLR)2- and TLR4-mediated pathogen recognition in resistance to airborne infection with
Mycobacterium tuberculosis. J Immunol. 2002;169(7):3480–4.
21. Drennan MB, Nicolle D, Quesniaux VJ, Jacobs M, Allie N, Mpagi J, Fremond C, Wagner H, Kirschning C, Ryffel B. Toll-like receptor 2-deficient mice succumb to
Mycobacterium tuberculosisinfection. Am J Pathol. 2004;164(1):49–57. 22. McBride A, Konowich J, Salgame P. Host defense and recruitment of Foxp3(+)
T regulatory cells to the lungs in chronicMycobacterium tuberculosisinfection requires toll-like receptor 2. PLoS Pathog. 2013;9(6):e1003397.
23. Ogus AC, Yoldas B, Ozdemir T, Uguz A, Olcen S, Keser I, Coskun M, Cilli A, Yegin O. The Arg753GLn polymorphism of the human toll-like receptor 2 gene in tuberculosis disease. Eur Respir J. 2004;23(2):219–23.
24. Biswas D, Gupta SK, Sindhwani G, Patras A. TLR2 polymorphisms, Arg753Gln and Arg677Trp, are not associated with increased burden of tuberculosis in Indian patients. BMC Res Notes. 2009;2:162.
25. Gehring AJ, Dobos KM, Belisle JT, Harding CV, Boom WH.Mycobacterium tuberculosisLprG (Rv1411c): a novel TLR-2 ligand that inhibits human macrophage class II MHC antigen processing. J Immunol. 2004;173(4):2660–8. 26. Saraav I, Singh S, Sharma S. Outcome ofMycobacterium tuberculosisand
Toll-like receptor interaction: immune response or immune evasion? Immunol Cell Biol. 2014;92(9):741–6.
27. Netea MG, Van der Meer JW, Kullberg BJ. Toll-like receptors as an escape mechanism from the host defense. Trends Microbiol. 2004;12(11):484–8. 28. Noss EH, Harding CV, Boom WH.Mycobacterium tuberculosisinhibits MHC
class II antigen processing in murine bone marrow macrophages. Cell Immunol. 2000;201(1):63–74.
29. Netea MG, Sutmuller R, Hermann C, Van der Graaf CA, Van der Meer JW, van Krieken JH, Hartung T, Adema G, Kullberg BJ. Toll-like receptor 2 suppresses immunity againstCandida albicansthrough induction of IL-10 and regulatory T cells. J Immunol. 2004;172(6):3712–8.
30. Sing A, Rost D, Tvardovskaia N, Roggenkamp A, Wiedemann A, Kirschning CJ, Aepfelbacher M, Heesemann J. Yersinia V-antigen exploits toll-like receptor 2 and CD14 for interleukin 10-mediated immunosuppression. J Exp Med. 2002;196(8):1017–24.
31. Gehring AJ, Rojas RE, Canaday DH, Lakey DL, Harding CV, Boom WH. The
Mycobacterium tuberculosis19-kilodalton lipoprotein inhibits gamma interferon-regulated HLA-DR and Fc gamma R1 on human macrophages through Toll-like receptor 2. Infect Immun. 2003;71(8):4487–97.
32. Alvarez GR, Zwilling BS, Lafuse WP.Mycobacterium aviuminhibition of IFN-gamma signaling in mouse macrophages: Toll-like receptor 2 stimulation increases expression of dominant-negative STAT1 beta by mRNA stabilization. J Immunol. 2003;171(12):6766–73.
33. Agrawal S, Agrawal A, Doughty B, Gerwitz A, Blenis J, Van Dyke T, Pulendran B. Cutting edge: different Toll-like receptor agonists instruct dendritic cells to induce distinct Th responses via differential modulation of extracellular signal-regulated kinase-mitogen-activated protein kinase and c-Fos. J Immunol. 2003;171(10):4984–9.
34. Lam SH, Chua HL, Gong Z, Lam TJ, Sin YM. Development and maturation of the immune system in zebrafish,Danio rerio: a gene expression profiling, in situ hybridization and immunological study. Dev Comp Immunol. 2004; 28(1):9–28.
35. Willett CE, Cortes A, Zuasti A, Zapata AG. Early hematopoiesis and developing lymphoid organs in the zebrafish. Dev Dyn. 1999;214(4):323–36. 36. Swaim LE, Connolly LE, Volkman HE, Humbert O, Born DE, Ramakrishnan L.
Mycobacterium marinumInfection of Adult Zebrafish Causes Caseating Granulomatous Tuberculosis and Is Moderated by Adaptive Immunity. Infect Immun. 2006;74(11):6108–17.
37. Davis JM, Clay H, Lewis JL, Ghori N, Herbomel P, Ramakrishnan L. Real-time visualization of mycobacterium-macrophage interactions leading to initiation of granuloma formation in zebrafish embryos. Immunity. 2002; 17(6):693–702.
38. Meijer AH. Protection and pathology in TB: learning from the zebrafish model. Semin Immunopathol. 2016;38(2):261–73.
39. Cronan MR, Tobin DM. Fit for consumption: zebrafish as a model for tuberculosis. Dis Models Mech. 2014;7(7):777–84.
40. Lesley R, Ramakrishnan L. Insights into early mycobacterial pathogenesis from the zebrafish. Curr Opin Microbiol. 2008;11(3):277–83.
41. Arora G, Misra R, Sajid A. Model Systems for Pulmonary Infectious Diseases: Paradigms of Anthrax and Tuberculosis. Curr Top Med Chem. 2017;17(18): 2077–99.
42. Kanwal Z, Wiegertjes GF, Veneman WJ, Meijer AH, Spaink HP. Comparative studies of Toll-like receptor signalling using zebrafish. Dev Comp Immunol. 2014;46(1):35–52.
43. van der Vaart M, Korbee CJ, Lamers GE, Tengeler AC, Hosseini R, Haks MC, Ottenhoff TH, Spaink HP, Meijer AH. The DNA damage-regulated autophagy modulator DRAM1 links mycobacterial recognition via TLR-MYD88 to autophagic defense. Cell Host Microbe. 2014;15(6):753–67.
44. van der Vaart M, van Soest JJ, Spaink HP, Meijer AH. Functional analysis of a zebrafish myd88 mutant identifies key transcriptional components of the innate immune system. Dis Models Mech. 2013;6(3):841–54.
46. Medzhitov R, Preston-Hurlburt P, Kopp E, Stadlen A, Chen C, Ghosh S, Janeway CA Jr. MyD88 is an adaptor protein in the hToll/IL-1 receptor family signaling pathways. Mol Cell. 1998;2(2):253–8.
47. Fitzgerald KA, Palsson-McDermott EM, Bowie AG, Jefferies CA, Mansell AS, Brady G, Brint E, Dunne A, Gray P, Harte MT, et al. Mal (MyD88-adapter-like) is required for Toll-like receptor-4 signal transduction. Nature. 2001; 413(6851):78–83.
48. Koch BEV, Yang S, Lamers G, Stougaard J, Spaink HP. Intestinal microbiome adjusts the innate immune setpoint during colonization through negative regulation of MyD88. Nat Commun. 2018;9(1):4099.
49. Anders S, McCarthy DJ, Chen Y, Okoniewski M, Smyth GK, Huber W, Robinson MD. Count-based differential expression analysis of RNA sequencing data using R and Bioconductor. Nat Protocols. 2013;8(9):1765–86.
50. Clay H, Volkman HE, Ramakrishnan L. Tumor necrosis factor signaling mediates resistance to mycobacteria by inhibiting bacterial growth and macrophage death. Immunity. 2008;29(2):283–94.
51. Torraca V, Cui C, Boland R, Bebelman JP, van der Sar AM, Smit MJ, Siderius M, Spaink HP, Meijer AH. The CXCR3-CXCL11 signaling axis mediates macrophage recruitment and dissemination of mycobacterial infection. Dis Models Mech. 2015;8(3):253–69.
52. Rougeot J, Torraca V, Zakrzewska A, Kanwal Z, Jansen HJ, Sommer F, Spaink HP, Meijer AH. RNAseq Profiling of Leukocyte Populations in Zebrafish Larvae Reveals a cxcl11 Chemokine Gene as a Marker of Macrophage Polarization During Mycobacterial Infection. Front Immunol. 2019;10:832. 53. Nikitin A, Egorov S, Daraselia N, Mazo I. Pathway studio--the analysis and
navigation of molecular networks. Bioinformatics. 2003;19(16):2155–7. 54. Subramanian A, Tamayo P, Mootha VK, Mukherjee S, Ebert BL, Gillette MA,
Paulovich A, Pomeroy SL, Golub TR, Lander ES, et al. Gene set enrichment analysis: a knowledge-based approach for interpreting genome-wide expression profiles. Proc Natl Acad Sci U S A. 2005;102(43):15545–50. 55. Kotelnikova E, Yuryev A, Mazo I, Daraselia N. Computational approaches for
drug repositioning and combination therapy design. J Bioinform Comput Biol. 2010;8(3):593–606.
56. Verway M, Bouttier M, Wang TT, Carrier M, Calderon M, An BS, Devemy E, Mcintosh F, Divangahi M, Behr MA, et al. Vitamin D induces interleukin-1beta expression: paracrine macrophage epithelial signaling controls M. tuberculosis infection. PLoS Pathog. 2013;9(6):e1003407.
57. Leisching G, Pietersen RD, Mpongoshe V, van Heerden C, van Helden P, Wiid I, Baker B. The Host Response to a Clinical MDR Mycobacterial Strain Cultured in a Detergent-Free Environment: A Global Transcriptomics Approach. PLoS One. 2016;11(4):e0153079.
58. Kubler A, Larsson C, Luna B, Andrade BB, Amaral EP, Urbanowski M, Orandle M, Bock K, Ammerman NC, Cheung LS, et al. Cathepsin K Contributes to Cavitation and Collagen Turnover in Pulmonary Tuberculosis. J Infect Dis. 2016;213(4):618–27.
59. Zhang H, Sun Z, Wei W, Liu Z, Fleming J, Zhang S, Lin N, Wang M, Chen M, Xu Y, et al. Identification of serum microRNA biomarkers for tuberculosis using RNA-seq. PLoS One. 2014;9(2):e88909.
60. Mvubu NE, Pillay B, Gamieldien J, Bishai W, Pillay M. Canonical pathways, networks and transcriptional factor regulation by clinical strains of
Mycobacterium tuberculosisin pulmonary alveolar epithelial cells. Tuberculosis (Edinb). 2016;97:73–85.
61. Lachmandas E, Beigier-Bompadre M, Cheng SC, Kumar V, van Laarhoven A, Wang X, Ammerdorffer A, Boutens L, de Jong D, Kanneganti TD, et al. Rewiring cellular metabolism via the AKT/mTOR pathway contributes to host defence againstMycobacterium tuberculosisin human and murine cells. Eur J Immunol. 2016;46(11):2574–86.
62. Ziegler G, Freyer D, Harhausen D, Khojasteh U, Nietfeld W, Trendelenburg G. Blocking TLR2 in vivo protects against accumulation of inflammatory cells and neuronal injury in experimental stroke. J Cereb Blood Flow Metab. 2011;31(2):757–66.
63. Hoffmann O, Braun JS, Becker D, Halle A, Freyer D, Dagand E, Lehnardt S, Weber JR. TLR2 mediates neuroinflammation and neuronal damage. J Immunol. 2007;178(10):6476–81.
64. Gu Y, Zhang Y, Bi Y, Liu J, Tan B, Gong M, Li T, Chen J. Mesenchymal stem cells suppress neuronal apoptosis and decrease IL-10 release via the TLR2/ NFkappaB pathway in rats with hypoxic-ischemic brain damage. Mol Brain. 2015;8(1):65.
65. Kim C, Rockenstein E, Spencer B, Kim HK, Adame A, Trejo M, Stafa K, Lee HJ, Lee SJ, Masliah E. Antagonizing Neuronal Toll-like Receptor 2 Prevents Synucleinopathy by Activating Autophagy. Cell Rep. 2015;13(4):771–82.
66. Moriguchi T, Hamada M, Morito N, Terunuma T, Hasegawa K, Zhang C, Yokomizo T, Esaki R, Kuroda E, Yoh K, et al. MafB is essential for renal development and F4/80 expression in macrophages. Mol Cell Biol. 2006; 26(15):5715–27.
67. Bauquet AT, Jin H, Paterson AM, Mitsdoerffer M, Ho IC, Sharpe AH, Kuchroo VK. The costimulatory molecule ICOS regulates the expression of c-Maf and IL-21 in the development of follicular T helper cells and TH-17 cells. Nat Immunol. 2009;10(2):167–75.
68. Cao S, Liu J, Song L, Ma X. The protooncogene c-Maf is an essential transcription factor for IL-10 gene expression in macrophages. J Immunol. 2005;174(6):3484–92.
69. Aziz A, Soucie E, Sarrazin S, Sieweke MH. MafB/c-Maf deficiency enables self-renewal of differentiated functional macrophages. Science. 2009;326(5954):867–71. 70. Smith PA. The tantalizing links between gut microbes and the brain. Nature.
2015;526(7573):312–4.
71. Davis DJ, Bryda EC, Gillespie CH, Ericsson AC. Microbial modulation of behavior and stress responses in zebrafish larvae. Behav Brain Res. 2016;311: 219–27.
72. de Abreu MS, Giacomini A, Zanandrea R, Dos Santos BE, Genario R, de Oliveira GG, Friend AJ, Amstislavskaya TG, Kalueff AV.
Psychoneuroimmunology and immunopsychiatry of zebrafish. Psychoneuroendocrinology. 2018;92:1–12.
73. Phelps D, Brinkman NE, Keely SP, Anneken EM, Catron TR, Betancourt D, Wood CE, Espenschied ST, Rawls JF, Tal T. Microbial colonization is required for normal neurobehavioral development in zebrafish. Sci Rep. 2017;7(1): 11244.
74. Borrelli L, Aceto S, Agnisola C, De Paolo S, Dipineto L, Stilling RM, Dinan TG, Cryan JF, Menna LF, Fioretti A. Probiotic modulation of the microbiota-gut-brain axis and behaviour in zebrafish. Sci Rep. 2016;6:30046.
75. Naidoo CC, Nyawo GR, Wu BG, Walzl G, Warren RM, Segal LN, Theron G. The microbiome and tuberculosis: state of the art, potential applications, and defining the clinical research agenda. Lancet Respir Med. 2019;7(10):892– 906.
76. Abdallah AM, Savage ND, van Zon M, Wilson L, Vandenbroucke-Grauls CM, van der Wel NN, Ottenhoff TH, Bitter W. The ESX-5 secretion system of
Mycobacterium marinummodulates the macrophage response. J Immunol. 2008;181(10):7166–75.
77. Richardson ET, Shukla S, Sweet DR, Wearsch PA, Tsichlis PN, Boom WH, Harding CV. Toll-like receptor 2-dependent extracellular signal-regulated kinase signaling inMycobacterium tuberculosis-infected macrophages drives anti-inflammatory responses and inhibits Th1 polarization of responding T cells. Infect Immun. 2015;83(6):2242–54.
78. Piermattei A, Migliara G, Di Sante G, Foti M, Hayrabedyan SB, Papagna A, Geloso MC, Corbi M, Valentini M, Sgambato A, et al. Toll-Like Receptor 2 Mediates In Vivo Pro- and Anti-inflammatory Effects ofMycobacterium tuberculosisand Modulates Autoimmune Encephalomyelitis. Front Immunol. 2016;7:191.
79. Davila S, Hibberd ML, Hari Dass R, Wong HE, Sahiratmadja E, Bonnard C, Alisjahbana B, Szeszko JS, Balabanova Y, Drobniewski F, et al. Genetic association and expression studies indicate a role of toll-like receptor 8 in pulmonary tuberculosis. PLoS Genet. 2008;4(10):e1000218.
80. Lai YF, Lin TM, Wang CH, Su PY, Wu JT, Lin MC, Eng HL. Functional polymorphisms of the TLR7 and TLR8 genes contribute toMycobacterium tuberculosisinfection. Tuberculosis (Edinb). 2016;98:125–31.
81. Moen SH, Ehrnström B, Kojen JF, Beckwith KS, Afset JE, Damås JK, Hu Z, Yin H, Espevik T, Stenvik J. Human Toll-like receptor 8 (TLR8) is an important sensor of pyogenic bacteria, and is attenuated by cell surface TLR signaling. Front Immunol. 2019;10:1209.
82. Reeme AE, Robinson RT. Dietary Vitamin D3 Suppresses Pulmonary Immunopathology Associated with Late-Stage Tuberculosis in C3HeB/FeJ Mice. J Immunol. 2016;196(3):1293–304.
83. Liu PT, Stenger S, Li H, Wenzel L, Tan BH, Krutzik SR, Ochoa MT, Schauber J, Wu K, Meinken C, et al. Toll-like receptor triggering of a vitamin D-mediated human antimicrobial response. Science. 2006;311(5768):1770–3.
84. Haire RN, Cannon JP, O'Driscoll ML, Ostrov DA, Mueller MG, Turner PM, Litman RT, Litman GW, Yoder JA. Genomic and functional characterization of the diverse immunoglobulin domain-containing protein (DICP) family. Genomics. 2012;99(5):282–91.
86. Blander JM, Medzhitov R. Regulation of Phagosome Maturation by Signals from Toll-Like Receptors. Science. 2004;304(5673):1014–8.
87. Rahman MJ, Chuquimia OD, Petursdottir DH, Periolo N, Singh M, Fernandez C. Impact of toll-like receptor 2 deficiency on immune responses to mycobacterial antigens. Infect Immun. 2011;79(11):4649–56.
88. Bernut A, Herrmann JL, Kissa K, Dubremetz JF, Gaillard JL, Lutfalla G, Kremer L. Mycobacterium abscessus cording prevents phagocytosis and promotes abscess formation. Proc Natl Acad Sci U S A. 2014;111(10):E943–52. 89. Renshaw SA, Loynes CA, Trushell DM, Elworthy S, Ingham PW, Whyte MK. A
transgenic zebrafish model of neutrophilic inflammation. Blood. 2006; 108(13):3976–8.
90. van der Sar AM, Spaink HP, Zakrzewska A, Bitter W, Meijer AH. Specificity of the zebrafish host transcriptome response to acute and chronic mycobacterial infection and the role of innate and adaptive immune components. Mol Immunol. 2009;46(11–12):2317–32.
91. Benard EL, van der Sar AM, Ellett F, Lieschke GJ, Spaink HP, Meijer AH. Infection of zebrafish embryos with intracellular bacterial pathogens. J Vis Exp. 2012;61:2.
92. Stockhammer OW, Zakrzewska A, Hegedus Z, Spaink HP, Meijer AH. Transcriptome profiling and functional analyses of the zebrafish embryonic innate immune response to Salmonella infection. J Immunol. 2009;182(9):5641–53. 93. Stoop EJM, Schipper T, Rosendahl Huber SK, Nezhinsky AE, Verbeek FJ,
Gurcha SS, Besra GS, Vandenbroucke-Grauls CMJE, Bitter W, van der Sar AM. Zebrafish embryo screen for mycobacterial genes involved in the initiation of granuloma formation reveals a newly identified ESX-1 component. Dis Models Mech. 2011;4(4):526–36.
94. van Soest JJ, Stockhammer OW, Ordas A, Bloemberg GV, Spaink HP, Meijer AH. Comparison of static immersion and intravenous injection systems for exposure of zebrafish embryos to the natural pathogen Edwardsiella tarda. BMC Immunol. 2011;12:58.
95. Livak KJ, Schmittgen TD. Analysis of relative gene expression data using real-time quantitative PCR and the 2(−Delta Delta C(T)) Method. Methods. 2001;25(4):402–8.
96. Marin-Juez R, Jong-Raadsen S, Yang S, Spaink HP. Hyperinsulinemia induces insulin resistance and immune suppression via Ptpn6/Shp1 in zebrafish. J Endocrinol. 2014;222:229-41.
97. Veneman W, de Sonneville J, van der Kolk KJ, Ordas A, Al-Ars Z, Meijer A, Spaink H. Analysis of RNAseq datasets from a comparative infectious disease zebrafish model using GeneTiles bioinformatics. Immunogenetics. 2015; 67(3):135–47.
98. Love MI, Huber W, Anders S. Moderated estimation of fold change and dispersion for RNA-seq data with DESeq2. Genome Biol. 2014;15(12):550. 99. Kotelnikova E, Shkrob MA, Pyatnitskiy MA, Ferlini A, Daraselia N. Novel
approach to meta-analysis of microarray datasets reveals muscle remodeling-related drug targets and biomarkers in Duchenne muscular dystrophy. PLoS Comput Biol. 2012;8(2):e1002365.
Publisher’s Note