METHANE PRODUCTION AND CONSUMPTION IN ALASKAN ARCTIC LAKE SEDIMENTS
Kristen Alexandra Bretz
A thesis submitted to the faculty of the University of North Carolina at Chapel Hill in partial fulfillment of the requirements for the degree of Master of Science in the Department of
Environmental Sciences and Engineering.
Chapel Hill 2012
ii ABSTRACT
KRISTEN BRETZ: Methane Production and Consumption in Alaskan Arctic Lake Sediments
(Under the direction of Dr. Stephen Whalen)
Methanogenesis and methane oxidation were studied in the sediments of 6 Alaskan arctic lakes during the 2010 and 2011 thaw seasons. Rates of methane production were significantly higher in shallow than in deep lake types, varying from 848 to 21791 μmol m-2 d-1
and were correlated to sedimentation rate and oxygen penetration depth; the data overall indicate that higher organic supply to sediments leads to greater methanogenic activity. Addition of hydrogen provided a significantly stimulating effect on methanogenesis in sediments from every lake, while other methanogenic substrates and alternate electron acceptors (NO3
-, Fe3+
, SO4
2-) had variable effects. Methane oxidation rates were much more consistent among lakes (246 μmol m-2
d-1
to 536 μmol m-2 d-1
). Increased loading of nutrients and organic matter to lakes from melting permafrost along with warming sediment
temperatures may stimulate methanogenesis, but based on calculated rates of CH4 diffusion to oxic sediments, methane oxidizers have the potential to ameliorate emissions to the atmosphere.
iii
TABLE OF CONTENTS
LIST OF TABLES ... v
LIST OF FIGURES ... vii
Chapter I. INTRODUCTION ... 1
II. LITERATURE REVIEW ... 3
Methane Production and Consumption ... 3
Arctic Lake and Climate Change ... 10
III. OBJECTIVES ... 14
IV. MATERIALS AND METHODS ... 15
Study Site Description ... 15
Field Sampling ... 16
Experimental ... 17
Analytical ... 21
Calculations and Statistics ... 22
V. RESULTS ... 24
Lake Physiochemical Characteristics ... 24
In Vitro Rates of Methanogenesis ... 30
Controls on Rates of Methanogenesis ... 33
In Vitro Rates of CH4 Oxidation ... 38
VI. DISCUSSION ... 39
iv
In Vivo Rates of Methanogenesis ... 43
Controls on Rates of Methanogenesis ... 45
Rates of CH4 Oxidations and Importance of CH4-derived C in Food Webs ... 47
Microbial Methane Cycling and Climate Change ... 51
APPENDIX ... 53
REFERENCES ... 67
v
LIST OF TABLES
Table
1. Morphometric characteristics and depth class for the six
study lakes... 20 2. Mean values (± 1 standard error of the mean; SEM) for
selected physiochemical properties of the study lakes... 29 3. Mean values (± 1 SEM) for basic physiochemical properties
of the sediment in the study lakes. Values of n are 2 to 6,
depending on the variable... 31
4. Average (± 1 SEM; n=6) area-based rates of methane production (0.4 to 9 cm depth increment), potential
(maximum) rates of CH4 oxidation (0 to 0.4 cm depth increment) and percent of oxidized CH4 converted to microbial biomass (growth efficiency) in sediments of the study
lakes... 37
5. Total dissolved concentrations (μmol L-1
) of selected chemical constituents in pore water of surficial sediments
(0 to 0.4 cm depth increment) of study lakes. Values are means
(±1 SEM) of duplicate determinations... 39
6. Comparison of diffusive CH4 fluxes to the zone of oxic surficial sediment with effective potential rates of CH4 oxidation, based on measured O2 penetration depths. Also given is the net production of methanotroph biomass
calculated from growth efficiencies and effective CH4 oxidation
potentials... 54
A1. Oxygen Microprofile data given in picoammeters... 60
A2. Rates of sedimentation... 62
A3. Chlorophyll a fluorometric readings in ng/ml for each
vi
A4. Dissolved organic carbon levels given as micromoles
per liter... 63
A5. Percent water content of sediments (±1 SEM; n=2)... 64
A6. Dry bulk density of sediments in mg cm-3 ... 65
A7. Porosity of sediments... 66
A8. C:N molar ratios of sediments to 10 cm deep... 67
A9. Percent organic matter of sediments... 67
A10. Porewater CH4 concentrations in micromoles per liter... 68
A11. Rates of methane production by depth as micromoles per square centimeter per day, micromoles per cubic centimeter per day, and micromoles per gram of dried sediment per day... 69
A12. Rates of methane production in response to various amendments as micromoles per centimeter cubed per day... 70
A13. Rates of methane production in response to treatment with acetate given as μmol m-3 d-1 ... 72
vii
LIST OF FIGURES
Figure
1. Representative microprofiles of percent surface O2 in the
sediment of shallow (GTH 114) and deep (Toolik) study
lakes... 30
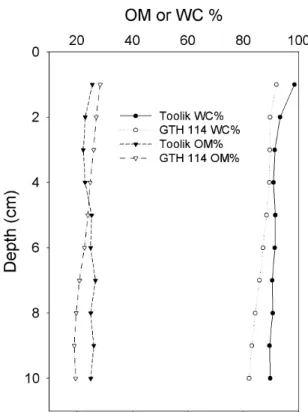
2. Representative profiles for percent water content (WC) and and percent organic matter content (OM) for sediments in deep (Toolik) and shallow (GTH 114) study
lakes... 32
3. Representative profiles of dry bulk density for sediments
in deep (Toolik) and shallow (GTH 114) lakes... 33
4. Representative profiles of methane in the pore waters from
sediments in shallow (GTH 114) and deep (Toolik) lakes... 34
5. Depth distribution of volume-based rates of CH4
production in sediments of the study lakes... 36
6. Multiple comparison (Tukey-Kramer test) of ranked mean (n=4) rates of CH4 production (μmol cm
-3 d-1
) for study lake sediments amended with alternate electron acceptors,
and indirect or direct methanogenic substrates... 36 7. Response in rates of CH4 production in study lake
sediments to serial additions acetate relative to rates in unamended controls. After an incubation period of 4 d, samples were further supplemented with H2 and rates of
CH4 production were again determined... 41 8. Response in rates of CH4 production in study lake
sediments to additions of gaseous N oxides relative to rates in
I. Introduction
Methane is an integral part of the global carbon cycle. In the arctic, methane cycling is of particular interest because carbon stored in the permafrost is released as permafrost melts and can be transformed into methane through microbially mediated pathways in aquatic systems (Walter et al., 2007). Methane is produced during the final stages of
anaerobic decomposition by methanogenic Archaea, and is therefore an important player in organic matter remineralization (Blaut, 1994). These microorganisms are most commonly found in nature in the anoxic sediments of wetlands, lakes and rivers and in the digestive tracts of animals (Blaut, 1994). Methane is most frequently oxidized through aerobic activity by specialized microbes, methanotrophs, which represent the primary sink for mitigating the flow of methane to the atmosphere (Topp and Hanson, 1991).
In the last 200 years, human activities such as rice cultivation and livestock
2
II. Literature Review
Methane Production and Consumption
The methanogens are fermentative Archaea, classified further by their preferred substrates (Whiticar, 1999). The conversion of organic matter to methane relies on a
consortium of bacteria including hydrolytic and fermenting bacteria, hydrogen ion reducing bacteria and homoacetogenic bacteria in addition to the methanogens (Conrad, 1989). Obligate anaerobes, the methanogens cannot tolerate oxygen or redox levels greater than −200 mV (Whiticar, 1999). The methanogens employ the enzyme methyl coenzyme-M reductase in the digestion of substrates; this enzyme is unique to methanogenic microbes and can be used to identify their taxonomy (Ermler et al., 1997). Methane production depends primarily on sediment input of new additions of organic matter, as evidence from 14
CO2 addition experiments suggest that most methanogenesis utilizes freshly deposited organic matter (King and Reeburgh, 2002).
Methane can be produced from a limited number of substrates: H2/CO2, formate, methanol, methylamines, and acetate (Oremland, 1988). In all cases, methyl coenzyme-M is formed and heterodisulfide is reduced using an electron donor supplied by the unique
4
can be characterized by the type of substrate used: competitive or noncompetitive substrates (Whiticar, 1999). Competitive substrates are those that can only be used in environments where concentrations of other thermodynamically favorable oxidants such as dissolved sulfate are low or absent (Whiticar, 1999). The main competitive pathways for CH4
production are the reduction of carbon dioxide by hydrogen (hydrogenotrophic) and acetate fermentation (acetoclastic). Hydrogen and acetate are both products of the degradation of alcohols and fatty acids, and their availability has been shown to limit the rate of methane production in sediments (Garcia, 1990; Conrad, 1999). In freshwaters, the acetoclastic pathway is most common (Whiticar, 1999; Koyama, 1964). Non-competitive substrates for methane production are typically used when other microbial groups such as sulfate reducers outcompete methanogens for common substrates (Whiticar, 1999). These include such substrates as methanol and methylated amines (Whiticar, 1999).
Acetoclastic methanogenesis has been shown to account for two thirds of methane production in anaerobic sediments (Lovley et al., 1982). Acetate is formed in an anaerobic environment via the fermentation of organic matter that has been already degraded from complex compounds (Wetzel, 2001). Acetate can also accumulate as a final product of decomposition in anaerobic environments in addition to serving as an intermediate of methanogenesis (Duddleston et al., 2002). Only a small fraction of the species of methanogens are able to metabolize acetate, and all of them belong to either the genus Methanothrix, which are dominant at low ambient acetate concentrations, or the genus
Methanosarcina (Blaut, 1994). In the conversion of acetate, the methyl group of acetate is
5
2001). Like acetate, the substrate propionate is a degradation product of cellulose and various monomers that can only be degraded by acetoclastic methanogens (Kotsyubenko, 2005).
It is possible for methane to derive solely from H2/CO2 (Lovley et al., 1982). Hydrogen is a byproduct of fermentation, and it is quickly cycled through methanogenesis when present (Wetzel, 2001). In this process, carbon dioxide is reduced to methane through the addition of hydrogen atoms (Wetzel, 2001). Nozhevnikova et al. (1994) demonstrated that lower temperatures in methanogenic environments may lead to H2/CO2 being utilized preferentially over acetate, but Schulz and Conrad (1996) found the opposite to be true. In certain methanogenic habitats, H2 amendments were consumed immediately, stimulating both acetogenesis and methanogenesis (Drake et al., 2009).
Formate is used as an electron donor by methanogens through the actions of formate dehyrdrogenase and hydrogenase, which split the molecule into hydrogen and carbon dioxide (Vogels et al., 1988). Approximately half of all methanogenic Archeabacteria can derive energy from formate (Vogels et al., 1988). Methanol and methylamines can be used as methanogenic substrates only by members of the phylum Methanosarcinacea (Blaut, 1994); most species consume both H2 and methyl compounds, but some are only able to use the latter (Garcia, 1990). In lower temperature habitats, addition of methanol or a methylated amine can induce methanogenesis after a lag period, even if methylotrophic methane production was not a significant methanogenic pathway prior to the addition (Kotsyubenko, 2005). Methylamines also produce ammonia when converted to methane, and can therefore provide a nitrogen source to the methanogens (Patterson and Herspell, 1979).
In sediments, NO3
-, SO4
and Fe3+
6
have higher affinities for hydrogen and acetate (Oremland, 1988; Garcia, 1990). In anaerobic sediments containing both methanogens and sulfate reducers, there is usually a physical separation of these microbial groups into a zone of sulfate depletion, where methanogens reside, and an overlying zone of sulfate reduction where methanogens are absent (Whiticar, 1999). In the latter, sulfate reducers outcompete methanogens for substrates. However
methane may be produced in sediments with high sulfate concentrations by utilizing other the non-competitive substrates for which sulfate reducers will not compete, such as methanol or methyl amines (Oremland and Polcin, 1982). Similarly, there may also be zones of iron and nitrate reduction. In addition, all of these inhibitors can act directly on the metabolism of methanogenic organisms to suppress methanogenesis (Wetzel, 2001).
Besides nitrate, all the other oxides of nitrogen are inhibitory to methanogenesis (Oremland, 1988). Strength of inhibition by nitrogen compounds is determined by
concentration and oxidation state (Bollag and Czlonkowski, 1973). Balderston and Payne (1976) found that nitrite could suppress methane production for a longer period than could nitrate and that nitrous oxide was more inhibitive than nitric oxide in sediments. While oxidation state is influential over the degree of inhibition, neither it nor substrate competition entirely explains this phenomenon (Balderston and Payne, 1976). In addition to the
compounds listed above, other known inhibitors of methanogenesis include analogues of the methanogenic enzymes and methane itself, compounds with unsaturated carbon-carbon bonds (such as acetylene), long-chain fatty acids and oxygen (Balderston and Payne, 1976).
Temperature is an important controlling factor over methanogenesis, and lake
7
temperature for methane production in aquatic sediment has been found to be around 35 to 42° C, but this range is rather higher than typical sediment temperatures (Zeikus and Winfrey, 1976). Wagner and Pfeiffer (1997) suggest a substrate dependence of the
temperature optimum for methanogenesis. In general, hydrogen-utilizing methanogens seem to have greater temperature optima than do acetoclastic methanogens (Wagner and Pfeiffer, 1997). While increasing temperature generally seems to stimulate methanogenesis, it has been suggested that any effects rising temperatures have on the microbes themselves may be offset by simultaneous decreased affinity of methanogenic enzymes for their substrates under warmer conditions (Westermann et al., 1989). Temperature also seems to influence
methanogenic preferences for substrates, with H2/CO2 being responsible for more than the expected one-third of total methane production in environments somewhat colder than the optimum temperature, but barely contributing at very low temperatures due to the reduced availability of H2 (Schulz et al., 1997; Kotsyurbenko, 2005).
Generally, acidic conditions are thought to limit methane production, with
methanogens preferring a pH between 6.7 and 7.4 (Cappenberg, 1974; Wust et al., 2009). Phelps and Zeikus (1984) demonstrated that acidic conditions can result in inhibition of methanogenesis such that at low pH, eutrophic lakes sediments enriched in organic carbon will show rates of methanogenesis comparable to oligotrophic lakes. The authors suggest that at low pH, homoacetogenic bacteria are able to successfully compete with methanogens for hydrogen. In some cases, more acidic environments have been shown to favor
8
the microbial inhabitants of sediments exert an essential controlling influence on methane production in aquatic habitats (Kiene, 1991). Methanogens depend on fermentative and syntrophic bacteria to break down organic matter into usable substrates of lower molecular weight (Garcia, 1990; Kiene, 1991). Methanogenesis is the final transformation in a series of sediment reactions that break down organic matter and are carried out by a diverse
community of microbes. In this way the metabolism of the entire sediment ecosystem
controls the availability of substrates and therefore controls methane production (Drake et al., 2009). The laws of thermodynamics predict the observed succession of aerobic respiration, denitrification, iron and manganese reduction, sulfate reduction, and methanogenesis in sediments (Stumm, 1967). The microbiota that comprise this community are trophically dependent on one another (Kotsyurbenko, 2005). For example, Cappenberg (1974) suggests that in lake sediments where abundant sulfate reduction takes place above methanogenesis in the sediment profile, the resulting hydrogen sulfide forms a barrier to oxygen diffusing down so that redox conditions are favorable for methane production.
9
Methanotrophs are a subset of Eubacteria that are able to exist solely on C1
hydrocarbons (methylotrophs), specifically methane. In most natural environments, methane oxidation is an aerobic process, though in unique meromictic freshwater bodies and some marine sediments it can occur in the absence of oxygen (Eller et al., 2005). The oxidation of methane by living organisms is a significant sink preventing methane from escaping the zone of production to the atmosphere (Carini et al., 2005). By comparing fluxes in Lake
Constance, Frenzel et al. (1990) found that methane oxidizing bacteria can remove over 90% of methane produced in aquatic sediments.
Methanotrophs are divided into two types based on the morphology of the enzyme involved in the initial step (methane monooxygenase) and subsequent assimilative pathway. Type I methanotrophs assimilate carbon by means of the ribulose monophosphate cycle and have membranes in the form of disc-shaped vesicles within the cell (Madigan et al., 2009). Type II methanotrophs utilize carbon via the serine pathway and have paired membrane structures distributed near the margin of the cell (Madigan et al., 2009). Freshwater sediments are inhabited mostly by Type II methanotrophs, members of the genus
Alphaproteobacteria, though recent evidence suggests that zones of peak methane oxidation
may shift along with changing ratios between populations of Type I and Type II methanogens (Costello and Lidstrom, 1999; Carini et al., 2005)
Aerobic methane oxidation is controlled mainly by temperature, oxygen availability and, in some cases, NH4
+
10
anoxic sediments diffuses upward to methane oxidizers in a surficial zone of aerobic sediment and overlying water (Madigan et al., 2009). Thermal mixing facilitates methane oxidation throughout the water column by delivering oxygen to bottom waters where methane can accumulate after diffusing from the sediment (Kankaala et al., 2006).
Arctic Lakes and Climate Change
Methane may be emitted from the lake to the atmosphere in four different ways: ebullition, diffusive flux, storage flux, and plant-mediated flux (Bastviken et al., 2004). Ebullition delivers methane directly from the sediments to the atmosphere with little influence from methane oxidation in oxic sediments or the water column (Bastviken et al., 2004). Emissions from ebullition are thus directly related to the gross rate of methane production in the sediment and the pressure difference that must be overcome for methane bubbles to escape the sediment (Bastviken et al., 2004). Ebullition has been shown to be correlated to changes in air pressure over the lake, with low-pressure weather systems
bringing about increased bubbling events (Mattson and Likens, 1990). This method of release has been difficult to quantify in the past due to its high spatiotemporal variability within lakes (Bastviken et al., 2004; Walter et al., 2007). New methods and discoveries of hot spot bubbling, however, have improved estimates of methane emissions from ebullition (Walter et al., 2007).
Only methane that eludes oxidation by methanotrophs in oxic surficial sediment or overlying water can enter the atmosphere through diffusive flux; the rate of exchange between the surface waters and the atmosphere depends on the difference in methane
11
Storage flux occurs when a large reservoir of dissolved CH4 is suddenly exposed to the atmosphere. In thermally stratified lakes, methane emitted by the sediments and accumulated in the hypolimnion can be released during lake turnover (Michmerhuizen et al., 1996). Similarly, methane stored under ice during the winter can be emitted to the atmosphere when the lake circulates on ice-out. It was estimated that 97% of methane stored under ice was released at break-up in one north-temperate lake, with very little of the stored gas lost to oxidation (Michmerhuizen et al., 1996). In fact, methane oxidation increases in importance in the overall carbon cycling only as the extent of methane storage in a lake decreases
(Michmerhuizen et al., 1996). Emergent macrophytes in the littoral zones of lakes can also provide a route for methane to depart sediments; this vascular transport is an adaptive mechanism of aquatic macrophytes to survive with roots submerged in anoxic sediments (Kaki et al., 2001).
The contribution of northern lakes to the atmospheric budget of methane is critical to our understanding of the importance of methane as a potent greenhouse gas because
atmospheric mixing ratios are highest at 65° to 70° N and are subject to extreme seasonal variation (Fung et al., 1991). The budget of atmospheric methane is subject to a great deal of uncertainty, and the contributions of arctic lakes have been understudied in attempts to more firmly establish source strengths. Natural sources of methane were thought to include only wetlands, oceans and termites, but recent estimates illustrate that on a global basis, lakes add more methane to the atmosphere yearly than do the oceans (Bastviken et al., 2004).
12
regime change within lakes in the arctic (Smol et al., 2005). Freshwaters in this region are particularly sensitive to changes in climate because controlling hydroecologic factors respond to even small changes in climate (Prowse et al., 2006). Earlier ice melt along with changes in precipitation and temperature will cause the active layer to deepen and channels to form in permafrost that will enhance nutrient release from geochemical weathering processes; this will influence lake productivity by altering the chemistry of runoff and increasing suspended sediment and nutrient loading (Prowse et al., 2006). In the Toolik Lake region, climate has already been shown to have a direct effect on aquatic systems (Prowse et al., 2006).
The positive feedback of increased atmospheric methane from arctic lakes can be manifested in several different ways. A longer ice-free season results in more opportunities for methane emissions though ebullition, especially given the newly documented high frequency of these events (Wrona et al., 2006; Walter et al., 2007). The lengthened growing season and northward migration of emergent plants may result in an increase in plant-mediated methane emissions (Wrona et al., 2006). A greater input of nutrients to lakes may stimulate autochthonous production and subsequent decomposition may enhance
methanogenesis, while increased oxygen demand may discourage a compensatory increase in rates of CH4 oxidation (Kiene, 1991). Methane emissions from lakes have been shown to respond to increases in autochthonous photosynthetic organic matter production, indicated by elevated levels of chlorophyll a (Bastviken et al., 2004).
13
at the lake bottom (Huttunen et al., 2003). Thus increasing temperatures in the arctic may eventually change the entire landscape into one even more conducive to methane production. Additionally, with increasing air temperatures, lake temperatures are expected to rise
accordingly, and Hobbie et al. (1999) have predicted increased heat storage in sediments. Given the temperature sensitivity of methanogens, such heat storage could enhance CH4 production and accelerate CH4 emission to the atmosphere, increasing the positive feedback already seen in arctic regions as a response to climate warming.
The foothills region of arctic Alaska area holds numerous lakes, and most of them are relatively small, with Toolik Lake being one of the largest (Hobbie et al., 1999). Lake
III. Objectives
As the emissions of methane from small arctic lakes remains uncertain, my objectives in this study were (1) to determine the balance of methane production with methane
IV. Materials and Methods
Study Site Description:
This study was conducted on six lakes located approximately 20 km north of the Phillip Smith Mountains (68°N, 148°W) in the Arctic Foothills regions of Alaska. The landscape is completely underlain by permafrost and the vegetation is mostly tussock tundra, wet sedge tundra and dwarf shrub communities. The average air temperature is -8.4° C and lakes of this region are covered by ice for all but 3 months of the year, with snow cover present for 6 to 8 months (Hobbie et al., 1999).
I classified the six study lakes as either shallow or deep, based on mean depth (Table 1). Mean and maximum depths varied from 2.1 m and 4.1 m (GTH 99) to 7 m and 26 m (Toolik Lake). The three shallow lakes had lower volumes by at least an order of magnitude and lower surface areas than the deeper lakes. GTH 99 showed the smallest volume and surface area at 14 x 103
m3
and 0.7 ha, while Toolik Lake had the largest volume and surface area at 10950 x 103
m3
16
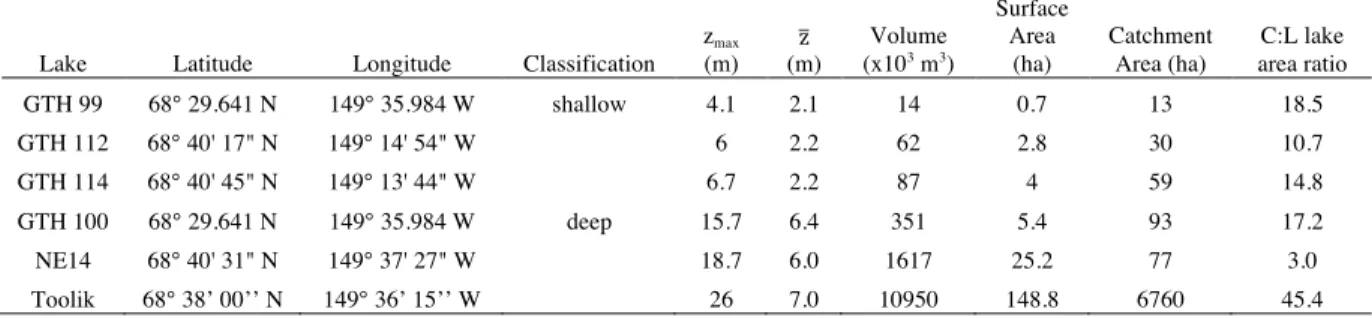
Table 1. Morphometric characteristics and depth class for the six study lakes. Zmax is the
maximum lake depth while z is the mean lake depth.
Lake Latitude Longitude Classification
zmax
(m)
z
(m)
Volume
(x103 m3)
Surface Area
(ha)
Catchment Area (ha)
C:L lake area ratio
GTH 99 68° 29.641 N 149° 35.984 W shallow 4.1 2.1 14 0.7 13 18.5
GTH 112 68° 40' 17" N 149° 14' 54" W 6 2.2 62 2.8 30 10.7
GTH 114 68° 40' 45" N 149° 13' 44" W 6.7 2.2 87 4 59 14.8
GTH 100 68° 29.641 N 149° 35.984 W deep 15.7 6.4 351 5.4 93 17.2
NE14 68° 40' 31" N 149° 37' 27" W 18.7 6.0 1617 25.2 77 3.0
Toolik 68° 38’ 00’’ N 149° 36’ 15’’ W 26 7.0 10950 148.8 6760 45.4
Deep lakes are thermally stratified from the end of June through mid-September and shallow lakes circulate intermittently throughout the thaw season. Lakebeds are mostly comprised of soft substrate, although deep lakes sometimes have more extensive areas of rocky bottom; macrophytes are largely absent from study lakes, occurring sparsely around the perimeter if at all. Study lakes are representative of the greater region in terms of mixing regime, physiochemical and biological characteristics, and size.
Field Sampling
17
sampler. Duplicate clusters of 3 or 4 identical sediment traps were deployed at or near the deepest point of each lake at the date of first sampling and left in place for the duration of the summer. Each trap within the cluster was a 9 cm diameter x 91 cm length clear tubes fitted into an opaque casing following Fortino et al. (2009).
Experimental
Physicochemical measurements
Duplicate cores from each lake were sectioned vertically in 1 cm increments to a sediment depth of 10 cm, and each section was analyzed for basic physicochemical properties such as porosity, water and organic content, and C:N ratio.
Depending on the intended chemical determination, multiple cores from each lake were sectioned into 0 to 0.4, 0.4 to 1.0, 0 to 3 and 3 to 6 cm increments. Sections from similar depth increments were combined during processing, centrifuged and filtered through a 0.2 μ nylon membrane (Millipore). Aliquots from each depth interval were either left unacidified or preserved with 0.2 ml concentrated HNO3 or with 0.3 ml 6 N HCl. All samples were stored at 4°C until analyzed for acetate, S, Fe, Mn and dissolved organic-C (DOC).
Two cores from each lake were extruded into a specialized sleeve with sampling ports spaced at 1 or 2 cm increments down the length of the sleeve. Before extruding, all ports of the specialized sleeve were sealed with electrical tape. The sediment-water interface was aligned to be just above the uppermost hole of the column and approximately 10 ml of
sample were extracted from depths 0 to 10 cm (at 1 cm increments), 12 cm and 14 cm using a large bore needle inserted horizontally through the taped sampling port. Samples were
18
with 0.5 ml 2 N HCl to arrest microbial activity. Vials were placed on a rotary shaker for 1 h and then vigorously shaken by hand immediately before they were analyzed for methane and reweighed to determine the mass of pore water.
Duplicate sediment dissolved O2 profiles were measured for two cores per lake. A Unisense microprofiling system was employed using a Clark type electrode with internal reference and guard cathode. The electrode had a 50 μ sensing tip, a stirring sensitivity of <2%, and a 90% response time of <5 s. Electrodes were calibrated with air-saturated and anoxic deionized water prior to profiling. Sensor current was recorded at 10 μ intervals with a picoammeter as the electrode tip was advanced vertically downward with a
micromanipulator. The location of the sediment-water interface was identified with a magnifying lamp. Overlying water was stirred with a mechanical stirrer (2 rpm) while profiling to mimic the benthic boundary layer (Sanford, 1997).
Biological
The 0.4 cm surface layers of 6 cores were rinsed into polybottles and diluted to 100 ml total volume. After vigorous shaking, a 10 ml subsample of suspended material was withdrawn and filtered through Gelman AE glass fiber filters. Filter-trapped chlorophyll a (chl a) was extracted in 50 ml 90% buffered acetone solution for 24 h at -10° C (Likens and Wetzel 2000).
Potential rates of CH4 oxidation was assessed in 6 cores from each lake using biogenically produced (Daniels and Ziekus 1983) 14
CH4 stock (specific activity 517 MBq mmol-1
19
water equilibrated with atmospheric gases (~2.2 nM dissolved CH4) and sealed with a teflon-lined cap plastic without a headspace. Samples were amended with 0.5 ml N2-diluted
12 CH4 to give a target concentration of 17 µM 12
CH4 in the aqueous phase. This dissolved
concentration of CH4 gives a substrate-saturated rate of CH4 oxidation. A 100 μl aliquot of stock 14
CH4 (9.83 MBq) was diluted with ultrahigh purity N2 in a calibrated 24.3 ml vial to yield a working standard; 0.5 ml of that working standard was added to each experimental vessel. A control was also prepared where the sample was killed using 0.5 mL NaOH immediately after the addition of 14
CH4. During all gas additions a 22 ga needle was inserted into the sealing septum to allow expulsion of water in order maintain 1 atm pressure in each vial. Samples were shaken vigorously by hand to equilibrate CH4 between the gas and aqueous phases, and samples were incubated in the dark at 20° C for 12 h on a rotary shaker (100 rpm) to avoid mass transfer limitation (King, 1990). Experiments were terminated by adding 0.5 ml of 6 N NaOH. Vials were opened and placed on a rotary shaker for 24 h to remove unreacted 14
CH4. Samples were allowed to settle and 0.5 ml of the liquid phase plus 7 ml of water were combined with 10 ml scintillation cocktail (Aquasol 2) to analyze for radiolabeled CH4 that had been respired to
14
CO2 and released as DO 14
C (hereafter
collectively referred to as respired CH4). A solid phase dried (60° C) sample was weighed and subjected to high temperature (900° C) combustion in O2 atmosphere (Harvey OX 600 Biological Material Oxidizer) to oxidize to 14
CO2 the 14
CH4 that had been incorporated into microbial biomass. Exhaust gases were passed through a phenethylamine-based fluor (Harvey OX-161) to capture 14
CO2.
20
to experimental vessels in all experiments to determine rates of methanogenesis was conducted under a steady stream of high purity N2 or in an N2-filled glove box. Sediments used to assess rates of methanogenesis were slurried with 5 ml deoxygenated, filtered (0.2 μ nylon membrane; Millipore) bottom water amended with L-cysteine (0.03 w/v).
Experiments were conducted in 160 ml serum vials which were repeatedly evacuated and filled with high purity N2 and shaken at 100 rpm on a rotary shaker prior to zero time sampling to allow the degassing of pore water CH4 prior to experimentation (Kiene and Capone, 1985). All vials were weighed before and after addition of sediment to determine the exact mass of material (water plus sediment) added. As necessary, samples were dried at 60o
C and reweighed to normalize rates to dry mass.
Depth profiles of CH4 production were determined on the same cores used for CH4 oxidation experiments. Triplicate sediment plugs were taken by subsampling cores at 0.4 to 3, 3 to 6 and 6 to 9 cm depth intervals with a 10 ml syringe modified by removing the tapered tip. Samples were incubated statically at 10° C and headspaces were sampled for CH4 at roughly 24 h intervals for 3 to 5 d. Incubations showed a time-linear rate of headspace CH4 accumulation without an initial lag, indicating no induction of activity or depletion of substrate during the observational period.
The influence of chemical factors on methanogenesis was assessed in homogenized sediments from the 0.5 to 9 cm depth interval of all lakes. Multiple 10 ml plugs of
homogenized sediments from 4 cores from each lake were injected into serum vials. One plug from each core was amended with the following treatments: Na2SO4 (10 mM), KNO3 (10 mM), sodium acetate (10 mM), trimethylamine (5 mM), maltose (10 mM), H2 gas (10 mL injected into headspace), and Fe3O2 (2 mM Fe3
21
included for each lake. Samples were incubated at 10° C on a rotary shaker (100 rpm) and sampled repeatedly for CH4 at roughly 24 h intervals for 4 d.
Additional experiments were conducted on selected lakes to assess the influence of various acetate concentrations and oxides of nitrogen on rates of methanogenesis in
homogenized samples from the 0.5 to 9 cm depth interval. In one experiment, duplicate samples of sediments from Toolik Lake and NE14 were adjusted to 1, 4, 7, 10 or 15 mM acetate and, along with unamended controls, were incubated as described above for 4 d. Thereafter, 10 ml H2 was added to the headspace and the incubation was continued for two more days. Headspace CH4 was assessed daily for the duration of the experiment. Duplicate aliquots of the homogenized sediments were filtered (0.2 μ nylon membrane; Millipore) prior to experimentation to analyze for acetate. In an additional experiment, triplicate samples from Toolik and GTH 99 were amended with 1.5 ml N2O or NO, and headspace samples were collected daily to 4 d from these and unamended controls for CH4 analysis.
Analytical
Chl a was determined fluorometrically (Turner Designs TD70 Fluorometer) following Welschmeyer (1994); this method does not involve acidification but has a desensitized response to phaeopigments and chlorophyll b. Sediment water content was calculated as the mass of pore water as a percent of total water-saturated sediment, dry bulk
density was determined as the mass of dry matter (105oC for 24 h) per volume of total
water-saturated sediment, and percent organic content was computed from the mass loss on ignition
22
(Perkin Elmer 2400 CHN Elemental Analyzer). Beta activity in radiocarbon-labeling experiments was determined with Packard TriCarb Liquid Scintillation Counter. Dissolved organic carbon was measured by high temperature catalytic combustion (Shimadzu TOC-VCPH analyzer). Pore water concentrations of total dissolved Fe, Mn and S were determined by inductively coupled plasma- mass spectrometry (Agilent 7500cx) while acetate
concentrations were measured or by mass spectrometry coupled to liquid chromatography (Agilent 6520, Agilent 1200 instruments, respectively). Methane concentrations were
determined by flame ionization detection (FID) gas chromatography (Shimadzu GC8A). The operating conditions for the FID included a 1/8” diameter by 1-m length mol sieve 5a (60/80) column at a temperature of 90° C, injector/detector temperatures of 140° C, with ultrahigh purity N2 flowing at 33 ml min
-1 as the carrier gas. The precision of analysis at 10 ppm CH 4 was 0.9% and the instrument was calibrated daily with NIST-relatable standards.
Calculations and Statistics
Measures of headspace CH4 in serum vials as mixing ratios were converted to a moles L-1 basis. Concentrations in the aqueous phase were calculated from temperature corrected solubility coefficients (Yamamoto et al., 1976) and Henry’s Law (Stumm and Morgan, 1996). The total mass of CH4 in each bottle was computed as the sum of aqueous and headspace masses. Rates of methanogenesis were calculated through time as the linear rate of accumulation CH4 in serum vial headspaces. Rates of CH4 oxidation were calculated from fractional utilization of 14
CH4 (respiration and incorporation into biomass) and the aqueous phase 12
23
Sedimentation rates were calculated as the mass of dried (60o
C) material collected in sediment traps normalized to time and lake surface area.
Pore water CH4 profiles were used to calculate the diffusive flux, Js, (μmol CH4 m -2
s -1
) from the anoxic sediment pore water (2 to 6 cm depth increment) to the surficial zone of CH4 oxidation using the equation JS= -ΦDS
dc
/dz, where Φ= porosity (unitless) and dc/dz is the slope of concentrations profiles (µmol CH4 m-2 s-1) and D
s is the effective diffusivity (cm
-2 s-1
). In the above equation, DS= DO/Θ 2
where DO is the diffusivity of CH4 at 10 o
C (1.25 x 10⁻⁵ cm-2
s-1
), Θ is the tortuosity (unitless) and Θ2
= -0.73Φ +2.17 (Jahnke et al., 1987; Sweerts et al., 1991).
V. Results
Lake Physiochemical Characteristics
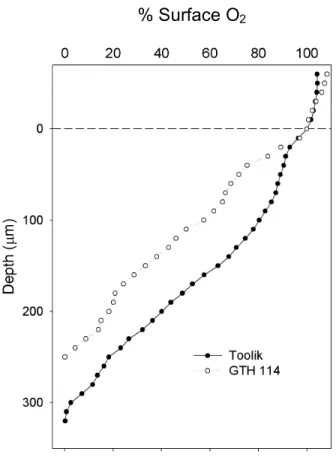
The only significant differences between shallow and deep lakes with respect to basic physicochemical properties were in the average rate of sedimentation (Table 2) and in the average depth of oxygen penetration into the sediment (Figure 1). Sedimentation rates averaged 94.6 and 691.7 mg m-2
d-1
in deep and shallow lakes, respectively. Rates varied from 0.08 g m-2
d-1
in Toolik Lake to 0.96 g m-2 d-1
in GTH 112. When the entire data were considered, sedimentation rates were inversely correlated with zmax and z.
25
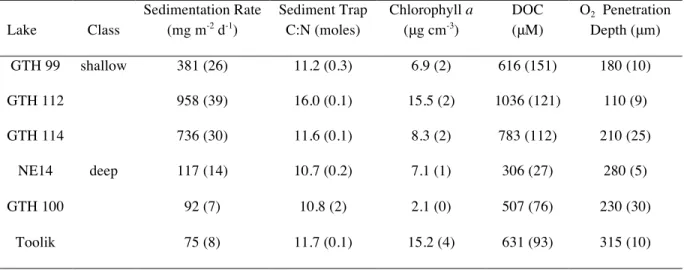
Table 2. Mean values (± 1 standard error of the mean; SEM) for selected physiochemical
properties of the study lakes. Values of n are 2 to 6, depending on the variable. DOC = dissolved organic carbon.
Lake Class
Sedimentation Rate
(mg m-2 d-1)
Sediment Trap C:N (moles)
Chlorophyll a
(μg cm-3)
DOC
(μM)
O2 Penetration
Depth (μm)
GTH 99 shallow 381 (26) 11.2 (0.3) 6.9 (2) 616 (151) 180 (10)
GTH 112 958 (39) 16.0 (0.1) 15.5 (2) 1036 (121) 110 (9)
GTH 114 736 (30) 11.6 (0.1) 8.3 (2) 783 (112) 210 (25)
NE14 deep 117 (14) 10.7 (0.2) 7.1 (1) 306 (27) 280 (5)
GTH 100 92 (7) 10.8 (2) 2.1 (0) 507 (76) 230 (30)
Toolik 75 (8) 11.7 (0.1) 15.2 (4) 631 (93) 315 (10)
26
Figure 1. Representative microprofiles of percent surface O2 in the sediment of shallow
(GTH 114) and deep (Toolik) study lakes. Each datum point is the mean from duplicate cores. Error bars are removed for clarity and a dashed line indicates the sediment-water boundary.
Several qualitative, but statistically nonsignificant trends were observed in comparing other physicochemical and biological lake properties as a function of depth class.
Sedimentation rates (Table 2) were not related to catchment size or the ratio between catchment: surface area. Ratios of C:N in sedimenting material were similar across lakes, showing values of 10.7 to 16.0 and there was no difference between mean ratios of C:N in the sedimenting material on the basis of lake depth class. Similarly, mean C:N ratios of lake sediments (Table 3) did not differ by lake type, though ratios for sediment were generally greater than for material caught in sediment traps, showing values of 9.9 to 22.8. Levels of chl a in the top 0.4 cm of sediment in the six study lakes varied from 2.1 to 15.5 μg cm-3
27
(Table 2), and were generally higher in shallow lakes. Levels of DOC in the pore waters were almost always higher in the three shallow lakes, with the overall data varying from 306 to 1036 μM (Table 3).
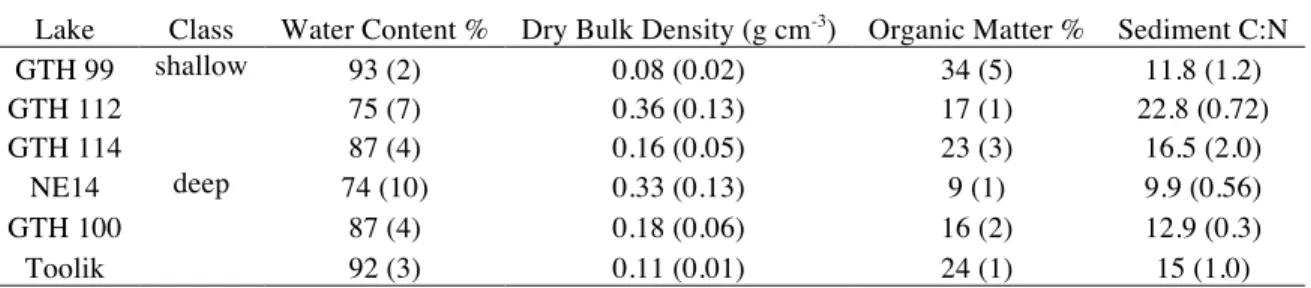
Table 3. Mean values (± 1 SEM) for basic physiochemical properties of the sediment in the
study lakes. Values of n are 2 to 6, depending on the variable.
Lake Class Water Content % Dry Bulk Density (g cm-3) Organic Matter % Sediment C:N
GTH 99 shallow 93 (2) 0.08 (0.02) 34 (5) 11.8 (1.2)
GTH 112 75 (7) 0.36 (0.13) 17 (1) 22.8 (0.72)
GTH 114 87 (4) 0.16 (0.05) 23 (3) 16.5 (2.0)
NE14 deep 74 (10) 0.33 (0.13) 9 (1) 9.9 (0.56)
GTH 100 87 (4) 0.18 (0.06) 16 (2) 12.9 (0.3)
Toolik 92 (3) 0.11 (0.01) 24 (1) 15 (1.0)
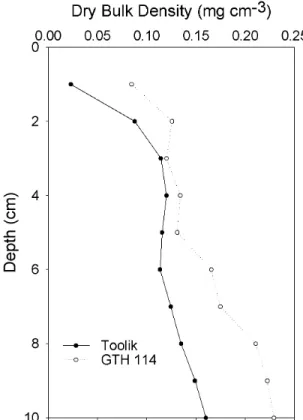
Sediments to a depth of 10 cm were very flocculent in all lakes and exhibited high water content (74 to 93%) and low dry bulk density (0.08 to 0.36 g cm-3
) (Table 3). Organic content varied from 9% to 34%, and were generally higher in shallow lakes. Depth
28
Figure 2. Representative profiles for percent water content (WC) and and percent organic
29
Figure 3. Representative profiles of dry bulk density for sediments in deep (Toolik) and
shallow (GTH 114) lakes. Each datum point is the mean for duplicate cores. Error bars are removed for clarity.
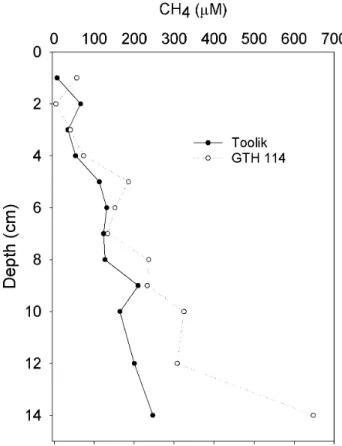
Profiles of pore water methane most frequently showed increasing concentrations with increasing depth below the sediment surface to 14 cm (Figure 4) Lake GTH 112 was an exception as both cores showed a peak of CH4 concentration at 8 cm below the sediment surface while GTH 114 showed CH4 concentrations higher just below the sediment surface at 1 cm than it was at 2 cm. Overall, pore water CH4 was higher in shallow lakes than in deep lakes at comparable depth intervals. Methane concentrations at 1 cm below the sediment surface varied from 3.71 to 56.3 μM in shallow lakes and from 3.39 to 16.2 μM in deep lakes. Methane concentrations at 14 cm below the sediment surface were around 600 to 800 μM for shallow lakes compared to 200 to 250 μM for deep lakes.
30
Figure 4. Representative profiles of methane in the pore waters from sediments in shallow
(GTH 114) and deep (Toolik) lakes. Each datum point is the mean of duplicate cores. Error bars are removed for clarity.
In Vitro Rates of Methanogenesis
On an areal basis, rates of methane production were significantly greater in shallow lakes than in deep lakes. Average rates of methane production varied from 848 to 21791 μmol m-2
d-1
in GTH 100 and GTH 112, respectively (Table 4). The average rate of CH4 production in shallow lakes (13739 μmol m-2
d-1
) was significantly higher than the mean in deep lakes (4014 μmol m-2
d-1
). Shallow lakes also showed significantly greater rates of methane production on a volumetric basis (0.45 μmol cm-3
d-1
31
μmol cm -3
for deep) and on a dry mass basis (5.57 μmol g-1 d-1
in shallow lakes and 1.01 μmol g-1
d-1
in deep lakes). When the entire data were considered, area-based rates of methanogenesis were significantly correlated with rates of sedimentation and area-based concentrations of benthic chl a.
32
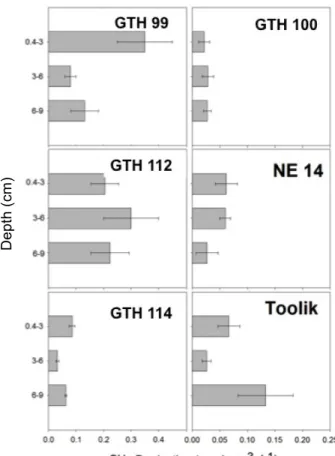
Figure 5. Depth distribution of volume-based rates of CH4 production in sediments of the
study lakes. Error bars represent ± 1 SEM (n=6 in most cases). Note the differences in scale between shallow (left panels) and deep lakes (right panels).
!
D
e
p
th
(
cm
33
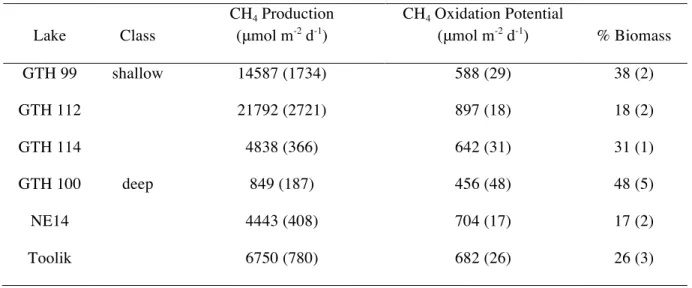
Table 4. Average (± 1 SEM; n=6) area-based rates of methane production (0.4 to 9 cm
depth increment), potential (maximum) rates of CH4 oxidation (0 to 0 0.4 cm depth
increment) and percent of oxidized CH4 converted to microbial biomass (growth efficiency) in sediments of the study lakes.
Lake Class
CH4 Production (μmol m-2 d-1)
CH4 Oxidation Potential
(μmol m-2 d-1) % Biomass
GTH 99 shallow 14587 (1734) 588 (29) 38 (2)
GTH 112 21792 (2721) 897 (18) 18 (2)
GTH 114 4838 (366) 642 (31) 31 (1)
GTH 100 deep 849 (187) 456 (48) 48 (5)
NE14 4443 (408) 704 (17) 17 (2)
Toolik 6750 (780) 682 (26) 26 (3)
Controls on Rates of Methanogenesis
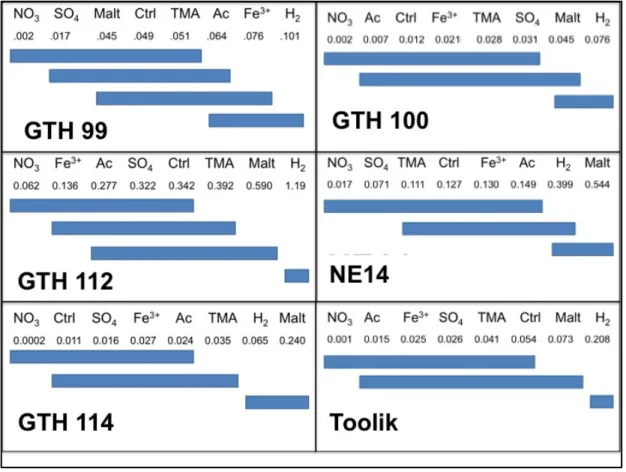
The methanogenic response of sediment samples amended with direct methanogenic substrates, methanogenic precursors and alternate electron acceptors had variable effects across lakes, with a few consistent patterns (Figure 6). In lakes GTH 99, 100, 112, 114, and in Toolik Lake, an amendment of hydrogen stimulated the rate of methanogenesis
34
treated with H2 and, in all lakes except GTH 99, maltose. Mean rates of methanogenesis in NO3 treated sediments varied from <0.001 μmol cm
-3 d-1
in GTH 114 to 0.062 μmol cm-3 d-1
in GTH 112, compared with control rates of 0.011 μmol cm-3
d-1
and 0.032 μmol cm-3 d-1
in GTH 114 and GTH 112. Nitrate addition reduced rates of methanogenesis by roughly 80% in both lakes when compared with controls.
Figure 6. Multiple comparison (Tukey-Kramer test) of ranked mean (n=4) rates of CH4 production (μmol cm-3d-1) for study lake sediments amended with alternate electron acceptors (NO
3-, SO42-, Fe3+), and indirect (maltose: Malt, trimethylamine: TMA) or direct (acetate: Ac, H2) methanogenic
substrates. Controls (Ctrl) received no additional substrates. Mean ranks are arranged in increasing order. Those not underscored by the same line show significantly different rates of CH4 production while those underscored by the same line show rates that are not significantly different.
Qualitatively, mean rates of methanogenesis in samples amended with other alternate electron acceptors (SO4
2-, Fe3+) showed no consistent relationship (i.e. increase or decrease) with respect to mean rates in unamended controls despite the fact that Fe3+
35
increased concentrations of these chemical constituents as much as three and two orders of magnitude relative to concentrations of total dissolved Fe and S in oxic surficial sediments (Table 4). Likewise, rates of methanogenesis following addition of other direct
methanogenic substrates (trimethylamine, acetate) showed no consistent relationship with respect to rates of unamended controls.
Table 5. Total dissolved concentrations (μmol L-1
) of selected chemical constituents in pore water of surficial sediments (0 to 4 cm depth increment) of study lakes. Values are means (±1 SEM) of duplicate determinations.
Lake Class Fe Mn S
GTH 99 shallow 1.6 (0) 40 (1) 366 (3)
GTH 112 7.3 (0) 10 (1) 18 (0)
GTH 114 12 (0) 4 (0) 15 (0)
GTH 100 deep 43 (21) 15 (0) 78 (0)
NE14 0.3 (0) 2 (0) 91 (6)
Toolik 17 (0) 2 (0) 24 (0)
Levels of acetate in the pore waters from NE14 and Toolik Lake were not
36
methane production was seen in the 4 mM acetate treatment with an average rate of 0.016 μmol cm-3
d-1
, and the range among all 5 additions and the control was only 0.008 μmol cm-3 d-1
. Rates of methanogenesis were generally higher in NE14, varying from 0.029 μmol cm-3 d-1
(1 mM amendment) to 0.074 μmol cm-3 d-1
(15 mM amendment). When replicates were further treated with H2 gas, the mean rates of methane production after adding H2 were significantly higher in both lakes than the rates resulting from treatment with acetate alone. Across all concentrations of acetate, the addition of H2 caused the averaged rate of
methanogenesis to increase by a factor of 6 in Toolik Lake, from 0.01 to 0.06 μmol cm-3 d-1
. Similarly, rates of methane production increased 3 fold in NE14, from 0.04 to 0.12 μmol cm-3 d-1
37
Figure 7. Response in rates of CH4 production in study lake sediments to serial additions
acetate relative to rates in unamended controls. Error bars represent ±1 SEM (n=2 for Toolik, n=3 for NE14). After an incubation period of 4 d, samples were further supplemented with H2 and rates of CH4 production were again determined.
Sediments from Toolik Lake and GTH 99 treated with N2O and NO gases showed significant reductions in rates of methanogenesis relative to unamended controls (Figure 8). In Toolik sediments, treatments with NO and N2O resulted in average rates of
methanogenesis of 0.0015 and 0.005 μmol cm-3 d-1
, respectively, while the control samples averaged a rate of 0.019 μmol cm-3
d-1
. Thus, rates of methanogenesis in NO- and N2 O-amended samples were only 8 and 26% of rates in the controls. Amendments of NO and N2O in GTH 99 gave mean rates of 0.014 and 0.083 μmol CH4 cm
-3 d-1
, respectively, compared with 0.26 μmol CH4 cm
-3 d-1
for the control. Relative rate reductions of
38
Figure 8. Response in rates of CH4 production in study lake sediments to additions of
gaseous N oxides relative to rates in unamended controls. Error bars represent ±1 SEM (n=3). Within a lake, rates associated with the same letter do not differ significantly. Note the difference in scale in rates of CH4 production between lakes.
In Vitro Rates of CH4 Oxidation
Area-based potential methane consumption rates ranged over 400 μmol m-2 d-1
, with GTH 100 having the lowest average rate at 456 μmol m-2
d-1
and GTH 112 showing the highest at 897 μmol m-2 d-1(Table 4). The mean area-based potential rate of CH
4 consumption in shallow lakes (709 μmol m-2
d-1
) did not differ significantly from that in deep lakes (614 μmol m-2
d-1
VI. Discussion
Lake Physicochemical Characteristics
A fundamental difference between small and large lakes in the Arctic Foothills region appears to be the rate of sedimentation, which averaged 0.69 and 0.09 g m-2
d-1
, respectively. My data are in reasonable qualitative agreement with limited reports for other lakes in the region. The rate of sediment accumulation in Toolik Lake (0.08 g m-2
d-1
) was similar to the long term 210
Pb-derived rate of 0.07 g m-2 d-1
given by Cornwell and Kipphut (1992). Overall, my rates (Table 2) fall toward to low end of the range of 400 to 7800 mg m-2 d-1 reported by Fortino et al. (2009) for six shallow Arctic Foothill lakes, including GTH 112 and 114. On a broader scale, my sedimentation rates are reasonably consistent with values of 0.35 to 0.42 g m-2
d-1
reported for seven meso-oligotrophic temperate lakes (Weyhenmeyer er al., 1997), but considerably higher that the average value of 0.015 x 10⁻⁶
g m-2 d-1
for stations across oligotrophic Lake Baikal (Edgington et al., 1991).
40
productivity (Whalen and Alexander, 1984; Whalen et al., 2008) and water column chl a (McGowan, 2012) are higher in shallow than deep lakes. Second, the average molar C:N of 12 in trapped particulates (Table 2) was closer to the expected ratio of 10 for freshwater phytoplankton than the mean of 36 for terrestrial plants (Geider et al., 2001) . Sedimentation rate measurements and C:N ratios are from the post-melt summer season, but inputs of organic matter in this region are heavily influenced by terrestrial sources during spring runoff (Whalen and Cornwell, 1985) and could also be influenced by Fe-DOM interactions. The spring influx of terrestrial organic matter contributes to water column primary productivity, making autochthonous organic matter available for sedimentation through summer and fall (Crump et al., 2003), when sampling for this study occurred. A strong influence of
autochthonous processes on sedimentation rates has been demonstrated elsewhere. Hurley and Armstrong (1990) found that changes in the concentrations and community composition of phytoplankton were reflected in the amount and types of organic sedimentation in Lake Mendota while C:N values of surface sediment are similar to that of phytoplankton in Lake Baikal in Siberia (Qiu et al., 1993).
The other statistically significant physiochemical difference between shallow and deep lakes was the mean oxygen penetration depth, which averaged 166 μm in shallow and 275 μm in deep lakes. Oxygen penetration to lesser depths in shallow lakes is consistent with higher sedimentation rates as predominantly labile phytoplankton cells provide more material for decomposition, which is tied to oxygen depletion through the metabolism and respiration of microorganisms, especially in the vicinity of the sediment-water interface (Wetzel, 2001). Thus, it has often been observed that the depths of oxygen penetration are deeper in
41
and 300 μm in oligotrophic Lake Constance, Germany (Frenzel et al., 1990) and to under 100 μm in Dutch, meso-eutrophic Lake Vechten (Sweerts and de Beer, 1989)
A small sample size limited statistical power, but there were several qualitative differences in physiochemical properties between lake types, including concentrations of benthic chl a which were higher in shallow lakes. My values of 2.1 to 15.5 μg chl a cm-3
are consistent with other lakes in the region, which averaged 7 to 29 μg cm-3
(Whalen et al., 2006, 2008; Gettel et al., 2007). Measures of benthic chlorophyll are highly variable worldwide, with subarctic and temperate lakes showing epipelic chl a levels ranging nearly 40 μg cm-3
, from 0.6 to 38 μg cm-3
(Bjork-Ramberg and Anell, 1985; Hansson, 1992; Cyr, 1998; Nydick et al., 2004; Vadeboncoeur et al., 2006).
Particulate materials of sediments in both lake types appear to be dominated by biomass of settled phytodetritus and microphytobenthos. This is inferred by the low dry bulk density and high water and organic matter content of sediment to 10 cm and confirmed by the particulate C:N ratios in the same depth interval, which are similar to that for algal biomass (Tables 2 and 3). Molar ratios of C:N in the sediment averaged nearly 15 across lakes, which is somewhat higher than the average ratio for sedimenting material but consistent with
42
Though not statistically significant, DOC concentrations were generally higher in the shallow lakes than in the deep. This is in agreement with higher sedimentation rates and higher biomass of microphytobenthos and phytoplankton, which contribute to DOC through decomposition and exudates from live tissues. Levels of DOC in sediment pore waters of Toolik Lake were around 630 μM, which is close to typical levels of about 575 μM found in the water column (O’Brien et al., 1996). My values ranged 730 μM, with a minimum in NE14 and the highest value in GTH 112, and the value for all lakes averaging 647 μM. Arctic Lake 18 (Canada), temperate Little Rock Lake (Wisconsin) and subtropical Lake Kinneret (Israel) have pore water DOC within the end members of 306 to1036 μM found here, averaging 290, 400 and 500 μM respectively (Ramlal et al., 1994; Sherman et al., 1994; Adler et al., 2011).
Consistent with higher sedimentation rates and DOC concentrations in surficial pore water, CH4 concentrations were generally higher in shallow lakes than deep lakes in pore waters at comparable depths below the sediment surface. Highest pore water CH4
concentrations of about 250 and 800 μM observed here for shallow and deep lakes are similar to the values of 400 μM to 1000 μM reported for eutrophic lakes Muggelsee
(Rolletschek, 1997), Washington (Kuivila et al., 1989) and Michigan (Green Bay) (Buchholz et al., 1995) as well as acidic Grosse Fuchskuhle (Casper et al., 2003a) and oligotrophic Lake Constance (Thebrath et al., 1993) at a depth roughly comparable to my maximum sampling depth of 14 cm. Downprofile CH4 concentration increases followed by a decrease, as seen in GTH 112, generally indicate ebullition (eg. Matthews et al., 2005), although highest
43
similar profiles have been explained by transient events in CH4 production (Thebrath et al., 1993).
In Vivo Rates of Methanogenesis
Area-based rates of methanogenesis were significantly higher in the sediments of the three shallow lakes, an observation in accordance with greater measured supply of organic matter to the sediments of the shallow lakes relative to the deep lakes. Moreover, I found a significant correlation between sedimentation rate and methanogenesis across all lakes when the data were evaluated as a whole. My results are consistent with reports that CH4
production is directly related to the amount of organic matter delivered to the sediment surface (Kelly and Chynoweth, 1981; Boon and Mitchell, 1995) and increases along a trophic gradient (Casper, 1992). In small temperate Michigan lakes, Kelly and Chynoweth (1981) found that organic input was the most important factor determining the extent of methane production and that the rates of organic input and methanogenesis had a strongly linear relationship. It has also been shown that sediments supplemented with plant material have increased rates of methanogenesis, suggesting a direct link between primary production and methane production (Boon and Mitchell, 1995; Shulz and Conrad, 1995). Duc et al. (2010) showed that methane production potentials were higher for lakes with lower sediment C:N ratios, further pointing to a link between autochthonous primary production and
methanogenesis. Finally, 14
44
labile substrates provided by sedimenting phytoplankton and exudates from benthic microalgae fuel methanogenesis in these lakes.
Area-based rates of sediment methanogenesis were considerably higher in all lakes (Table 4) than observed from arctic Lake 18 in the Northwest Territory, which averaged only 770 μmol m-2
d-1
(Ramlal et al., 1994). Moreover, my rates are generally higher than values of 8 to 5166 μmol CH4 m-2
d-1
reported for a survey of 15 oligotrophic boreal and subarctic Swedish lakes (Algesten et al., 2005). My rates of methanogenesis are most similar to reports from temperate regions. Methane production rates from sediment slurries of Lake Constance (Germany) were around 1400 μmol m-2
d-1
(Frenzel et al., 1990) while rates of 1000-10,000 μmol m-2
d-1
were found in Ontario’s Lake 227 (Rudd and Hamilton, 1978). Eutrophic temperate lakes in North America (Third Sister, Frain’s and Mendota) show much higher rates of methanogenesis at 35,800 to 166,000 μmol m-2
d-1
(Fallon et al., 1979; Robertson, 1979).
45
distribution of CH4 production may vary spatially in the horizontal dimension (Thebrath et al., 1993; Liikanen et al., 2002; Gentzel et al., 2012) and temporally (Robertson, 1979; Liikanen et al., 2002). Factors affecting depth profiles of CH4 production below the sediment surface are clearly complex and no generalities can be drawn based on current data.
Controls on Rates of Methanogenesis
Rates of methanogenesis in samples amended with alternate electron acceptors (NO3
-, SO4
2-, Fe3+) did not differ significantly from rates in unamended controls (Figure 6), although NO3
addition consistently gave the lowest methanogenic response of any treatment. Under anaerobic conditions, methanogenesis occurs only when more thermodynamically favorable oxidants such as NO3
-, SO4
2-, Fe3+
are consumed and methanogens can successfully compete with other microbial groups for acetate and H2 (Nusslein et al., 2001). Ferrihydrite and SO4
2-amendments increased total dissolved concentrations of these pore water constituents by two to three orders of magnitude and were at levels that have been previously demonstrated to suppress methanogenesis (Lovley and Klug, 1986; Boon and Mitchell, 1995). Although SO4
reduction (Kuivila et al., 1989) and Fe3+
reduction (Thomsen et al., 2004) can be important pathways of organic matter mineralization in freshwaters, the absence of a methanogenic response to amendments aimed at stimulating Fe- or SO4-reducing activity suggest that these microbial groups are not important in organic matter mineralization in arctic lake sediments. Alternatively, competition with methanogens for common substrates is lacking, or Fe3+
and SO4
may be made unavailable to the microbial community by means of abiotic reactions with DOM and other minerals.
The general but statistically insignificant reduction in rates of CH4 production to NO3
46
1995) could be ascribed to substrate competition with NO3
reducers or the toxic effects of intermediates (NO, N2O) of denitrification (Kluber and Conrad, 1998). Results of my experiments evaluating the methanogenic response to gaseous oxides of N strongly point to the latter (Figure 8).
Acetate and H2/CO2 are the primary substrates for methanogenesis (Conrad 2007) with acetate responsible for up to two thirds of CH4 production (Lovley, 1982). Methylated amines can also serve as a noncompetitive substrate (cf. Winfrey and Ward, 1983). Trimethylamine amendment had no impact on methanogenesis here (Figure 6), indicating that the study lakes lack Methanosarcina, which are the only methanogens able to metabolize methyl amines into methyl-Coenzyme M (Madigan et al., 2009).
Acetate amendment to sediments frequently stimulates methanogenesis (Boon and Mitchell, 1995; Nozhevnikova et al., 1997; Nusslein and Conrad, 2001). It was surprising that acetate additions to my sediments had no noticeable impact on methanogenic activity (Figures 6 and 7) as ambient acetate concentrations of 5 to 6 μM were roughly three orders of magnitude below the half saturation constants (KS) for acetate utilization by cultured
methanotrophs (Smith and Mah, 1978; Westermann et al., 1989; Jetten et al., 1992). Acetoclastic methanogenesis has been reported in sediments with acetate concentrations similar to those found here (Nusslein and Conrad, 2000) and this microbial group is clearly active in my sediments, as addition of CH3F, a specific inhibitor of acetoclasts, slows the rate of CH4 formation (Lofton, 2012). In contrast to previous reports, (Fukuzaki et al., 1990) gives a KS value of about 4 μM for acetoclastic methanogenesis in sludge, while Winfrey and Zeikus (1979) observed that acetate amendment failed to stimulate methanogenesis in
47
a zero-order kinetic model for acetoclastic methanogenesis may apply to my sediments as the metabolic rate is not a function of substrate concentration.
H2 addition consistently stimulated methanogenesis here (Figure 6) and elsewhere (Winfrey and Zeikus, 1979; Boon and Mitchell, 1995; Nozhevnikova et al., 1997; Nusslein and Conrad, 2000). Acetoclastic methanogenesis frequently dominates cold lake sediments (Schulz and Conrad 1996; Glissman et al., 2004), but experimental warming effects a shift toward an increasing contribution of hydrogenotrophic methanogenesis with increasing temperature (Nusslein and Conrad, 2000; Nozhevnikova et al., 2007). Typical H2 concentrations of 10 nM in lake sediments (Lovely and Goodwin 1988) approach the threshold for utilization for hydrogenotrophic methanogens (Borrel et al. 2011). Increased temperature favors a shift to fermentative pathways (H2 plus acetate production) at the expense of homoacetogenesis (acetate production only), effectively increasing H2-dependent methanogenesis (Schulz and Conrad, 1996). Thus, experimental H2 addition mimics the effect of increasing temperature. Increased H2 availability is likely the reason maltose amendment commonly stimulated methanogenesis in my substrate addition experiments since this is one of many sugars that ferment to hydrogen, as in the rumen during digestion (Hungate, 1967). That methanogenesis was significantly enhanced by H2 addition to
samples previously amended with acetate (Figure 7) further points to the availability of H2 as a critical control on rates of methanogenesis in these lakes.
Rates of CH4 Oxidation and Importance of CH4-derived C in Food Webs
Rates of methane oxidation did not differ significantly by lake type, with shallow lakes averaging 709 μmol m-2
d-1
and deep lakes averaging 614 μmol m-2 d-1
48
provided an uptake-saturating concentration of substrate and eliminated mass transfer limitation. As such, these rates provide a relative index of the size of the methane oxidizing bacterial community (Segers, 1998), which seem to be evenly scaled among lakes despite shallow lakes having higher rates of methanogenesis. Maximum methane oxidation rates in this case overestimate potential in situ activity because the 400 μm layers of surficial
sediment that were used for rate determination extend below the measured oxic zone, as determined by oxygen microprofiles (Table 2). Consequently, dormant methanotrophs would have become active (c.f. Roslev and King, 1995) and included in the measurements. Assuming homogenous distribution of CH4 oxidizing bacteria in the 0 to 400 μm sediment depth increment, I calculate, using O2 penetration depths, that effective maximum potential methane oxidation rates averaged 282 μmol m-2d-1 in shallow lakes and 430 μmol m-2d-1 in deep lakes (Table 5). Diffusive fluxes from the anoxic sediment into the zone of methane oxidation averaged 60 μmol m-2
d-1
in shallow lakes and 29 μmol m-2 d-1
in deep lakes. Methane oxidation is therefore potentially able to consume all upwardly diffusing CH4, but actual rates depend on environmental conditions. Studies have shown over 90% of CH4 produced in sediments can be removed in the surficial oxic zone (Reeburgh et al., 1993 Frenzel et al., 1990). A combination of high rates of CH4 supply to the oxic surficial sediment and reduced O2 penetration depth suggest a higher rate of CH4 efflux into bottom waters in shallow lakes relative to deep lakes, and this is corroborated by benthic chamber experiments (McGowan, 2012).
Effective potential CH4 oxidation rates in this study varied from 246-546 μmol m-2
d-1
and are remarkably similar to area-based rates from sediments of Lake Constance, Lake Washington, and Lake Kivu, which extend from 250-480 μmol m-2
d-1
49
Kuivila et al., 1988; Frenzel et al., 1990). Collectively, these rates are lower by an order of magnitude than methane oxidation rates of 7900 to 9400 μmol m-2
d-1
in Lake Vechten (Sweerts et al., 1991).
Measured volume based rates of methane oxidation in sediments of these study lakes are functionally similar and thus directly comparable to values of Vmax (maximum rate of CH4 uptake) in studies evaluating CH4 oxidation kinetics in lake sediments. My values varied from 18-36 nmol cm-3
d-1
, and are similar to the Vmax of 17 nmol cm -3
d-1
found in Lake Superior (Remsen et al., 1989) and within the range of 6.5-108 nmol cm-3
d-1
observed in Lake Washington (Lidstrom and Somers, 1984). However, my volumetric rates are
considerably lower, by an order of magnitude or more, than Vmax for CH4 oxidation in a Lake Michigan bay and a Danish freshwater wetland (King, 1990; Buchholz et al., 1995).
Sediment methanotrophs in these lakes showed a growth efficiency (percent CH4 incorporated into biomass) of about 30% (Table 4). This value falls toward low end of the 30 to 50% range observed in oxygenated water columns of Japanese and Ontario lakes (Rudd and Taylor, 1980; Utsumi et al., 1998) and the 50% net biomass production given for Green Bay sediments (Buchholz et al., 1995). A wider range of growth efficiencies (5 to 80%) was reported is a seasonal study of pelagic CH4 cycling dynamics in three south-central Swedish lakes (Bastviken et al., 2003). Growth efficiencies similar to those found in my study point to a dominance by type II methanotrophs (Auman et al., 2000).
Net production of methanotrophs in the oxygenated surficial sediment was 1.2 to 6.3% of epipelic primary production in GTH 112, GTH 114, GTH 100 and NE14, using my net methanotroph production bomass production rates (Table 6) and epipelic primary