SPECTROSCOPIC INVESTIGATIONS OF ELECTRON TRANSFER PROCESSES AT SEMICONDUCTOR INTERFACES
Robin R. Knauf
A dissertation submitted to the faculty of the University of North Carolina at Chapel Hill in partial fulfillment of the requirements for the degree of Doctor of Philosophy in the
Department of Chemistry.
Chapel Hill 2016
Approved by:
John Papanikolas
Jillian Dempsey
Andrew Moran
Gerald Meyer
ABSTRACT
Robin R. Knauf: Spectroscopic Investigations of Electron Transfer Processes at Semiconductor Interfaces
(Under the direction of Jillian L. Dempsey)
Clean and renewable energy sources are essential to meet the worlds growing energy
demands. Consequently, there has been a large scientific focus on designing inexpensive and
efficient solar energy devices. Dye-sensitized solar cells, which couple light absorbing
molecules to low cost metal oxides, show promise as cost effective alternatives to traditional
silicon solar cells; furthermore, dye-sensitized photoelectrosynthesis cells provide a means
for storing solar energy in the form of chemical bonds. The rates of the electron transfer
process that occur in these devices ultimately dictate their efficiencies. Understanding the
factors that govern these electron transfer processes will guide rational device design. This
dissertation aims to answer the following questions: What are the mechanisms by which
these interfacial electron transfer processes occur, and does the rate or mechanism change
with metal oxide used? Can new emerging materials, specifically semiconductor quantum
dots, be incorporated as efficient chromophores in these devices?
By comparing the electron transfer rates in SnO2-chromophore and TiO2
-chromophore systems, it was determined that the rates of back electron transfer in these
systems are influenced by the identity of localized trap states within the metal oxide, how
these states are populated, and the specific pathways by which back electron transfer can
as these architectures have shown increased performance in solar energy devices. It was
determined that electron recombination in these systems occurs via two mechanisms,
tunneling and direct recombination from localized shell trap states. The contribution from
each mechanism is dependent on the TiO2 shell thickness.
Semiconductor quantum dots were also investigated as possible chromophores for
solar energy devices. Common methods of incorporating quantum dots into device
architectures require exchanging native ligands for functionalized ligands that couple the
quantum dots to the desired substrate. However the mechanisms of these ligand exchange
processes are not well understood. These ligand exchange reactions were studied using
NMR, absorbance, and photoluminescence spectroscopies. Carboxylic acid exchanges were
found to occur in equilibrium, with a Keq=0.83. Phosphonic acid and thiol ligand exchanges
ACKNOWLEDGEMENTS
There have been many people who have helped me and encouraged me throughout
my life, and without them I wouldn’t be where I am today. First I would like to thank my
mom, Marcia Knauf. Thank you for all of your unconditional love and support in all of my
life’s endeavors. You have sacrificed so much so that I could have so many opportunities
while growing up, and I don’t think I could every thank you enough for everything you’ve
done. I would also like to thank my sister, Kersten Simon. We have been through a lot
together, and you have always been an amazing role model and support system for me.
Next I must thank my Advisor, Dr. Jillian Dempsey. She is one of the most
intelligent, dedicated, and compassionate scientists I know. Thank you for all the mentorship
you have provided me, I would not be the scientist I am without your guidance. I have
learned so much from you over the past 5 years, and it has been a true pleasure to be a part of
your lab. I could not have made it throughout my graduate studies without your
encouragement, enthusiasm, and insight.
I owe much gratitude to the other members of the Dempsey group. I had the pleasure
of helping build up the lab with Thomas Eisenhart, Eric Rountree, and Brian McCarthy. You
have all taught me a lot about not only about science, but also sports, politics, and life in
general. Thank you to Dan, Noemie, Chris, and Katherine for being great lab mates to work
with. Also thank you to Kate Pitman and Matt Kita in the Miller lab for your insightful
I must also thank the many scientists who provided mentorship and collaboration
within the Energy Frontier Research Center. Thank you to Dr. Kyle Brennaman who helped
teach me transient absorption spectroscopy, and was always willing to help me with my
research. Thank you to Professors Jerry Meyer, Thomas Meyer, John Papanikolas, and
Andrew Moran for not only serving on serving on my graduate committee, but also for
listening to all my EFRC presentations, and providing insightful feedback on my research.
Your mentorship has been invaluable.
I want to thank all of the amazing friends that I have made during my time at UNC.
To Sarah, Joe, Mark, Jack, Marci, and David, thank you for helping me keep my sanity
during graduate school and for helping me grow as a person,
Finally, I would like to thank my fiancé, Dr. Keegan Kelly. I cannot imagine how I
would have made it through the last 4 years without you. Thank you for reminding me to take
things one step at a time when I am stressed out. Thank you for taking care of BP when I was
working late in lab. Thank you for pushing me to accomplish thing I never thought I could.
Thank you for believing in me when I didn’t believe in myself. Thank you for making me
slow down, and enjoy our years in graduate school. Most of all, thank you for your
TABLE OF CONTENTS
LIST OF TABLES ... xi
LIST OF FIGURES ... xii
LIST OF ABBREVIATIONS AND SYMBOLS ... xx
CHAPTER 1. Introduction ... 1
1.1. Motivation for developing solar energy technologies ... 1
1.2. Dye-Sensitized Solar Cells ... 2
1.3. Dye-Sensitized Photoelectrosynthesis cell ... 7
1.4. Charge Recombination Mechanisms in Semiconductor-Chromophore Systems ... 9
1.5. SnO2 as a Photoanode Alternative to TiO2 ... 13
CHAPTER 2. Quantifying Ligand Exchange Reactions at CdSe Nanocrystal Surfaces ... 15
2.1. Introduction ... 15
2.2. Experimental ... 17
2.2.1. General Considerations. ... 17
2.2.2. Absorbance Measurements ... 18
2.2.3. Steady-State Emission. ... 18
2.2.4. Time Resolved Emission. ... 18
2.2.5. CdSe QD Synthesis. ... 18
2.2.6. Synthesis of undec-10-en-1-ylphosphonic acid. ... 21
2.2.9. Sample Preparation for 1H NMR Titrations. ... 23
2.3. Results and Discussion ... 24
2.3.1. Synthesis and Purification of CdSe QDs ... 24
2.3.2. Quantification of Surface Ligands via 1H NMR ... 27
2.3.3. Ligand Exchange with Carboxylic Acid-terminated Ligands ... 29
2.3.4. Ligand Exchange with Phosphonic Acid-Terminated Ligands ... 38
2.3.5. Ligand Exchange with Thiol-Terminated Ligands ... 44
2.4. Conclusions ... 49
CHAPTER 3. Revealing the Relationship between Semiconductor Electronic Structure and Electron Transfer Dynamics at Metal Oxide-Chromophore Interfaces ... 51
3.1. Introduction ... 51
3.2. Experimental ... 53
3.2.1. Chromophore Synthesis ... 53
3.2.2. Metal Oxide Film Fabrication ... 53
3.2.3. Surface Attachment ... 53
3.2.4. Transient Absorption Spectroscopy ... 54
3.2.5. Steady-State Emission ... 55
3.2.6. Electrochemical Measurements ... 56
3.2.7. Spectroelectrochemical Measurements ... 56
3.3. Results ... 57
3.3.1. RuP–SnO2 Characterization ... 57
3.3.2. Steady-State Photoluminescence ... 59
3.3.3. Interfacial Charge Recombination Dynamics ... 62
3.3.5. Electronic Coupling Studies ... 70
3.3.6. Electrochemical Measurements ... 70
3.4. Discussion ... 72
3.4.1. Correlating Recombination Dynamics with Metal Oxide Trap State Densities .... 72
3.4.2 pH Dependence of Recombination Kinetics ... 78
3.5. Conclusion ... 82
CHAPTER 4. Photophysical Characterization of Porphyrin and Porphyrin-Ru(II) Polypyridal Chromophore-Catalyst Assemblies on Mesoporous Metal Oxides ... 84
4.1. Introduction ... 84
4.2. Experimental ... 85
4.2.1. Materials ... 85
4.2.2. Chromophore and Catalyst Synthesis ... 85
4.2.3. Transient Absorption Spectroscopy ... 85
4.2.4. Steady-State Emission ... 87
4.2.5. Time Resolved Emission ... 87
4.2.6. Spectroelectrochemistry ... 87
4.2.7. Cyclic Voltammetry ... 88
4.2.8. X-ray Photoelectron Spectroscopy (XPS) ... 88
4.3. Results and Discussion ... 88
4.4. Conclusion ... 102
CHAPTER 5. Charge Recombination Dynamics in Sensitized SnO2/TiO2 Core/Shell Photoanodes ... 103
5.1. Introduction ... 103
5.2.1. Nanocrystalline SnO2 and ZrO2 Film Fabrication ... 105
5.2.3. Chromophore Synthesis ... 105
5.2.4. Surface Loading of SnO2/TiO2-RuP Films ... 105
5.2.5. Powder X-ray Diffraction ... 106
5.2.6. Transient Absorption Spectroscopy ... 106
5.3. Results ... 107
5.3.1. Characterization of SnO2/TiO2 Films ... 107
5.3.2. Interfacial Charge Recombination Dynamics in Amorphous Films ... 110
5.3.3. Interfacial Charge Recombination Dynamics in Annealed Films ... 115
5.4. Discussion ... 118
5.4.1. Correlating Recombination Dynamics with Metal Oxide Shell Thicknesses ... 118
5.4.2. Recombination Dynamics in Annealed Core/Shell Systems ... 124
5.5. Conclusions ... 126
LIST OF TABLES
Table 2.1:Keq and ligand exchange ratio obtained for different additions of UDA to a sample
of CdSe QDs. The standard deviation for Keq is 0.05. ... 31
Table 2.2: Ligand exchange ratios obtained for different additions of UDT to a sample of
OA-capped CdSe QDs. ... 47
Table 3.1: Kinetic parameters from fits to transient absorption data in Figure 3 in pH 1
HClO4. λex = 532 nm (4 mJ), λobs = 400 nm. ... 66
Table 3.2: Kinetic parameters from fits to normalized transient absorption data in Figure
3.10A at pH 1, 3, and 5 HClO4. λex = 532 nm, λobs = 400 nm. ... 67
Table 3.3: Kinetic parameters from fits to transient absorption data in Figure 4. λex = 532
nm, λobs = 400 nm. ... 69
Table 4.1: X-ray photoelectron spectroscopy (XPS) of TiO2–1–Zr–2 ... 100
Table 5.1: Bleach Magnitudes and τ1/2 Values for Amorphous SnO2/TiO2 Films ... 111
Table 5.2: Pulse Energies and τ1/2 Values for Amorphous and Annealed ZrO2/TiO2 Films
(Equal Injection) ... 114
Table 5.3: Bleach Magnitudes and τ1/2 Values for Annealed SnO2/TiO2 Films ... 116
LIST OF FIGURES
Figure 1.1 Simplified schematic representation of an n-type DSSC. PS is a generic
photosensitizer. ... 4
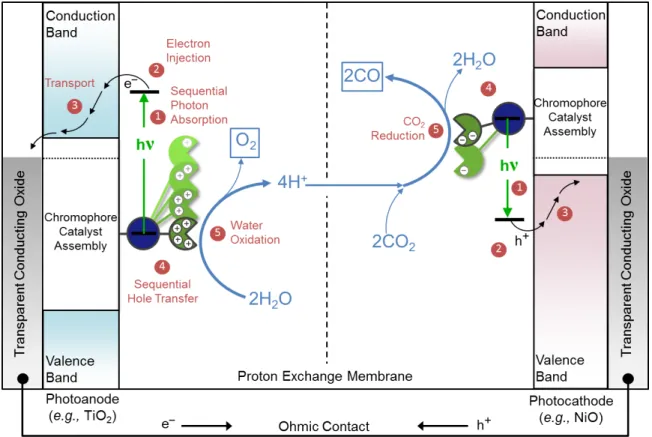
Figure 1.2. Schematic of a DSPEC for water oxidation and CO2 reduction. (Figure credit
John M. Papanikolas and James F. Cahoon) ... 8
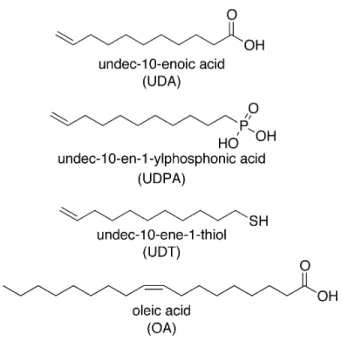
Figure 2.1: Names and structures of the ligands used in this study. ... 17
Figure 2.2: 600 MHz1H NMR spectrum of CdSe QDs in toluene-d
8. Peaks at 7.09, 7.01, 6.97, and 2.08 ppm correspond to residual toluene solvent signals. The singlet peak at 3.98 ppm corresponds to the ferrocene standard. The singlet at 1.56 ppm is due to
residual water in the NMR solvent. ... 20
Figure 2.3: Absorbance and photoluminescence spectra of CdSe QDs in toluene after
purification. Emission spectrum collected at 425 nm excitation. ... 21
Figure 2.4: Absorbance spectrum of 2.1 µM CdSe QDs in toluene after various purification
steps. Inset A: The 1Seß2Sh3/2 transition shows very slight flattening over the course of purification. Inset B: The 1st excitonic peak undergoes a hypsochromic shift with
increased purification steps. ... 25
Figure 2.5:A) Steady-state photoluminescence spectrum of 2.1 µM CdSe QDs in toluene
after various purification steps (425 nm excitation). B) Time-resolved
photoluminescence spectrum of 2.1 µM CdSe QDs at 540nm in toluene after various purification steps (444 nm excitation). ... 25
Figure 2.6: 600 MHz1H NMR spectrum of 111 µM CdSe QDs (5.64 ppm) and 493 µM
ferrocene (3.97 ppm) in toluene-d8. A ligand density of 1.4 OA/nm2 is determined from the integrals of these peaks. ... 27
Figure 2.7: 1H NMR spectrum of 100 µM CdSe QDs titrated with undec-10-enoic acid
(UDA) in toluene-d8 (600 MHz). Legend indicates the QD:UDA ratio in solution. ... 29
Figure 2.8: Multi-peak fitting of the 600 MHz1H NMR spectrum of CdSe QDs and UDA in
toluene-d8. The maroon trace is the sample NMR spectrum, the magenta trace is the fit, and the red trace is the fit residual. ... 30
Figure 2.9: Plot of [OA]F[UDA]B vs. [OA]B[UDA]F. The slope of this plot can be used to
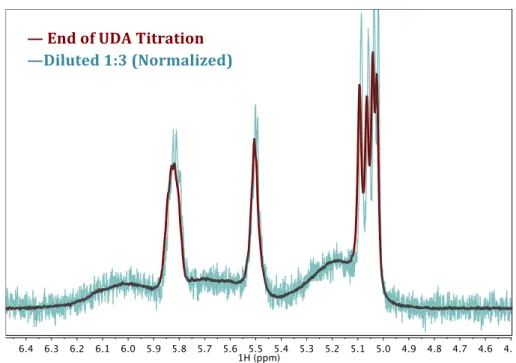
Figure 2.10: 600 MHz 1H NMR spectrum of 100 µM CdSe QDs and 0.012 M UDA in toluene-d8 before (maroon) and after (teal, normalized) dilution by a factor of 3. ... 32
Figure 2.11: 600 MHz 1H NMR spectrum of 100 µM CdSe QDs and 0.012 M UDA in
toluene-d8 before (maroon) and after (teal) the addition of 0.010 M free oleic acid. The stared peak indicates the Z-isomer of OA that is present in lab grade OA. ... 33
Figure 2.12: A) Absorption spectrum of 3 µM CdSe QDs in toluene titrated with UDA. B)
Steady-state PL spectrum (425 nm excitation) of 3 µM CdSe QDs in toluene titrated with UDA. ... 34
Figure 2.13: 500 MHz 1H NMR spectrum of 0.0015 M UDA and 0.0001 M QD at
temperatures ranging from 283 K to 313 K. ... 35
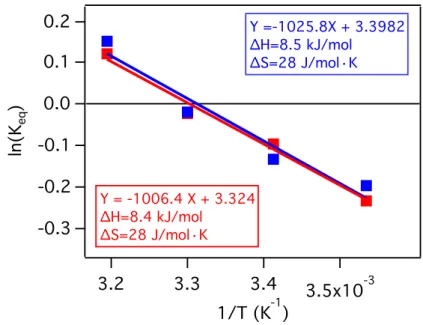
Figure 2.14: Van ’t Hoff plot for the ligand exchange between native OA and UDA in
toluene-d8. Sample 1 (blue trace) contains 0.0015 M UDA and 0.0001 M QD. Sample 2 (red trace) contains 0.0030 M UDA and 0.0001 M QD. ... 36
Figure 2.15: 600 MHz 1H NMR spectrum of UDA before (maroon) and after (teal) the
addition of 1 equivalent of N,N-diisopropylethylamine in toluene-d8. The starred peak indicated toluene solvent signal ... 37
Figure 2.16: 600 MHz 1H NMR spectrum of 100 µM CdSe QDs titrated with
UDA–N,N-diisopropylethylamine in toluene-d8. Legend indicates the QD:UDA ratio in solution. . 38
Figure 2.17:1H NMR spectrum of 100 µM CdSe QDs titrated with UDPA in toluene-d
8 (600 MHz). Legend indicates the QD:UDPA ratio in solution. ... 39
Figure 2.18: 600 MHz 1H NMR spectrum of CdSe QDs capped with UDPA before (maroon)
and after (teal) the addition of free OA. The starred peak indicates the Z-isomer of OA that is present in lab grade OA. ... 40
Figure 2.19: 600 MHz 1H NMR spectrum of CdSe QDs capped with UDPA before (maroon)
and after (teal) the addition of free octylphosphonic acid (OPA). The starred peak
indicates residual free OA. ... 41
Figure 2.20:A) Absorption spectrum of 2.3 µM CdSe QDs in toluene titrated with UDPA.
B) Steady-state PL spectrum (425 nm excitation) of 2.3 µM CdSe QDs in toluene
Figure 2.21: A) Absorption spectrum of 2.3 µM CdSe QDs in toluene titrated with UDPA and 1 equivalent N,N-diisopropylethylamine. B) Steady-state PL spectrum (425 nm excitation) of 2.3 µM CdSe QDs in toluene titrated with UDPA and 1 equivalent N,N-diisopropylethylamine. C) Absorption spectrum of 2.3 µM CdSe QDs in toluene titrated with UDPA and 2 equivalents N,N-diisopropylethylamine. D) Steady-state PL spectrum (425 nm excitation) of 2.3 µM CdSe QDs in toluene titrated with UDPA and 2
equivalents N,N-diisopropylethylamine. ... 43
Figure 2.22: Absorbance of 2 µM QDs CdSe QDs (red) exposed to excess UDPA for 2 days
(blue). ... 44
Figure 2.23: 600 MHz 1H NMR spectrum of 100 µM CdSe QDs titrated with UDT in
toluene-d8. Legend indicates the QD:UDT ratio in solution. ... 45
Figure 2.24: 600 MHz 1H NMR spectrum of 100 µM CdSe QDs titrated with UDT in
toluene-d8. Legend indicates the QD:UDT ratio in solution. Triplet peak indicates
disulfide formation. ... 46
Figure 2.25: 600 MHz 1H NMR spectrum of CdSe QDs capped with UDT before (maroon)
and after (teal) the addition of free OA. The starred peak indicates the Z-isomer of OA that is present in lab grade OA. ... 48
Figure 2.26: A) Absorption spectrum of 2.3 µM CdSe QDs in toluene titrated with
dodecanethiol (DDT). B) Steady-state PL spectrum (425 nm excitation) of 2.3 µM CdSe QDs in toluene titrated with DDT. ... 49
Figure 3.1: Surface loading isotherm for RuP‒SnO2. ... 58
Figure 3.2: Absorption spectra of RuP loaded on SnO2 (SnO2 absorption background
subtracted) in pH 1 and pH 3 aqueous HClO4 solutions. Γ = 7.5 x 10⁻⁸ mol cm-2. Inset: Absorption difference spectrum between pH 1 and pH 3. ... 59
Figure 3.3: Background corrected emission spectra of RuP on ZrO2 (solid lines) and SnO2
(dashed lines) in pH 1, 3, and 5 aqueous HClO4 solutions. ... 60
Figure 3.4: Raw steady-state emission spectra of RuP–SnO2 in pH 1, 3, and 5 aqueous
HClO4 solutions, as well as the emission spectrum of bare SnO2 collected in an
Figure 3.5: Background emission/scatter corrected steady-state emission spectra of RuP– SnO2 in pH 1, 3, and 5 aqueous HClO4 solutions... 61
Figure 3.6: Transient absorption spectra of RuP‒SnO2 in pH 1 HClO4, following 532 nm
excitation, at various time delays. Excess noise was filtered from the data by using 3 passes of binomial smoothing. ... 62
Figure 3.7: Spectroelectrochemical measurements of SnO2 in aqueous pH 1 HClO4.
Difference spectra shown are of the absorbance at the applied voltage minus the
absorbance at 0.45 V, AbsApplied – Abs0.45V, (grey to black) with applied voltages ranging up to –0.4 V vs. Ag/AgCl in 50 mV steps (some steps omitted for clarity). ... 63
Figure 3.8: Transient absorption spectral changes of RuP‒SnO2 (red) and RuP‒TiO2 (blue)
monitored at 400 nm following 532nm excitation (4 mJ) in pH 1 aqueous HClO4
solution. ... 64
Figure 3.9: Kinetics trace of RuP–SnO2 monitored at 400 nm following 532 nm excitation
(4mJ) in pH 5 aqueous HClO4 solutions. ... 65
Figure 3.10: A) Normalized and B) un-normalized transient absorption spectral changes of
RuP–SnO2 monitored at 400 nm following 532 nm excitation (4mJ) in pH 1, 3, and 5 aqueous HClO4 solutions. ... 67
Figure 3.11: Transient absorption spectral changes of (A) RuP‒SnO2 and (B) RuP‒TiO2
monitored at 400 nm following 532 nm excitation in pH 1, 3, and 5 aqueous HClO4 solutions. The pulse energies were varied to obtain the same maximum ΔAbsorbance (within ±3 mOD). ... 69
Figure 3.12: Transient absorption spectral changes of RuP–SnO2 and RuCH2P–SnO2
monitored at 400 nm following 532 nm excitation (4mJ) in pH 1 aqueous HClO4
solution. ... 70
Figure 3.13: Cyclic voltammograms of A) TiO2 and B) SnO2 in various pH solutions of
HClO4 containing 0.1 M NaClO4 as a supporting electrolyte. Scan rate: 20 mV/s. E°(Ag/AgCl) = 0.209 V vs. NHE. Current densities were estimated from the 2D active areas of the metal oxide electrodes. ... 71
Figure 3.14: Cyclic voltammogram of TiO2 in aqueous pH 7 solution with 100 mM NaClO4.
Figure 3.15: Comparison of the trap state distribution and resting potentials of SnO2 and TiO2. The orange shading indicates the concentration of injected electrons that occupy these trap states, with darker orange corresponding to higher concentrations. ... 77
Figure 3.16: Schematic comparing of the distribution of trap states and available
recombination pathways for RuP‒SnO2 and RuP‒TiO2 at low and high pH values. The orange shading indicates the concentration of injected electrons that occupy these trap states, with darker orange corresponding to higher concentrations. ... 80
Figure 4.1A) Structures of porphyrin chromophores (1 and 3) and ruthenium water
oxidation catalyst (2). B) The layer-by-layer chromophore-catalyst assembly MO2–1– Zr–2. ... 89
Figure 4.2:A) Cyclic voltametry of free base 4 and B) Zn-porphyrin 5 in 0.1 M
[nBu4N][PF6] in CH2Cl2. Scan rate = 100 mV/sec. Ferrocene was used as an internal standard (E°′ (Fc+/0) = + 690 mV vs. NHE). ... 90
Figure 4.3: Loading of TiO2–1 (~7µm thick nanocrystalline TiO2 film) from a 1.2 mM
solution of 1 in CH2Cl2/methanol (1:1) as a function of time. ... 91
Figure 4.4: Adsorption isotherm of TiO2–1 in CH2Cl2/methanol (1:1). ... 91
Figure 4.5: Comparison of emission quenching of 1 and 3 loaded on SnO2 and ZrO2 in
CH3CN (0.1 M LiClO4). ... 92
Figure 4.6: A) Cross sections of normalized absorption and emission for 4 and B)5 ... 93
Figure 4.7: Ground and excited–stateenergy levels of 1 and 3 with comparison to the
conduction bands of TiO2 and SnO2 at pH 7.220 ... 93
Figure 4.8: Comparison of emission quenching 1 and 3 loaded on TiO2 and ZrO2 in CH3CN
(0.1 M LiClO4). ... 94
Figure 4.9:A) Time dependent transient absorption difference spectra for SnO2–3 following
425 nm excitation in CH3CN (0.1 M LiClO4). B) P+–P absorption difference spectra for 5 in in MeCN (0.1 M [nBu4N][PF6]) as a function of applied potential as determined via a spectroelectrochemical titration. Potentials referenced vs. Ag/AgCl. C) Time
Figure 4.10:A) Time dependent transient absorption difference spectra for SnO2–1 following 425 nm excitation in CH3CN (0.1 M LiClO4). B) Time dependent transient absorption difference spectra for ZrO2–1 following 425 nm excitation in CH3CN (0.1 M LiClO4). C) P+–P absorption difference spectra for 4 in MeCN (0.1 M [nBu4N][PF6]) at 1.7 V vs. NHE as determined via a spectroelectrochemical titration. ... 97
Figure. 4.11A) Time-dependent transient absorption difference spectra for SnO2–1 and B)
ZrO2–1 in aqueous 0.1 M HClO4 after excitation at 425nm. ... 97
Figure 4.12: Subtraction of ZrO2–1 TA spectrum at 10 ns (scaled) from SnO2–1 TA
spectrum at 10 ns, illustrating the formation of 1+ in aqueous 0.1 M HClO
4. ... 98
Figure. 4.13 UV-visible spectrum of the layer-by-layer chromophore–catalyst assembly
SnO2–1–Zr–2 in CH3CN. ... 100
Figure. 4.14 Time-dependent transient absorption difference spectra for A) SnO2–1–Zr–2,
and B) ZrO2–1–Zr–2 in in aqueous 0.1 M in HClO4 following excitation at 425nm. .. 102
Figure 5.1: Powder XRD spectra of SnO2/TiO2 core/shell films with TiO2 thickness of 7.1
nm as deposited (red, amorphous) and after annealing at 450° C (blue, annealed). The inset depicts the difference in intensity between these traces, with new peaks
corresponding to anatase and rutile TiO2. ... 108
Figure 5.2: TEM images of SnO2 nanoparticles with 2.9 nm shells of TiO2A) as deposited
and B) after annealing at 450 °C. Conformal shell coating is observed in both samples. ... 108
Figure 5.3: Absorption spectra of RuP-sensitized SnO2/TiO2 and ZrO2/TiO2 core/shell films
in 0.1 M aqueous HClO4with varying TiO2 shell thickness. ... 109
Figure 5.4. Normalized transient absorption kinetics of SnO2/TiO2–RuP monitored at 400
nm in aqueous 0.1M HClO4 at various TiO2 thicknesses (λex = 470 nm, 3.8 mJ/pulse). ... 110
Figure 5.5. Transient absorption kinetics of SnO2/TiO2-RuP at 400 nm in aqueous 0.1 M
Figure 5.6: Transient absorption kinetics of as deposited ZrO2/TiO2–RuP at 400 nm in aqueous 0.1M HClO4 at various amorphous TiO2 thicknesses. Pulse energies are varied to obtain the same ΔOD at the first observation point, 10 ns (λex = 470 nm). ... 113
Figure 5.7: TA kinetics amorphous ZrO2/TiO2–RuP at 400 nm in aqueous 0.1M HClO4 at
various TiO2 thicknesses. Pulse energies 3.8 mJ for all TiO2 thicknesses (λex = 470 nm). ... 114
Figure 5.8: Normalized transient absorption kinetics of SnO2/TiO2-RuP at 400 nm in
aqueous 0.1M HClO4 at various TiO2 thicknesses after annealing at 450° C (λex = 470 nm, 3.8 mJ/pulse). ... 115
Figure 5.9: Transient absorption kinetics traces of SnO2/TiO2–RuP at 400 nm in aqueous
0.1M HClO4 at various TiO2 thicknesses after annealing at 450° C (λex = 470 nm, 3.8 mJ/pulse). ... 116
Figure 5.10: Transient absorption kinetics of annealed ZrO2/TiO2–RuP at 400 nm in aqueous
0.1M HClO4 at various TiO2 thicknesses. Pulse energies are varied to obtain the same
ΔOD at the first observation point (λex = 470 nm). ... 117
Figure 5.11. Qualitative schematic of the conduction band energies of the core and shell
metal oxides. Upon photoexcitation of the RuP chromophore, the electron likely initially injects into the conduction band of the shell material. The electron can then localize into the core of SnO2 and recombination can occur between both the shell and core-localized electrons with the oxidized chromophore. ... 118
Figure 5.12: Plot of ln(1/ τ1/2) vs. TiO2 thickness for amorphous SnO2/TiO2 films at equal
injection yields (red) and ZrO2/TiO2 films at equal injection yields (green). The fit models the back electron transfer dynamics with contributions from both tunneling and localized shell recombination. ... 119
Figure 5.13: Plot of ln(1/ τ1/2) vs. TiO2 thickness for amorphous SnO2/TiO2 films (red) at
equal pulse energies and ZrO2/TiO2 films (green). The fit models the back electron transfer dynamics with contributions from both tunneling and localized shell
recombination (β = 0.27 Å-1 and Xh = 3.4 nm). ... 121
Figure 5.14: Plot of ln(1/ τ1/2) vs. TiO2 thickness for amorphous ZrO2/TiO2. The fit
empirically models the back electron transfer dynamics from localized shell recombination with a sigmoid function as follows: fshellx =16.191+-‐3.8041+
Figure 5.15: Sigmoidal weighting functions from the analysis of the equal injection yield data (β = 0.25 Å-1 and Xh = 3.2 nm). ... 123
Figure 5.16: Plot of ln(1/ τ1/2) vs. TiO2 thickness for annealed SnO2/TiO2 films (red) and
LIST OF ABBREVIATIONS AND SYMBOLS
E00 0-0 energy gap
bpy 2,2′-bipyridine
Abs Absorbance
Å Angstrom
ALD Atomic layer deposition
BET Back electron transfer
kB Boltzmann constant
CdSe Cadmium selenide
C Celsius
cm Centimeter
ΔH Change in enthalpy
ΔS Change in entropy
CCD Charge-coupled device
δ Chemical shift
CB Conduction band
ECB Conduction band energy
CV Cyclic voltammogram
DOS Density of states
DCM Dichloromethane
DOSY Diffusion-ordered NMR spectroscopy
-ΔG° Diving force
r Donor-acceptor distance
DSPEC Dye-sensitized photoelectrosynthesis cell
DSSC Dye-sensitized solar cell
e- Electron
kET Electron transfer rate contant
eV Electron volts
HAB Electronic coupling
Keq Equilibrium constant
eq Equivalent
λex Excitation wavelength
Fc Ferrocene
FTO Fluorine-doped tin oxide
E°′ Formal potential
FWHM Full-width at half max
ΔG Gibbs free energy
g Gram
E1/2 Half wave potential
Hz Hertz
ITO Indium-doped tin oxide
h𝜈 Irradiation
K Kelvin
kV kilovolt
λmax Maximum absorbance wavelength
MHz Megahertz
MOX Metal oxide
MLCT Metal-to-ligand charge transfer
µm Micrometer
µM Micromolar
µs Microsecond
mJ Millijoules
mg Milligram
mL Milliliter
mm Millimeter
mM Millimolar
mmol Millimole
mOD Millioptical density
mV Millivolts
M Molar
MEG Multi-exciton generation
NC Nanocrystal
nm Nanometer
ns Nanosecond
Nd:YAG Neodymium doped yttrium aluminum garnet
NHE Normal hydrogen electrode
NOESY Nuclear Overhauser effect spectroscopy
λobs Observation wavelength
Ω Ohm
OA Oleic acid
OCP Open circuit potential
OD Optical density
OPO Optical parametric oscillator
ppm Parts per million
PL Photoluminescence
PMT Photomulitplier tube
PS Photosensitizer
PV Photovoltaic
h Planck's constant
pXRD Powder X-ray diffraction
H+ Proton
QD Quantum dot
QDSSC Quantum dot sensitized solar cell
λ Reorganization energy
RuCH2P [Ru(bpy)2(4,4′-(CH2PO3H2)2bpy)]2+
RuP [Ru(bpy)2(4,4′-(PO3H2)2bpy)]2+
s Second
SILAR Successive ionic layer deposition
TCO Transparent conductive oxide
T Temperature
TW Terawatt
t Time
τ1/2 Time for 1/2 signal decay
TA Transient absorption
TEM Transmission Electron Microscopy
UV-Vis Ultraviolet-visible
UDPA Undec-10-en-1-ylphosphonic
UDT Undec-10-ene-1-thiol
UDA Undec-10-enoic acid
VB Valence band
V Volt
W Watt
λ Wavelength
w/v Weight/volume
XPS X-ray photoelectron spectroscopy
CHAPTER 1. Introduction
1.1. Motivation for developing solar energy technologies
Coal, petroleum, and other fossil fuels are currently leading sources of electric power
generation worldwide, which raises economical, environmental, and sustainability
concerns.1–3 The combustion of these fossil fuels releases carbon dioxide, a greenhouse gas
that plays a role in global warming, and the acidification of ocean water.4–7 In 2013 alone the
burning of fossil fuels released 5.405 × 10¹² kg of carbon dioxide into Earth’s atmosphere.1
Additionally global energy consumption rates are increasing; from 15 TW in 2005 to a
projected 27.6 TW in 2050.3 In order to meet these rising global energy demands, and
prevent environmental crises like global warming, adopting renewable, carbon-neutral fuel
sources is required.
The most viable solution to this energy crisis is sunlight, with 89,000 TW of energy
reaching the earth from the sun annualy3. Solar energy devices have made great
improvements in the last decades, with sunlight-electricity efficiencies of 44% being
achieved for multi-junction cells.8 Nonetheless, less that 1 percent of the United States’
energy consumption comes from solar technologies.1 This is because there are inherent
obstacles of utilizing solar energy that have not yet been overcome. The suns energy is both
diffuse, and intermittent, reducing its extractable energy potential.3 In order for large-scale
implementation of solar energy as a renewable energy resource, solar energy technologies
must have maximum efficiencies, inexpensive production from earth abundant materials, and
One solution to address the issue of energy storage is the production of solar fuels;
using energy from sunlight to produce hydrogen or reduced hydrocarbons from water and
carbon dioxide.2,9,10 A proof of concept for this practice has been well established by nature,
through the process of photosynthesis, where sunlight and water are converted to oxygen and
sugars. However, in nature complex enzymes have evolved over millions of years to carry
out photosynthesis, and the solar energy conversion efficiency of biomass is only 1%.9,11–14
In order to mimic natural photosynthesis without the use of the complex enzymes, the
fundamental processes such as light harvesting, charge separation, and water oxidation, must
be isolated and understood.
Because these fuel-forming reactions in both natural and artificial systems proceed via
sequential electron transfer steps, characterizing the dynamics of these electron transfer steps
is an essential step to producing functional and efficient devices. Additionally, analogous
electron transfer processes dictate the efficiency of currently utilized solar-to-electricity
devices such as solar cells. Having a fundamental understanding of the factors that govern
these electron transfer processes will allow for rational device design that will maximize the
efficiencies of both solar cell and solar fuels systems.
1.2. Dye-Sensitized Solar Cells
Currently, the most common solar energy technologies are photovoltaic (PV) devices,
which utilize solar energy to produce electricity. The most commercially familiar solar cells
are those made from crystalline silicon. This is because the efficiency, lifetime, and
production cost of these cells is the most economical compared to other solar cell
cost to produce crystalline silicon along with the calculated lifetimes of these devices makes
these technologies unable to compete with the energy prices of fossil fuels.1,16
As a result, many new areas of research have emerged in an attempt to develop other
cheaper solar energy technologies, including thin-film technologies, organic PVs, as well as
dye-sensitized solar cells. While many of these technologies currently have lower efficiencies
than the traditional crystalline silicon solar cells, their low production costs may be able to
compensate for large-scale use.17,18 Additionally, they have become increasingly more
efficient over the past few decades, and further research to improve the efficiencies of these
devices may finally allow for solar technologies to economically compete with other energy
sources.19
Dye-sensitized solar cells (DSSCs) are of particular interest because or their low
production costs and light absorption tuneability.20–27 DSSCs are comprised of a
photoelectrode, where a light-absorbing molecule is adsorbed to a mesoporous metal oxide, a
counter electrode, and a liquid electrolyte, which contains a redox mediator. One advantage
of DSSCs is that the light absorption and charge separation processes are separated, which
allows for the independent optimization of each of these processes. Different photosensitizers
can be employed to absorb the maximum amount of solar radiation, while the semiconductor
metal oxide can be altered to optimize the charge separation and extraction.
The most common type of DSSCs are n-type DSSCs, which consist of a photoanode and
a dark cathode. A schematic representation of an n-type DSSC is shown in Figure 1.1. In
these devices, light absorption by the photosensitizer (PS) is followed by excited-state
electron injection into the acceptor states of the semiconductor. Once the electron is residing
conductive oxide (TCO) back contact, or undergo detrimental back electron transfer (BET).
Ideally the rate of electron transport through the semiconductor should be faster than the rate
of back electron transfer to maximize the efficiency of the device. The electrons that are
successfully transported to the TCO back contact flow to the counter electrode. This flow of
electrons is what produces the electrical current that can be used in from these devices. Once
at the counter electrode, the electrons reduce the electron mediator that is present in the
electrolyte solution. This reduced mediator can diffuse in solution and reduce the oxidized
photosensitizer, completing the circuit for the device. It is worth noting the BET can also
occur between the electron in the conduction band of the semiconductor and the oxidized
form of the redox mediator, creating another pathway for deactivation.
Figure 1.1 Simplified schematic representation of an n-type DSSC. PS is a generic
photosensitizer.
e"
VB"
PS+/PS"
PS+/PS*"
e*" e*"
hν"
Mediator" Mediator*
"
e*" e
*"
CB"
e*"
Traditionally, DSSCs have used ruthenium-based photosensitizers for light absorption,
which raises problems in terms of cost efficiency, stability, and tunability. Ruthenium-based
photosensitizers are expensive, prone to degradation after multiple oxidation/reduction
cycles, and have limited visible absorption tunability. As such, part of DSSC research has
focused on developing robust, inexpensive photosensitizers with absorption profiles that span
the entire solar spectrum. Alternative photosensitizers that have gained popularity include
organic dyes, such as porphyrins,28–32 as well as semiconductor quantum dots.22,33–36
Quantum dots (QDs) have gained a lot of popularity as photosensitizers in DSSCs because
they are inexpensive, easy to synthesize, and are robust towards oxidation and
reduction.33,34,37,38 Additionally, they have very high extinction coefficients (up to 106 M-1cm
-1), size dependent absorption profiles, and the potential to produce multiple electron
equivalents with a single photon, known as multi-exciton generation (MEG).33,39–43
Quantum dot sensitized solar cells (QDSSCs) operate in a similar fashion to DSSC,
but one of the challenges is finding compatible electrolyte mediators for these systems.
Mediators that show high performance in DSSCs, such as I-/I3-, cannot be used with
semiconductor quantum dots because of their corrosive nature. Therefore, sulfide/polysulfide
electrolytes are generally used in conjunction with Cu2S-based counter electrodes.33,44
Another difference challenge for QDSSCs is incorporating QD sensitizers with strong
coupling to the metal oxide for efficient electron injection. In DSSCs that use molecular
photosensitizers, the photosensitizer is usually modified to contain a surface anchoring group
that can covalently bind to the metal oxide surface.10,28,31,45–48 This allows for monolayer
a photosensitizer poses a unique challenge, as functionalizing these nanocrystals can be
challenging.
In order to sensitize metal oxide films with QDs, physisorption of QDs onto TiO2
film is commonly employed, but native ligands act as insulating barriers for charge transfer,
impacting efficiencies of devices.33,34 Another route that has been pursued for incorporating
QD sensitizers into QDSSCs is direct growth of QDs onto the TiO2 substrates through
successive ionic layer adsorption and reaction (SILAR).36,49 While this SILAR method
exhibits higher loading of the QD layer than direct adsorption of presynthesized QDS, the
chemical identity of these nanostructures is not well understood. Additionally the increased
coupling in these systems leads to faster recombination rates, requiring blocking layers to be
introduced to increase efficiencies.49
Other efforts have been made to incorporation QD synthesized via tradiation
solution-based syntheses. As synthesized, these colloidal QDs are composed of an inorganic
nanocrystalline core, and an aliphatic organic ligand shell which stabilizes the QDs in
organic solvents. In order to incorporate colloidal QDs into many of their applications,
including DSSCs, this ligand framework must be modified. Thus, procedures have been
developed to exchange these for other coordinating ligands that may vary in the surface
anchoring group and ligand identity. 34,35,50–70 For example, bifunctional ligands containing
thiol and carboxylic acid functionalities are commonly used to anchor QDs to metal oxide
surfaces.71–77 First the metal oxide is exposed to the bifunctional ligand and the carboxylic
acid moiety preferentially binds to the metal oxide surface. Then, QDs are introduced and the
thiol moiety replaces native QD ligands, anchoring the QDs to the metal oxide. Alky chains
charge transfer between the QD and metal oxide.76 In another study a dye molecule,
squaraine, acted as both a linker molecule and an electron relay. The dye was modified with
carboxylic and thiol moieties and metal oxide-QD linkage was performed as described
above. In this system the QD absorbs light and undergoes energy transfer with the dye, which
then injects an electron into the TiO2.78
Although these ligand exchange processes are commonly employed, the mechanisms
and principles that govern these reactions are not explicitly understood.79 Furthermore, the
extent of these ligand exchange reactions must be controlled if a selective functionalization
of the nanocrystal is desired. Chapter 2 of this dissertation will examine these ligand
exchange reactions in detail, and explore the factors than govern these processes.
1.3. Dye-Sensitized Photoelectrosynthesis Cells
As mentioned above, one of the major shortcomings of current solar energy technologies
is the lack of energy storage capability. As such, research efforts in the production of solar
fuels has emerged.2,9,10 Dye-sensitized photoelectrosythesis cells (DSPECs) have been
proposed as one approach for solar fuel production, which builds off the successful design of
the DSSC.10,80–85 First a light-harvesting molecule is anchored to a low cost metal oxide,
then, upon light absorption, the molecule is able to transfer an electron to the semiconductor
metal oxide. In a DSSC these electrons flow to a counter electrode, providing a current that
can be used to drive a load, however the goal of a DSPEC is to harvest this energy and store
Figure 1.2. Schematic of a DSPEC for water oxidation and CO2 reduction. (Figure credit John M. Papanikolas and James F. Cahoon)
In a tandem DSPEC, as shown above, both electrodes function as photoelectrodes. On the
photoanode side of the device, a photosensitizer absorbs light and injects an electron into the
conduction band of an n-type semiconductor metal oxide. On the photocathode side, a
separate photosensitizer absorbs light and injects an electron vacancy, or hole, into the
valence band of a p-type metal oxide. The electrons and holes that remain after these light
absorption and injection process occur are transferred to molecular catalysts to do two
complementary processes, water oxidation (oxygen generation) and carbon dioxide or proton
reduction. At the photoanode, 4 hole equivalents are used by a catalyst to oxidize water into
protons (H+) and oxygen (O2). At the photocathode, the electron equivalents are used by a
protons to hydrogen gas. Although this device architecture is proposed often in the literature,
there have been limited reports of successful DSPECS, where devices suffer from low
efficiencies, limited stabilities, and require a bias, or a small energy input to function.84,86–90
There are many challenges associated with producing a functional and efficient DSPEC.
To enable water splitting, four oxidizing equivalents must be transferred from the
photosensitizer to the water oxidation catalyst. These four equivalents need to be driven by
four sequential single-photon excitations and injection processes. This is often limited as
electrons in the metal oxide can recombine with the oxidized chromophore or the oxidized
catalyst without going through the catalytic cycle, wasting the photon that generated the
charge separated state. This back electron transfer process regenerates the original (and
inactive) state of the assembly. Similar detrimental recombination events occur on the
photocathode side of the device as well. Understanding the mechanisms by which
photon-wasting charge recombination occurs will help in optimizing materials and conditions for
efficient DSPECs.
Some research in the DSPEC field involves indiscriminately altering device parameters
in hopes to maximize efficiency. However, fundamental studies to characterize the electron
transfer processes that occur in these devices are necessary to guide rational device design.
Chapters 3, 4, and 5 of this dissertation focus on studying the mechanisms of interfacial
charge recombination processes that occur in these solar energy devices.
1.4. Charge Recombination Mechanisms in Semiconductor-Chromophore Systems
There have been extensive research efforts in characterizing and understanding charge
recombination dynamics at semiconductor-chromophore interfaces. TiO2 is one of the most
properties as a thin film. Ruthenium polypyridyl complexes are also commonly studied
chromophores due to their strong absorption in the visible region of light, in addition to their
potent excited-state reduction potentials which provide a free energy gradient between their
excited states and the conduction band of TiO2, promoting efficient charge injection.21,45,46,91
If electron transfer in these systems follows Marcus theory for electron transfer, the rate
will be dictated by various parameters including the driving force (-ΔG°), reorganization
energy (λ), and the electronic coupling of the donor and acceptor (HAB). The impact each of
these parameters has on the rate of electron transfer is depicted in the Marcus equation
(Equation 1.1).92
The driving force is the difference in energy between the excited state oxidation potential
of the chromophore and the acceptor states of the metal oxide. This can be altered by
changing the chemical composition of the system (changing the chromophore or metal oxide
used), but also by altering the environment. For example, changing the pH of the surrounding
environment causes the acceptor states of metal oxides to more positive potentials with
decreasing pH.93 By changing chemical composition and environment in a systematic manner
we can characterize interfacial electron transfer within the framework of Marcus theory or
determine if other factors govern this electron transfer process.
There have been conflicting results for studies conducted examining the effects of driving
force on the rate of back electron transfer in ruthenium-metal oxide assemblies. G. J. Meyer
and coworkers have shown back electron transfer to be independent of driving force.94,95 A
𝑘!" = 4𝜋! ℎ!𝜆𝑘
!𝑇 𝐻!"
! exp − Δ𝐺∘+𝜆 !
variety of rhenium, osmium, and ruthenium complexes were attached to TiO2 and the same
rate for back electron was observed fitting the data to a sum of second order kinetic
processes, despite a 960 mV difference in the driving forces. Additionally the rate of back
electron transfer is also unaffected by the identity of the metal (rhenium, ruthenium, or
osmium) and the number of carboxylic acid groups. This is further supported by a study from
Durrant and coworkers where similar recombination rates from TiO2 we observed for both
porphyrin and ruthenium based sensitizers.32 This suggests that the observed recombination
is rate limited by the electron trapping and detrapping processes that occur in the TiO2. This
trapping/detrapping mechanism for BET is consistent with additional studies that show that
recombination in these systems is very sensitive to applied potentials to the TiO2
electrode.81,96–100
On the contrary, others have shown back electron transfer in these systems is consistent
with Marcus inverted behavior, that is, slower BET rates are observed when the driving force
is increased.97,101 Lewis et al. have reported Marcus inverted region back electron transfer for
a series of ruthenium and osmium dyes linked to the surface of TiO2. They have shown that
as the driving force increases 660 mV, the rate of back electron transfer decreases by a factor
of 300.97 Hupp and coworkers have also reported Marcus inverted regime behavior for
ruthenium tris(polypyridine) complexes electrostatically bound to the surface of colloidal
SnO2 in aqueous solutions.101
Another study has shown that these recombination kinetics are invariant of driving force,
but do depend on separation between the metal oxide and the chromophore.102 Here they
state that the recombination from TiO2 to ruthenium chromophores lies in an intermediate
elegant study by Brigham and Meyer expands on this and shows that when the number of
electrons residing in the TiO2 is small (under positive bias), diffusion/trap limited
recombination ensues. However, when the density of electrons in the TiO2 is large (under
negative bas), interfacial electron transfer is rate limiting.103
These apparent inconsistencies in the literature may be due to differences in kinetic
modeling methods as well as the inherent heterogeneity of metal oxide semiconductors.
Meyer noted in his studies that recombination kinetics were more sensitive to the materials
processing conditions and sample history than to the identity of the sensitizer.94 Additionally,
Lewis stated that differences in the kinetics of sensitized semiconductor systems may, in part,
result from the different modes of coupling to the metal oxide that arise from the variety of
sensitizers used, as well as from differences in the trap density and surface properties of the
TiO2 that is used for various studies.97
In an aim to rectify these discrepancies and understand these BET dynamics in
aqueous conditions, Chapter 3 of this dissertation will discuss studies that were conducted
comparing electron recombination dynamics for metal oxide-chromophore systems using
both TiO2 and SnO2. The difference in acceptor state potentials for these two semiconductors
allows the influence of driving force on back electron transfer to be examined. In addition,
varying other Marcus parameters, such as electronic coupling, allows the principles that
govern charge recombination in these systems to be tested. Here, back electron transfer rates
for both of the semiconductor-chromophore systems used are correlated with the distribution,
identity, and occupation of localized trap states within the nanocrystalline metal oxide films.
Recombination is influenced by the identity of metal oxide localized trap states populated
1.5. SnO2 as a Photoanode Alternative to TiO2
In the context of a DSPEC, SnO2 is of interest as an alternative photoanode material to
TiO2. This is because the charge carrier mobility of SnO2 is 2-3 orders of magnitude greater
than TiO2, allowing for faster charge extraction upon excited-state injection into the
semiconductor.104–106 Additionally, the conduction band potential of SnO2 is 0.4 V positive of
TiO2,83,107,108 making SnO2 compatible with chromophores that are weaker excited state
reductants and, in turn, stronger ground state oxidants capable of driving water oxidation
catalysis.28,29 However there have been numerous studies of the electron transfer dynamics of
chromophore-catalyst systems on TiO2, but very few on SnO2.109–114 Chaper 4 of this
dissertation examines the interfacial electron transfer processes of porphyrin chromophores
synthetically designed with an excited state oxidation potential capable of injecting an
electron into SnO2, but not TiO2. The electron transfer dynamics of a chromophore-catalyst
assembly synthesized via a layer-by-layer technique are also examined.
Although SnO2 is a desirable photoanode material for DSPEC devices, there are some
drawbacks to using SnO2. The main drawback, as highlighted in Chapter 3 is the faster
charge recombination observed for SnO2 than TiO2. There has been a lot of research done
developing different strategies to slow down BET.25,30,31,47,48,115–126 One of these strategies is
the use of a core/shell photoelectrode.84,120,122,126,127 Core/shell structures, where the
conduction band potential of the shell is more negative than that of the core, allow for
energetically favorable electron injection into the core material, while providing a significant
barrier for BET from core-localized electrons. Utilizing a SnO2/TiO2 core shell material as a
photoanode would allow the higher carrier mobility of SnO2 to be exploited, while slowing
have been incorporated into devices increased efficiencies are observed.47,120,124 Although
increased device performance is observed, the mechanism by which this recombination
occurs remains unclear. Without an understanding of how recombination occurs in these
systems, optimal device parameters for variables such as shell thickness, barrier height, and
annealing conditions remain unknown. Chapter 5 of this dissertation examines the
recombination dynamics for sensitized SnO2/TiO2 photoanodes. This study examines the
effects of shell thickness and annealing on the rate of recombination in these systems. Two
competing mechanisms of back electron transfer are identified in these systems; tunneling of
core-localized electrons, and direct recombination with shell-localized electrons. The
CHAPTER 2. Quantifying Ligand Exchange Reactions at CdSe Nanocrystal Surfaces
2.1. Introduction
Research in the field of semiconductor quantum dots has exploded since the
discovery of their quantum size effects in 1983.41 Their size tuneable optical properties have
been exploited for applications ranging from photovoltaic cells to solid-state lighting.33,128 As
synthesized, colloidal QDs are composed of an inorganic semiconductor core and an organic
ligand shell. These ligands, generally long chain fatty acids, aid in the growth and
stabilization of the QDs, solubilize the QDs in organic solvents, and passivate
undercoordinated surface atoms of the QD. However, these native ligands are not ideal for
many QD applications, and can be exchanged for other coordinating ligands which may vary
in the surface anchoring group, chain length, and chain identity. Ligand exchanges are
commonly performed to incorporate functional groups that alter QD solubility, introduce
electron transfer partners, or integrate biological receptors.34,35,50–70 The extent of these ligand
exchange reactions must be controlled if a limited number of functionalized ligands per
nanocrystal is desired.
Although ligand exchange reactions are commonly employed, the mechanisms and
principles that govern these processes are not explicitly understood.79 Many studies have
been conducted monitoring the surface chemistry of quantum dots using photoluminescence
spectroscopy, 1H nuclear magnetic resonance (NMR) spectroscopy, as well as
diffusion-ordered NMR spectroscopy (DOSY), nuclear Overhauser effect spectroscopy (NOESY), and
chalcogenide nanocrystals, Hens and coworkers have employed these NMR methods to
examine the details of various ligand exchange reactions. Through these experiments, they
determined that phosphonic acids displace oleic acid (OA) with a 1:1 stoichiometry,132 and
that the self-exchange of oleic acid/oleate at the surface of CdSe QDs involves a proton
exchange.134 In a related approach, Cammidge and Bochmann used 1H NMR to qualitatively
study the relative binding strengths of ligands containing carboxylic acid, phosphonic acid,
and thiol surface anchoring groups.137 Additionally, Owen and coworkers have demonstrated
the use of 1H NMR to quantify the amount of Z-type M(O2CR)2 displacement from metal
chalcogenide nanocrystals upon addition of L-type exchange ligands.136
However, many of these studies are qualitative in nature, and the quantitative studies
generally rely on the 1H NMR signature of OA, which sheds light only on the behavior of the
native ligands and leaves the behavior of the incoming exchange ligands open to
interpretation. Without a handle to monitor the state of the ‘exchange ligand,’ there is no way
to quantify the ratio in which these ligands exchange, determine whether they first occupy
open surface sites before exchanging, and distinguish between a surface equilibrium versus
an irreversible displacement. Additionally, the use of NMR techniques alone does not
distinguish between exchange reactions that occur between ligands versus those that involve
labile Z-type surface ligands containing metal atoms. In order to exploit these ligand
exchange reactions for controlled nanocrystal (NC) functionalization, a more thorough
understanding of the NC surface chemistry is required.
In response, we have employed carboxylic acid, phosphonic acid, and
thiol-terminated ligands containing a terminal alkene group in order to quantitatively monitor
vinylic protons of these ligands and the alkenyl protons of the native oleic acid ligands
provide distinct NMR handles for the free and surface-bound populations of both ligands in
solution. Quantification of these unique 1H NMR resonances provides new and valuable
information about the exchange mechanism and reversibility of common ligand exchange
reactions. Further, complementary absorbance and photoluminescence experiments indicate
whether surface metal atoms are disrupted in the exchange reaction.
Figure 2.1: Names and structures of the ligands used in this study.
2.2. Experimental
2.2.1. General Considerations.
Standard glovebox and vacuum line techniques were utilized to maintain an inert
atmosphere during synthesis of compounds and NCs, unless otherwise noted. 1H and 31P
NMR spectra were recorded using 400, 500, or 600 MHz Bruker NMR spectrometers.145
NMR spectra are reported at 25 °C unless otherwise stated. Chloroform-d and toluene-d8
purification. All other reagents were commercially available and used without further
purification.
2.2.2. Absorbance Measurements
Absorbance measurements were recorded using a Cary 60 UV-vis absorbance
spectrophotometer.
2.2.3. Steady-State Emission.
Photoluminescence spectra were acquired with a PTI QuantaMaster 4SE-NIR
emission spectrometer equipped with a housed, 75 W Xenon light source and Hamamatsu
R928P PMT biased at 1100 V (1 nm step size, 2 nm bandwidth). Samples were excited at
425 nm, with a 430 nm long-pass optical filter placed before the detector. Emission
intensities at each wavelength were corrected for system spectral response.
2.2.4. Time Resolved Emission.
Time-resolved emission dynamics were monitored with an Edinburgh FLS920
spectrometer, using the time-correlated single-photon counting capability (1024 channels; 1
ns per channel) with each data set collecting a set number of counts. Excitation was provided
by an Edinburgh EPL-445 picosecond pulsed diode laser (444.2 nm, 80 ps FWHM) operated
at 50 MHz.
2.2.5. CdSe QD Synthesis.
CdSe quantum dots were synthesized and purified following the procedure of
Chambrier et al.137 In a 50 mL 3-neck round bottom flask, 300 mg (2.33 mmol) CdO (Sigma
Aldrich, ≥99.99%) was added to 2.0 mL (6.3 mmol) of oleic acid (Fisher Scientific, 90%)
flask under vacuum for 20 minutes. The reaction flask was then placed under N2 and heated
to 280 °C with a heating mantle until the solution became clear, indicating the in situ
formation of Cd(oleate)2. The solution was cooled to 120 °C, and 100 mg (1.27 mmol) of Se
powder (Sigma Aldrich, 100 mesh, 99.5%) was added under a N2 stream. The solution was
stirred vigorously while the temperature was raised to 240 °C. The reaction solution changed
from colorless to yellow to orange, indicating QD nucleation and growth. The flask was
removed from the heating mantle after approximately 2 minutes, then 40 mL of toluene was
added to the reaction flask to quench nanocrystal growth. The reaction solution was separated
into 8 test tubes, and 5 mL of acetone was added to every 7.5 mL of reaction solution. This
ratio of toluene to acetone was found to solubilize the QDs but promote the precipitation of
excess Cd(oleate)2. After sitting for 5 minutes, the test tubes were centrifuged to produce a
white pellet and an orange supernatant. This step was found to be crucial in obtaining QDs
with 1H NMR spectra free from excess oleic acid/Cd(oleate)2. The orange supernatant
containing the QDs was decanted from the white Cd(oleate)2 pellet. The supernatant was
again distributed among test tubes, and methanol was added to achieve a 1:1 ratio of
methanol to QD supernatant. Upon centrifugation the solution separated into a thick orange
oil and a clear supernatant. The supernatant was discarded, and toluene was added to each
test tube to redisperse the oil, then methanol was added to precipitate the QDs (1:1
toluene:methanol). After centrifugation, the supernatant was discarded, and the QDs were
redispersed in DCM (7mL), and flocculated with ethanol (7mL). This DCM/ethanol
purification step was repeated 5 times and a pellet was formed upon centrifugation. Lastly,
acetone (~7mL) was added to the QD pellet and the tube sonicated until the pellet was
5 times to obtain a fine powder. This step has shown to be crucial to remove excess
octadecene from the QDs, and provide a pristine NMR-quality sample.134 The final sample
was dried to yield a fine powder, and was stored as a solid. The 1H NMR spectrum in
toluene-d8 is shown in Figure 2.2. The absorbance and photoluminescence spectra of the QDs
in toluene are shown in Figure 2.3. The size of the quantum dots was determined from the
wavelength of the E1S absorption maximum as outlined by Jasieniak and coworkers.146 The
QDs used throughout this study ranged from 2.8 to 2.9 nm.
Figure 2.2: 600 MHz 1H NMR spectrum of CdSe QDs in toluene-d8. Peaks at 7.09, 7.01,
6.97, and 2.08 ppm correspond to residual toluene solvent signals. The singlet peak at 3.98 ppm corresponds to the ferrocene standard. The singlet at 1.56 ppm is due to residual water in the NMR solvent.
Figure 2.3: Absorbance and photoluminescence spectra of CdSe QDs in toluene after
purification. Emission spectrum collected at 425 nm excitation.
2.2.6. Synthesis of undec-10-en-1-ylphosphonic acid.
Synthesis of undec-10-en-1-ylphosphonic acid was carried out via literature
procedures.147,148 In a 25 mL Schlenk flask, 2 mL (9.12 mmol) 11-bromo-1-undecene and 2
mL (11.7 mmol) triethyl phosphite were heated to reflux, neat, at 150° for 36 hours under
atmosphere. The reaction was cooled and excess triethyl phosphite was removed under
vacuum. Under a N2 atmosphere, 10 mL of dichloromethane was added to the product,
followed by dropwise addition of 3.47 mL (26.3 mmol) bromotrimethylsilane. The reaction
was stirred overnight, after which the solvent and excess bromotrimethylsilane were removed
under vacuum. 10 mL of water and 10 mL of acetone were added and the reaction was stirred
for 1 hour. The solvent was removed and the product was recrystallized from hot pentane
five times. 1.108 g of the pure product was obtained (52% yield). 1H NMR (600 MHz,
CDCl3) δ (ppm): 7.63 (2H, br s) 5.81 (1H, ddt, J=16.9 Hz, 10.2 Hz, 6.7 Hz), 4.99 (1H, dq,
J=16.9 Hz, 1.8 Hz), 4.93 (1H, ddt, J=10.2 Hz, 2.3 Hz, 1.3 Hz), 2.04 (2H, ddt, J=14.8 Hz, 6.87
Hz, 1.4 Hz), 1.74 (2H, m), 1.60 (2H, m), 1.37 (2H, m), 1.27 (8H, m). 31P NMR (600 MHz,
CDCl3) δ (ppm): 37.61.
2.2.7. Synthesis of S-(undec-10-en-1-yl) ethanethioate.
Undec-10-ene-1-thiol was synthesized via literature procedures.149,150 1.71 g (15
mmol) potassium thioacetate was added to 15 mL of 95% ethanol in a pear flask, sonicated
until fine, and then sparged with N2 for 20 minutes. This solution was then added to a
previously sparged solution of 3.5 mL (16 mmol) 11-bromo-1-undecene in 15 mL ethanol
(95%) in a Schlenk flask. The resulting solution was heated to reflux under N2 for 19 hours.
The solution turned brown over time and white precipitate slowly formed (KBr). The
reaction mixture was diluted with 50 mL water and extracted with 3x50 mL pentane. The
organic fractions were combined and concentrated via rotary evaporation. The resulting
crude product was purified via column chromatography over silica gel using a gradient
pentane to 4:1 pentane:diethyl ether eluent to give S-(undec-10-en-1-yl) ethanethioate. Yield
2.5 mL (83%). 1H NMR (400 MHz, CDCl3) δ (ppm): 5.81 (1H, ddt, J=17.0 Hz, 10.1 Hz, 6.7
Hz), 4.99 (1H, dq, J=17.2 Hz, 1.8 Hz), 4.92 (1H, ddt, J=10.1 Hz, 2.3 Hz, 1.2 Hz), 2.86 (2H, t,
J=7.3 Hz), 2.32 (3H, s), 2.03 (2H, ddt, J=14.8 Hz, 6.87 Hz, 1.4 Hz), 1.55 (2H, qn J=7.8 Hz),
1.35 (4H, m), 1.27 (8H, m).
2.2.8. Synthesis of undec-10-ene-1-thiol.
A Schlenk flask containing 10 mL dry diethyl ether and 400 mg (10.5 mmol) LiAlH4
was placed under N2 and cooled to 0° C. 1.37 g (6.0 mmol) S-(undec-10-en-1-yl)