FAMILY PLANNING IN URBAN KENYA:
AN EXAMINATION OF THE FACTORS AFFECTING
CONTRACEPTIVE USE
Laili Irani
A dissertation submitted to the faculty of the University of North Carolina at
Chapel Hill in partial fulfillment of the requirements for the degree of Doctor of
Philosophy in the Department of Maternal and Child Health.
Chapel Hill
2012
Approved by:
Ilene S. Speizer, Ph.D.
Siân L. Curtis, Ph.D.
Jean Christophe Fotso, Ph.D.
Kavita Singh Ongechi, Ph.D.
©2012
Laili Irani
Abstract
LAILI IRANI: Family Planning in Urban Kenya: An Examination of the Factors Affecting Contraceptive Use
(Under the guidance of Dr. Ilene S. Speizer) Background
While Kenya’s national fertility rate has declined, the urban poor still have high fertility rates and a great family planning (FP) need. This dissertation aims to study the impacts of married/cohabiting couples’ characteristics and environmental factors on contraceptive use patterns among urban Kenyans.
Methods
Data came from baseline population-based surveys from the Measurement, Learning and Evaluation Project in three Kenyan cities: Nairobi, Mombasa and Kisumu.
For the first paper, women aged 15-49 were surveyed. The outcomes of interest were contraceptive use patterns (current/former/never user), and current user patterns (first
method/switched from less to more effective/switched from more to less effective method). Multinomial logistic regression methods were used.
Results
The first paper shows that current contraceptive use and switching patterns, among current users, did not vary by neighborhood type (formal/informal). However, across household wealth, 62% of poor women were current users compared to 67% of the rich. Among current users, poor women were more likely to be using their first method than to have switched methods, suggesting reduced demand/limited access to contraception. Additional analyses to test a new slum variable (slum/intermediate/non-slum), based on a household’s availability of electricity, water and toilet, showed similar results to household wealth.
The second paper shows that couples had greater odds of using contraceptives if the wife desired fewer children, or both partners admitted to discussing desired number of children/FP recently. Among non-users, intention to use contraception in the near future showed similar associations.
Conclusion
Acknowledgments
I would first like to thank my faculty advisor and dissertation committee chair, Dr. Ilene Speizer. I am immensely grateful to her for her excellent mentorship and continued guidance over the past four years. She has helped me grow as a researcher in countless ways and supported me immensely. My experience in the doctoral program has been greatly enriched by having her as an advisor. I especially wish to thank her for her guidance and support in helping me complete this dissertation. I also wish to thank the other members of my dissertation committee – Drs. Sian Curtis, Jean Christophe Fotso, Kavita Singh Ongechi and Chirayath Suchindran – for their constant encouragement, thoughtful input, and prompt feedback. Their dedication to public health research is an inspiration to me.
I would also like to acknowledge the Carolina Population Center, the National Institute of Child Health and Development and the Bill & Melinda Gates Foundation for supporting me with funding. I am also grateful to all the men and women in Kenya who so generously shared their time and stories by participating in the household surveys used in this dissertation.
Finally, I would like to thank my family, friends and colleagues for their endless support during the course of my doctoral studies. No words can describe my gratitude towards my parents, Qudsiyeh and Rustom Roy. Their lifelong dedication and commitment to serving the people of East Africa, their love for knowledge, their dedication to ensure that my brother and I received the best education they could provide us with, their unconditional love and support, and their daily prayers for our well-beings and success are the primary reasons we have achieved so much. I would also like to thank my brother, Adib Roy, for his wisdom and encouragement and for bringing so much joy and laughter into my life. Lastly, I would like to thank the newest member of my family, my dear husband, Vafa Bayat. He has been a pillar of strength during this final stretch to completing my dissertation. His
Table of Contents
List of Tables ...x
List of Figures ...xii
List of Abbreviations ...xiii
Chapter 1: Introduction ...1
1.1 Statement of the problem ...1
1.1.1 Contraceptive use patterns among women ...2
1.1.2 Contraceptive use among couples ...4
1.2 The need for urban data in Africa ...8
1.3 Country setting ...10
1.4 Specific aims and hypotheses ...13
Chapter 2: Impacts of Neighborhood Type and Household Wealth on Contraceptive Use Patterns among Urban Women in Kenya ...17
2.1 Background ...17
2.1.1 Country context ...20
2.2 Methods ...21
2.2.1 Variables ...23
2.2.2 Analysis plan ...25
2.3 Results ...27
2.3.1 Characteristics of the women ...27
2.3.3 Reasons for switching ...32
2.4 Discussion ...34
2.4.1 Limitations ...38
2.4.2 Future research ...39
2.4.3 Programmatic implications ...39
2.4.4 Conclusion ...40
2.5 Tables and Figures ...41
Chapter 3: Impacts of Couple Characteristics on Contraceptive Use among Women and their Male Partners in Urban Kenya ...57
3.1 Background ...57
3.1.1 Social Ecological Theory...58
3.1.2 Country context ...62
3.2 Methods ...64
3.2.1 Variables ...65
3.2.2 Analysis plan ...67
3.3 Results ...68
3.3.1 Characteristics of women and their partners ...69
3.3.2 Characteristics of couples ...71
3.3.3 Multivariate findings ...72
3.4 Discussion ...74
3.4.1 Limitations ...76
3.4.3 Programmatic implications ...77
3.4.4 Conclusion ...78
3.5 Tables and Figures ...79
Chapter 4: Conclusion...87
Appendix A: Chapter 1 ...93
Appendix B: Chapter 2 ...95
Appendix C: Chapter 3 ...99
List of Tables
Table 2.1. Weighted distribution of background characteristics of urban women
in Kenya, by neighborhood type and household wealth ……….. ...41 Table 2.2. Percentage distribution of contraceptive use among all women and
current contraceptive users by neighborhood type and household wealth among urban women with knowledge of FP, aged 15-49 in
Kenya ...43 Table 2.3. Multinomial logistic regression coefficients for current contraceptive use
among women who are ever users in urban Kenya, n=5086……… ...44 Table 2.4. Multinomial logistic regression coefficients for current contraceptive
use among women who are current contraceptive users in urban
Kenya, n=2568. ...47 Table 2.5. Multinomial logistic regression coefficients for current contraceptive
use by slum residence among women who are ever users in urban
Kenya, n=5086... ...50 Table 2.6. Multinomial logistic regression coefficients for current contraceptive
use by slum residence among women who are current contraceptive
users in urban Kenya, n=2568……….. ...53 Table 2.7. Reasons for switching among current users who are urban women in
Kenya, in weighted percentages……… ...56 Table 3.1. Percentage distribution and comparison of sociodemographic
characteristics of married/cohabiting women and men using
percentage agreement and kappa statistics, in urban Kenya………… ...79 Table 3.2. Comparison of percentage distribution of sociodemographic
characteristics of married/cohabiting women and men, in urban Kenya,
n=840………. ...81 Table 3.3. Percentage distribution of characteristics of married couples, by
current contraceptive use………... ...82 Table 3.4. Odds ratios (and 95%confidence intervals) from logistic regression
analyses assessing the association between explanatory variables and
women’s reported current contraceptive use, n=840……… ...83 Table 3.5. Odds ratios (and 95%confidence intervals) from logistic regression
analyses assessing the association between explanatory variables and women’s reported intention to use contraception, among non-users
Table B.1: Contraceptive methods used to generate lessmore effective and
moreless effective methods………... ...95 Table B.2: Percentage distribution of switching categories, among current users,
n=1259……….. ...96 Table B.3: Reasons for discontinuation, by method
categories……….. ...98 Table C.1: Explanation of sample size selected for final analysis from Nairobi,
Mombasa and Kisumu……….. ...100 Table C.2: Percentage distribution of sociodemographic characteristics of all
married/cohabiting women and the subsample of interviewed women who were coupled with their male partners for this analysis, in urban
List of Figures
Figure 1.1. Map of Kenya………... ...10 Figure 2.1. Predicted probabilities of contraceptive use, by neighborhood type
and household wealth………... ...46 Figure 2.2. Predicted probabilities of current contraceptive use, by neighborhood
type and household wealth……… ...49 Figure 2.3. Predicted probabilities of contraceptive use, by slum residence…… ...52 Figure 2.4. Predicted probabilities of current contraceptive use, by slum residence...55 Figure A.1: Conceptual framework examining factors affecting impact of
environmental factors on women’s contraceptive use patterns……. ...93 Figure A.2: Conceptual framework examining factors that impact the effect of
relationship-level characteristics on contraceptive use patterns…… ...94 Figure B.1: Percentage distribution of new housing variables and corresponding
household characteristics that define the new variable, N=5,086
households.. ...97 Figure C.1: The impact of factors affecting couple’s contraceptive use, based on
List of Abbreviations
APHRC African Population and Health Research Center CBS Central Bureau of Statistics
CPR Contraceptive Prevalence Rate DHS Demographic and Health Survey
FP Family Planning
ICPD UN International Conference on Population and Development IIA Irrelevant Alternatives
IUD Intrauterine device
KEMRI Kenya Medical Research Institute LAM Lactational Amenorrhea Method MDG Millennium Development Goal MLE Measurement, Learning & Evaluation
PoA Program of Action
PSU Primary Sampling Unit TFR Total Fertility Rate
Chapter 1: Introduction
1.1 Statement of the problem
In the developing world, there are approximately 222 million women with an unmet need for family planning (FP), that is, these women are sexually active, want to delay or avoid childbearing but are not using contraception (Singh et al. 2009, Moreland et al. 2010, Carr et al. 2012). Unmet need for FP leads to unplanned and poorly timed pregnancies, which in turn end up as higher risk pregnancies resulting in increased maternal and child morbidity and mortality (Singh et al. 2009, USAID 2009). An increase in FP access and use will result in lower unmet need, thus helping achieve some of the Millennium Development Goals (MDG) to which nations have committed themselves, including improving maternal health overall (MDG 5), reducing child mortality (MDG 4), promoting better gender equality (MDG 3), reducing the spread of HIV/AIDS (MDG 6), achieving universal primary
education (MDG 2), ensuring environmental stability (MDG 7), and reducing extreme poverty and hunger (MDG 1) (Allen 2007, Potts and Fotso 2007, USAID 2009, Canning and Schultz 2012, Cleland et al. 2012).
From the late 1970s to the early 1990s, fertility rates declined rapidly in sub-Saharan Africa (SSA) (Kirk and Pillet 1998, Ezeh et al. 2009). In particular, the decline was dramatic in rural areas across Eastern and Southern African countries. This decline in fertility rates has largely been attributed to increased availability of contraception (Kirk and Pillet 1998, Ezeh
Countries and funding agencies shifted their commitment to other pressing health problems like HIV/AIDS. As a result of limited resources, the focus on FP programs was reduced (Kirk and Pillet 1998, Ezeh et al. 2009). Healthcare facilities also lacked the necessary resources to continue to provide much-needed FP services (Ezeh et al. 2009). As a result, 70 million women in this region have unintended pregnancies yearly, of which 45 million end in abortion that is often illegal (Glasier et al. 2006, Van Braeckel et al. 2012). Compared to other major regions of the world, fertility rates have remained among the highest in Sub-Saharan Africa. Admittedly, this is partly the result of a regional preference for more childbearing, but it is also a clear indication of a high unmet need (Westoff 2010). Recent estimates show that in several sub-Saharan African countries, the majority of contraceptive demand is unmet (Horton and Peterson 2012). Cleland suggests that maternal mortality would drop by 30%, if all the unmet need of the women in developing countries was met (Cleland et al. 2012). Therefore much more needs to be done, since among other problems, maternal morbidity and mortality remain high (Glasier et al. 2006, Friberg et al. 2010, Kinney et al. 2010). Healthcare services must be expanded if the Millennium Development Goals (MDGs) are to be reached in Sub-Saharan Africa (Friberg et al. 2010, Kinney et al.
2010).
1.1.1 Contraceptive use patterns among women
intervention-requiring methods such as IUDs and implants are lower (Curtis and Blanc 1997, Ali and Cleland 1999, Steele and Curtis 2003, UN Department of Economic and Social Affairs 2006, Bradley et al. 2009a, Ali and Cleland 2010). Some of the individual
characteristics of women known to be associated with contraceptive discontinuation include being under 25 years old, lower parity and poor personal health (Rosenberg et al. 1995, Bradley et al. 2009a). Studies of the effects of environmental factors, such as the quality of FP services, on contraceptive discontinuation are inconclusive; some studies have shown that improved quality of FP services increases contraceptive uptake while other studies have not shown any significant improvement in contraceptive use associated with improved quality (Koenig et al. 1997, Steele et al. 1999, Leon 2003, RamaRao et al. 2003, Halpern et al. 2006, Do and Koenig 2007). On the other hand, the impacts of environmental factors, such as neighborhood types (formal/informal housing depending on whether the home is built on land allocated/not allocated for housing by the government) and household wealth, on contraceptive discontinuation have not been investigated.
Analysis of national-level data from various countries on discontinuation have shown that a fair proportion of women who discontinue contraceptive use eventually switch
simply indicate the availability of multiple contraceptive methods in that particular setting (Jain 1989, Ping and Smith 1995, Steele and Diamond 1999, Blanc et al. 2002, Barden-O'Fallon and Speizer 2011). Furthermore, when comparing place of residence, a community-level characteristic, studies have shown that urban women were more likely to switch methods than stop completely as compared to rural women (Curtis and Blanc 1997, UN Department of Economic and Social Affairs 2006, Barden-O'Fallon and Speizer 2011). However, the impact of multiple environmental factors, such as neighborhood types and household wealth, on contraceptive switching patterns remain unknown. Hence, more information is needed on the impact of environmental factors on contraceptive
discontinuation and switching among women. With the help of a carefully defined study, we have investigated the impact of environmental factors on women’s contraceptive use
patterns, i.e., discontinuation and switching to a different method. Appendix 1.I displays the conceptual framework of the impact of environmental factors, i.e., neighborhood types and household wealth, on women’s contraceptive use patterns. Several individual characteristics identified in the literature are included in this framework as control variables. Our hypothesis is that after controlling for individual characteristics and city of residence, women living in poor households or in informal settlements are less likely to be current contraceptive users or switch contraceptive methods than rich women or those living in formal housing.
1.1.2 Contraceptive use among couples
has generally compared the discordance of partners’ reported current contraceptive use, i.e., partners report different use. For instance, in a study of 23 countries using DHS couples’ data, husbands reported higher contraceptive use than their wives, ranging from 2% more in Brazil to 150% more in Mali (Becker and Costenbader 2001). Another more recent study of data from six Sub-Saharan African (SSA) countries found agreement on contraceptive use to be only between 47 and 82% of couples, with husbands generally reporting higher levels of condom use, abstinence and pills and lower levels of IUD, injection and female sterilization (Becker et al. 2006). Lastly, in a couple study using Bangladesh DHS data, discordance in reporting condom use was 46%, of which about 32% could be explained by husbands reporting condom use when wives did not and 14% by wives reporting condom use when husbands did not (Islam et al. 2010). Notably, in the sub-Saharan African context, one explanation for inconsistent reporting could be the existence of multiple sexual partners such that individuals are potentially using different contraceptive methods with each partner (Becker and Costenbader 2001, Islam et al. 2010).
In an attempt to better understand factors affecting contraceptive use, few studies have tried to identify the impact of the couple’s individual characteristics on contraceptive use. The educational level of both partners is one of the individual characteristics of couples that have been investigated; the findings of which have been mixed. For example, a study conducted in Nepal showed that a couple was more likely to use contraception if the husband was more educated; the wife’s education did not have any effect on contraceptive use
ages have been shown to have an effect on FP use. Two Ghanaian studies showed that contraceptive use was higher among couples where there was a smaller age difference between spouses and the partners adhered to different religions (such as, Christian and Muslim) (Oheneba-Sakyi and Takyi 1997, Gyimah et al. 2008).
Besides individual-level characteristics, investigations of relationship-level
their partners’ contraceptive preferences have an impact on contraceptive decision-making and pregnancy postponement. In order to compare the actual responses of both partners, couple-level data is needed.
The few studies that have asked men directly why they disapprove of contraception found that it is because of their preference for more children, particularly boys, with the hope that they can rely on them in old age (Isiugo-Abanihe 1994, Kamau et al. 1996, Bankole and Singh 1998, Odu et al. 2006, Okwor and Olaseha 2009, Wambui et al. 2009). Men who disapprove of contraception also desire shorter birth intervals than their wives, as
exemplified by a review of studies from 28 countries and a recent analysis of DHS data using matched cohabiting couples from 10 countries in SSA (Bankole and Singh 1998, Wambui et al. 2009, Gebreselassie and Mishra 2011). These studies based primarily in Nigeria and in some rural communities of western Kenya found that men often disapprove of contraceptive use because of a fear of side-effects, a conflict with their religious beliefs and a perception that contraceptive use may hide infidelity.
Ogunjuyigbe et al. 2009, Yue et al. 2010, Link 2011). In light of the above contradictory findings, more research is needed to identify the effect of various relationship-level characteristics on couples’ decisions to use contraception.
When determining the impact of environmental factors on contraceptive use, our review of the literature shows that among studies using national-level data of women, household wealth has an impact on contraceptive use, i.e., women living in poor households are less likely to use contraception compared to women living in rich households (Creanga et al. 2011). The influence of environmental factors on couples’ use remains unknown.
Furthermore, the effect of other environmental factors, such as neighborhood type, has yet to be investigated. Hence, this study looks at the potential effect of relationship-level
characteristics on couples’ contraceptive use after controlling for individual partner’s characteristics and environmental factors, as shown in Appendix 1.II. Our hypothesis is that after controlling for individual and environmental factors, couples living in poor households or in informal settlements are less likely to be using contraception than couples living in rich homes or formal housing.
1.2 The need for urban data in Africa
1.3 Country setting
Kenya has had a robust family planning program since the 1950s. Between the late 1970s and late 1990s, the fertility rate in Kenya declined from 8.1 to 4.7 (Bongaarts 2006, Speizer 2006, Kenya National Bureau of Statistics (KNBS) and ICF Macro 2010). Part of this decline was due to an increased use of modern contraception arising from improved education of girls, economic development, and the government’s active promotion of FP through health services (Blacker et al. 2005, Omariba 2006). The
fertility rate was expected to continue to decline in the 21st century, but it failed to do so, primarily due to a reduced political commitment at the national and international levels, resulting in reduced spending on media campaigns and FP programs (Kirk and Pillet 1998, Ikamari 2000, Cleland et al. 2006, Speizer 2006, Crichton 2008). Consequently, FP
programs failed to meet the contraceptive needs of Kenyan couples and the 2003 Kenya Demographic and Health Survey (DHS) showed deteriorating indicators (Ikamari 2000, Crichton 2008). In response to strong FP advocacy, the Kenyan government has again prioritized family planning, and the environment is now optimal for renewed FP programs (Crichton 2008). As a result, after over a decade of stagnant indicators, the rate of overall contraceptive prevalence rate rose from 39% in 2003 to 46% in 2008-2009 (Kenya National
Map of Kenya
Bureau of Statistics (KNBS) and ICF Macro 2010). The hope is that with increased funding support from international donors as well as greater political commitment to address the population’s FP needs, contraceptive uptake will increase to address the unmet need of the population (Bill & Melinda Gates Foundation 2012).
In Kenya, 51.1% of all sexually active women aged 15-49 are using contraceptives; while 44.6% are using modern contraceptive methods (Kenya National Bureau of Statistics (KNBS) and ICF Macro 2010). The most commonly used methods are injectables (24.0%) and pills (8.3%). This is followed by any traditional method (6.5%) and female sterilization (4.8%). Male condom use only accounts for 3.4%. The distribution of contraceptive use and method mix varies greatly between regions. Despite this prevalence of use, 25.7% of married women have an unmet need for contraception; 12.9% for spacing purposes and 12.8% for limiting. Further, of urban women aged 15-49, one-fifth (20.2%) have an unmet need for contraception; about half for spacing (10.7%) childbearing and the other half for limiting (9.5%) (Kenya National Bureau of Statistics (KNBS) and ICF Macro 2010). Discontinuation of contraceptive methods is one of the factors contributing to unwanted pregnancies (Bradley et al. 2009b). Recent data from Kenya suggest that 36% of all women who begin using a contraceptive method discontinue within twelve months (Kenya National Bureau of Statistics (KNBS) and ICF Macro 2010). A good proportion of these women resume contraceptive use by switching to a different method; the methods they switch to and the reasons for switching remain unclear.
Hence, informal settlements and urban slums have sprung up all across African cities (Cohen 2004). According to the 2009 census, Kenya had a population of 38.6 million people,
growing at 2.5% per year (Kenya National Bureau of Statistics (KNBS) 2010, Central
Intelligence Agency (CIA) 2011). The total urban population is 32.2%, with an annual rate of urbanization of 4.2%. A startling phenomenon however is that the urban poor population is growing exponentially, doubling for instance in Nairobi, Kenya in just five years, from 1992-1997 (Central Bureau of Statistics (CBS) Ministry of Planning and National Development 2000). As a result, a large proportion of the city’s population lives in slums covering only 5% of the land area (Matrix Development Consultants 1993).
further help FP programs address these challenges in a culturally appropriate manner and bring services to the populations most in need (Robey et al. 1996, Foreit and Futures Group 2011).
1.4 Specific aims and hypotheses
This dissertation uses baseline population-level data collected for the Measurement, Learning & Evaluation Project across three cities of Kenya, namely, Nairobi, Mombasa and Kisumu. It applies bivariate and multivariate analyses to determine the impacts of
neighborhood types (informal/formal) and household wealth (poor/intermediate/rich) on contraceptive use patterns among Kenya’s urban women. Furthermore, it outlines the effect of couple characteristics, such as fertility desires and communication, on contraceptive use and intention to use among urban couples in Kenya. This dissertation conducts two studies to test the specific aims and hypotheses.
The specific aims of the first study are as follows:
Overall Aim 1. To estimate the association of neighborhood type and household wealth
on contraceptive use patterns among women in urban Kenya
Aim 1.1. Among all women, to estimate the association of neighborhood type and household wealth on women’s contraceptive use patterns, i.e., current, former, and never users.
Hypothesis 1.1.2. Women from poor and intermediate wealth households are more likely to be never users than current/former users as compared to rich women.
Aim 1.2. Among current users, to estimate the association of neighborhood type and household wealth on women’s use patterns, i.e., using first method, switched from a less effective to a more effective method, and switched from a more effective to a less effective method.
Hypothesis 1.2.1. Women living in informal housing are more likely to be using their first method than to have switched methods as compared to women living in formal housing.
Hypothesis 1.2.2. Women from poor and intermediate wealth households are more likely to be using their first method than to have switched methods as compared to rich women.
Aim 1.3. To examine the reasons women give for switching methods, by neighborhood type and household wealth.
Hypothesis 1.3.1. Women living in informal housing or poor and intermediate neighborhood are more likely to state cost- and access-related reasons as well as opposition to use as reasons for switching.
Overall Aim 2. To estimate the association of couple/relationship-level characteristics
on current contraceptive use among women and their married/cohabiting male
partners in urban Kenya.
Aim 2.1. To determine the association of couple characteristics on current contraceptive use among couples.
Hypothesis 2.1.1. Couples who have a desire for a smaller ideal family size are more likely to use contraceptives than couples with a desire for a larger family size.
Hypothesis. 2.1.2. Couples where both partners report communicating with each other about the desired number of children are more likely to use contraceptives than couples who do not communicate with each other.
Hypothesis. 2.1.3. Couples where both partners report communicating with each other about family planning use are more likely to use contraceptives than couples who do not report communicating with each other.
Aim 2.2. To determine the association of couple characteristics with intention to use contraception among couples currently not using family planning.
Hypothesis 2.2.1. Among non-users, couples who have a desire for a smaller ideal family size are more likely to intend to use contraceptives than couples with a desire for a larger family size.
Chapter 2: Impacts of Neighborhood Type and Household
Wealth on Contraceptive Use Patterns among Urban Women in
Kenya
2.1 Background
and unintended pregnancies is essential to reducing the number of mistimed and unwanted pregnancies in SSA.
Notably, 7-20% of discontinuation occurs due to a reduced need for FP arising from a desire to become pregnant, infertility, or loss of a partner from divorce, separation, or death (Blanc et al. 2002). However, other reasons for discontinuation include side-effects and health concerns (Ali and Cleland 1995, Rosenberg et al. 1995, Khan 2003). Some of the sociodemographic factors associated with higher contraceptive discontinuation rates include lower parity and younger age (under 25) (Bradley et al. 2009a). Other factors include multiple sexual partners, poor personal health and histories of previous abortion (Rosenberg et al. 1995). In contrast, there have been mixed results on the relationships between some environmental/service delivery factors, such as FP services quality and contraceptive discontinuation; for example, some studies have shown that high quality services are associated with less discontinuation while others have shown no significant effect between the two (Do and Koenig 2007, Leite and Gupta 2007). Discontinuation has also been found to be associated with distance from health facilities, while contact with FP outreach workers in other settings has not yielded declines in discontinuation (Koenig et al. 1997, Steele et al.
al. 2009a). More research is therefore critical for assessing and reducing families’ unmet needs, as well as determining the impact of environmental factors on contraceptive uptake in varying contexts.
In light of the above findings, in this analysis, we sought to determine the impact of environmental factors, i.e., neighborhood type (informal/formal settlements) and household wealth (possession of assets) on contraceptive use. Analysis of Demographic and Health Survey (DHS) data from three SSA countries showed that wealth is confounded by place of residence; hence, the report recommended that the effects of wealth and place of residence need to be investigated separately (Foreit and Group 2011). With the aid of a carefully designed survey, we thus compared contraceptive usage between urban residents living in informal settlements vs. those living in formal housing, and the poorest vs. richest urban populations, and have been able to provide new insights. Since discontinuation due to method failure is already well studied (Curtis and Blanc 1997), we focused on the impact of poverty on discontinuation due to abandonment or switching, taking into account individual and behavioral characteristics. Furthermore, we elucidate fertility and non-fertility-related reasons for switching to the most recent contraceptive method.
2.1.1 Country context
2010). Approximately 20.2% of currently married urban Kenyan women aged 15-49 have an unmet need for contraception, with just over half desiring spacing and the remainder desiring limiting (KNBS and Macro 2010). Recent data suggest that 36% of all Kenyan women initiating a contraceptive method discontinue within twelve months (KNBS and Macro 2010). The proportion of women who switch to other methods, the new methods they adopt and the reasons for switching remain poorly studied.
Almost one-third of Kenyans live in urban areas with an annual rate of urbanization of 4.2% (KNBS and Macro 2010, CIA 2011). A growing number of urban dwellers live in informal settlements referred to as slums, where space is limited resulting in cramped housing and living quarters (Matrix Development Consultants 1993). In addition, slum dwellers have less access to healthcare services than residents of rural areas (Gould 1998, APHRC and Bank 2006, Fotso 2007, Fotso et al. 2008). As a result, a quarter to a third of the poorest women cannot access family planning and have an unmet need for family planning (Habumuremyi and Zenawi 2012). Providing adequate FP services to the urban poor would help address their unmet need and improve their overall quality of life (Fotso et al. 2009). Couples living in slums have greater need for FP than the urban average despite living in cities with available services (Fotso et al. 2008). Hence, with the aid of a carefully designed survey, we set out to determine the impact of poverty on contraceptive use and switching patterns in urban Kenya.
2.2 Methods
& Evaluation (MLE) Project. The MLE Project is designed to evaluate interventions that increase contraceptive prevalence among urban populations, particularly the urban poor, in Kenya, Nigeria, Senegal and Uttar Pradesh, India. The Urban Reproductive Health Initiative (URHI), funded by the Bill & Melinda Gates Foundation, is the intervention arm evaluated by the MLE project. Tupange, meaning “let’s plan” in Kiswahili, is the 5-year URHI implementation project designed to assist the Kenyan government to reestablish urban FP programs.
The MLE Project uses a quasi-experimental design and multiple data collection approaches, such as population-based surveys of men and women along with facility-level data. In Kenya, baseline population-based surveys were conducted from September through November 2010 across the cities of Nairobi, Mombasa, Kisumu, Machakos and Kakamega. Data from the latter two cities were dropped from this analysis because their Primary Sampling Units (PSUs) had not been classified into formal and informal areas, a primary independent variable. Before conducting the surveys, the 2009 census sampling frames were collected from the Kenyan government. The census sampling frames for Nairobi, Mombasa and Kisumu were used to classify all PSUs as predominantly formal or informal; all
sociodemographic characteristics, reproductive health history, and FP use. Household questionnaires were also administered to a member of each household; these provided information on the household assets used to create the wealth index.
A total of 5,774 women were interviewed in the three study cities. From this sample, 596 were excluded as they had never been sexually active. Another 90 women were dropped as they lacked knowledge of any FP method and did not answer questions related to FP. Lastly, 2 women were dropped as they were missing data on household wealth, a key
variable of interest. Ultimately, 5086 women were included. Population weights were applied to the sample which produced an adequate representation of 4968 women across the three included cities.
2.2.1 Variables
The primary outcome of interest, as reported by the woman, related to the use of any modern/traditional contraceptives, divided into three categories: current users of any modern or traditional method, former users of any modern or traditional method and never users. Current users were further categorized into first method users, those who had switched from the last/previous less effective method to a current more effective method and those who had switched from the last/previous more effective method to a current less effective method. These switching patterns are shown in Appendix 2.I. Switching from a less to a more effective method included switching from a traditional method (such as standard days
method, withdrawal) to a modern method (such as spermicide, condom, pill, injectable, IUD, implant, sterilization); any method to sterilization; a barrier method or Lactational
switching from a more to a less effective method included changing from a modern to a traditional method; hormonal to a barrier; implants to pills or injectables or IUD; IUD to pills or injectables; and injectables to pills (Bradley et al. 2009a).
In addition to the above categories, current and former contraceptive method users were categorized into users of traditional, short-term and long-term methods; traditional methods included natural methods (such as standard days, withdrawal) and LAM; short-term methods included female/male condoms, daily pills, emergency pills and injectables, and; the long-term methods comprised of the IUD, implant and female/male sterilization.
The primary independent variables of interest were neighborhood type and household wealth, with neighborhood type capturing place-based poverty and household wealth being an indicator of asset-based poverty (Rutstein and Johnson 2004). Based on census data from the Kenya National Bureau of Statistics, the neighborhood type was defined as informal or formal housing. All households in a PSU were classified as informal if built on land unallocated for housing (unzoned) and formal if built on land allocated for housing.
Household wealth was created by constructing a linear index from asset ownership indicators using principal components analysis of data from the household questionnaire (Filmer and Pritchett 2001). We used 21 household assets1 to generate the wealth index variable for the three cities combined. Using this index, the households were divided into tertiles with one-third of the population in each tertile to create three categories: poor (lowest wealth tertile), intermediate (middle wealth tertile) and rich (highest wealth tertile).
1
A third indicator of poverty was generated based on three household amenities (electricity, water supply and toilets). This variable was previously developed to study the impact of slum residence on sexual behavior in urban African cities (Zulu et al. 2002, Dodoo
et al. 2007, Greif et al. 2011). In Zulu and others’ original analyses, a household was defined as a “slum” if it lacked electricity, water supply and toilets, “intermediate” if it had one/two of the amenities and a “non-slum” if it had all three. In our analysis, we modified Zulu’s categories slightly because the slum populations have grown since the 1998 original analyses and most households lacked access to all three amenities. Hence in our analysis, we defined a household as being a slum residence if it lacked electricity, piped water supply and indoor toilets; intermediate if it had one of the amenities, and non-slum if it had two or three amenities (Zulu et al. 2002).
Other independent variables of interest were also included in the analysis as control variables. As described in Table 2.1, these included the city of residence, the woman’s age (divided into 5-year categories), marital status, religion, education levels, the number of living children (0, 1, 2, or 3+), employment in the prior 12 months for cash, migration to the city and whether she had heard FP radio messages in the prior 12 months.
2.2.2 Analysis plan
Bivariate and descriptive analyses were conducted to determine the effects of
determine the association between neighborhood type and household wealth and women’s contraceptive use patterns (Cameron and Trivedi 2005, Hamilton 2009). An assumption specific to the multinomial logistic regression model is the independence of irrelevant alternatives (IIA). According to the IIA assumption, the odds of a participant selecting one outcome versus another to the dependent variable, i.e., contraceptive use patterns, is independent of any other irrelevant factor. In other words, the IIA assumption implies that adding another category to the dependent variables of interest does not affect the relative odds between the two/more categories considered by each participant. We tested both our models using the Hausman test, the Likelihood Ratio (LR) test developed by Small and Hsiao, and the K Wald test in Stata (Hausman and McFadden 1984, Small and Hasiao 1985, Freese and Long 2000). Both our models held the IIA assumption for all three tests. In addition, bivariate analyses were performed to determine the differences in reasons for switching among women from different types of neighborhoods and household wealth. We then repeated the multivariate analyses to test the new indicator of poverty based on slum residence classified as slum, intermediate and non-slum
2.3 Results
After city-level population weights were applied, 4968 women aged 15-49 represented the urban women from the three cities with a history of at least one sexual encounter and knowledge of at least one contraceptive method.
2.3.1 Characteristics of the women
As noted in Table 2.1, over three-quarters (79%) of the study sample lived in formal settlements while the rest lived in informal settlements. An overwhelming majority (90%) of rich people (highest wealth tertile) lived in formal settlements. On the other hand, 66% of poor people (lowest wealth tertile) lived in formal housing. Interestingly, of the informal city dwellers, 60% were poor, 21% lived in intermediate wealth housing and the remaining 19% were rich. Three-quarters of the population lived in Nairobi, 19% lived in Mombasa and the remaining 6% lived in Kisumu. Among informal housing dwellers, 75% were from Nairobi, 7% from Mombasa and 18% from Kisumu. Three-quarters of women living in formal housing were in Nairobi, 22% in Mombasa and only 2% in Kisumu.
had completed secondary education. A quarter of the poor women had not completed primary school compared to only 9% of the rich. On the other hand, one-third (36%) of poor women had received at least some secondary education in contrast to almost three-quarters (75%) of rich women. Table 2.1 also shows the distribution of women’s parity; one-fifth of women (22%) had no children, with more of the rich having none (29% of all rich women) compared to the poor (18% of all poor women). Almost one-third (31%) of the women had one child while another 23% had two children. Larger percentages (29%) of poor women had three or more children compared to the rich (21%). Two-thirds of the women were employed for cash in the last 12 months. A higher percentage of the rich women were employed for cash
compared to the poor (72% vs. 59%). About 14% of the population had migrated from a rural area to the three cities within the last 10 years while 86% had lived in urban areas for over 10 years. Furthermore, 60% of the women had heard a FP message on the radio in the past 12 months, with a higher percentage (63%) of the rich women having done so than the poor women (55%). In summary, the poor urban women generally had more children, were less likely to be employed, and had heard fewer FP messages recently. These data, taken together, indicate that when distinctions were observed, they were more often by the wealth groups than by the neighborhood type.
2.3.2 Multivariate analyses
We next used multinomial logistic regression to assess the association between neighborhood type (informal/formal) and household wealth (poor/intermediate/rich) on contraceptive use, adjusting for clustering at the PSU level. As presented in Table 2.3, we ran two multinomial logistic regression models to determine the impact of poverty on current contraceptive use: Model 1 includes neighborhood type and household wealth controlling for city of residence while Model 2 included additional controls for age, marital status, religion, education, number of living children, employment in the prior 12 months, rural-urban migration and hearing of FP messages on the radio in the prior 12 months. No significant association was found between neighborhood type and being a current, former or never user. Conversely, across both models, poor women were significantly less likely to be current users or former users than never users as compared to rich women. They were also less likely to be current users than former users. Hence, poor women were less likely to have ever used contraception than rich women. Based on these findings, we calculated the predicted
probability of current contraceptive use for the woman with the most common characteristics within the population. We used the regression outputs from Model 2 to compare
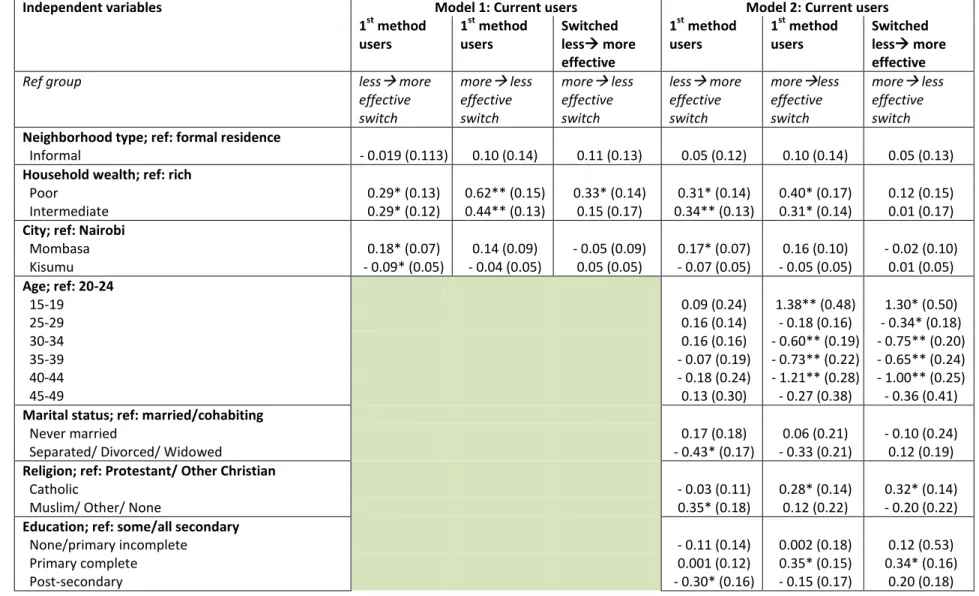
We next shifted our attention to the association between neighborhood type and household wealth on switching methods among current contraceptive users. Table 2.4 presents multinomial logistic regression outputs which show no significant difference between neighborhood type and being a first method user or method-switcher. Among current contraceptive users, the women from poor and intermediate wealth households were more likely to be first method users than to have switched from a more to a less effective or from a less to a more effective method compared to the rich. We further compared the predicted probability of switching methods among current contraceptive users in relation to neighborhood type and household wealth, using Model 2. As shown in Figure 2.2, keeping all other characteristics constant, the probability of using the first method or switching didn’t vary much across neighborhood types; current contraceptive users in informal housing had a 43% chance of currently using their first method as compared to a slightly lower predicted probability of 41% among formal housing dwellers. Across wealth tertiles, 50% of the poor were using their first method, less so in intermediate (49%) and rich (41%) households. On the other hand, the predicted probability of switching methods was higher among wealthier women. For example, the probability of switching from a less to a more effective method among the poor women was 34% while it was 39% among the rich. Here, again, we see bigger differences when comparing wealth categories than formal vs. informal housing.
two household amenities and are defined as non-slum housing (as shown in Appendix 2.III). Table 2.5 presents the multinomial logistic regression coefficients for the analysis of housing type on women’s current contraceptive use. Across both models, slum dwellers were less likely to be current or former users than never users as compared to women from non-slum housing. They were also less likely to be former users than never users as compared to women living in non-slum housing. Based on these findings, we calculated the predicted probability of current contraceptive use across slum residences. Women living in slum households have a lower (62%) probability of being current users than non-slum dwellers (67%). On the other hand, slum dwellers have a higher probability of being former/never users compared to rich women.
Next, we tested the effect of housing type on current contraceptive use patterns among current users. As shown in Table 2.6, both models show that slum dwellers are more likely to be using their first method than to have switched methods, i.e., from a less to a more effective or from a more to a less effective method. Based on predicted probabilities, as shown in Figure 2.4, we see that slum and intermediate slum dwellers are more likely to be using their first method than non-slum dwellers.
2.3.3 Reasons for switching
Current contraceptive users who had used a different method prior to the current method were asked the reasons they had switched, characterized as fertility-, method-, cost- and access-related, partner opposition, recommendations by others and other reasons.
Fertility-related reasons were: method failed/got pregnant, lack of sexual urge, infrequent/no sex (such as, due to loss of partner/divorce/separation), more frequent sex, stopped
problem, created health problem, inconvenient to use, gained weight, lost weight, disliked method, wanted a more effective method, wanted to try the method, or experienced a lack of privacy. Women were assigned to the category “other reasons” if they did not give an
explanation or stated other reasons such as hearing on the radio about the new method. Some women gave multiple reasons. As shown in Table 2.7, of the 733 current users who had switched from a less to a more effective method, 15% cited fertility-related reasons for switching and 85% gave method-related reasons; 3% cited cost- and access-related issues, 6% said that their partners opposed the previously used method, another 5% were advised to switch to the current method by others and 18% cited other reasons. When comparing neighborhood types, women living in formal settlements who had switched from a previous less effective to a current more effective method were more likely to cite fertility-related reasons for switching compared to women from informal housing (8% versus 17%). Across household wealth, method-related reasons and partner opposition were more often cited by women living in poor and intermediate housing than rich women. Furthermore, they were less likely to cite recommendations from others than rich women. Among the other group of 466 women who switched from a more to a less effective method, 13% cited fertility-related reasons, 87% gave method-related reasons, and 4% cited partner opposition. Across
neighborhood types, 1% of informal dwellers cited partner opposition as a reason for switching compared to 4% of formal housing dwellers. When comparing reasons for
have switched from a less effective traditional method to a more effective short-term method due to fertility-related reasons, such as the presence of a partner. On the other hand, current users were more likely to switch from a short-term to a long-term method if recommended by others, as compared to other switching patterns. When comparing the switching patterns of women who had switched from a more to a less effective method, we see that current users were more likely to switch from a short-term to a traditional method due to fertility-related reasons, such as the partner’s absence. They also switched from a long-term to a short-term method if recommended by others, such as from their family members and
friends. Hence, we note that current users switched contraceptive methods for many reasons.
2.4 Discussion
In this study, we focused on determining the impact of poverty on contraceptive use among the under-studied population of urban women in three Kenyan cities. We used two separate indicators of poverty, place-based poverty denoted by neighborhood type
(informal/formal) and asset-based poverty categorized by household wealth
(poor/intermediate/rich). Previously, using wealth indices derived from household assets, investigators analyzed national-level DHS data from 55 countries and found that modern contraceptive use has increased in the developing world while uptake among the poor
remains low (Clements and Madise 2004, Gakidou and Vayena 2007, Gillespie 2007, Ezeh et al. 2009). Our research focused on ascertaining whether the urban poor are less likely to use contraception than the urban rich by determining the separate effects of household wealth and neighborhood type as indicators of poverty on contraceptive use. In addition, we
by Zulu and colleagues on contraceptive use patterns among urban Kenyan women. We used two indicators to measure contraceptive use among women, one indicator including all women categorized as current/former/never users and another indicator specific to current contraceptive users who were further classified as using their first method, those who had switched from a less to a more effective method and vice versa. Finally, our study
interviewed a large representative sample of women across three Kenyan major urban centers.
Bivariate analyses revealed that women from rich households were older, more educated, employed and listened to FP messages on the radio more frequently than poorer women. Furthermore, the rich were more likely to be current users than the poor (52% vs. 44%). Among current users, rich women were more likely to have switched contraceptive methods when compared to women from poor and intermediate wealth households. The association between FP use and wealth groups remained the same after controlling for the above-mentioned characteristics, such as city, age, and education. Therefore, our analysis shows that rich women are more likely to use contraception and switch methods. These findings support our hypothesis that rich women may be more motivated and empowered to seek FP. They may also have more support from their partners and family members to space and limit the number of children they have. Furthermore, they may be aware of more
quality of services accessed remain unknown. In conclusion, we note that household wealth has an impact on contraceptive use patterns among urban Kenyan women.
The results show that after controlling for household wealth and other variables, contraceptive use, in terms of current/former/never use, did not vary by neighborhood type. Among current contraceptive users, there was also no significant difference in switching patterns from the previous method when comparing women living in informal vs. formal neighborhoods. This may be due to the fact that women living in informal neighborhoods may be accessing FP services located nearby, even though previous findings suggest that the quality of these services are poor (Ezeh et al. 2010). Furthermore, women can use public transportation to get around the city as well and hence access healthcare facilities located far away. In summary, household wealth has a significant impact on contraceptive use patterns while neighborhood type, within an urban setting, does not.
We then generated a slum variable based on the three important household assets of electricity, piped water and an indoor toilet. This slum variable was first created a decade ago to test the impact of slum residence on sexual behavior within the urban Kenyan context (Zulu et al. 2002). In our study, a household was designated a slum if it had none of the three household amenities, an intermediate area if it had one of the household amenities and a non-slum if it had two or three. Controlling for other control variables, we found that women living in non-slums are more likely to be current users than women living in slums.
our analysis shows that the slum variable is an indicator of household wealth (poor/intermediate/rich) and not the neighborhood type, i.e., informal versus formal settlement.
perspective of comparisons by neighborhood type and household wealth. Furthermore, we have distinguished women’s switching patterns by the methods’ effectiveness. Interestingly, household wealth seems to have a more significant effect on contraceptive use patterns than neighborhood type.
2.4.1 Limitations
An important limitation of this study is that we cannot determine causality as we are using cross-sectional data. Furthermore, since the analysis involves recollection of the
previous contraceptive methods, there is a possibility of recall bias. It is also possible that the primary variables of interest of household wealth and neighborhood type are endogenous with contraceptive use, i.e., there are other factors that affect wealth, neighborhood and contraceptive use that cannot be accounted for, such as the demand for FP (noted as personal motivation and the influence of other family members and healthcare providers on
2.4.2 Future research
Further research is needed to identify other community-level factors affecting contraceptive use among urban women, such as FP service accessibility, direct and indirect costs, as well as quality of services received. A qualitative study will help bring to light other individual- and community-level factors affecting contraceptive use and the reasons women give for discontinuing and switching methods.
2.4.3 Programmatic implications
FP programs need to target the urban poor in order to increase contraceptive use among this most vulnerable population. Recent evaluations of FP interventions in other settings have shown that the urban poor do not use FP services even though they live in close proximity to them (Hennink and Clements 2005, Kumar et al. 2010), so FP interventions need to reach out to the urban poor women, living in formal and informal settlements. Local leaders and outreach health workers can be empowered to identify the urban poor (DFID 2001). Even though the urban poor are scattered across the city, the majority of the poor live in informal settlements and small clusters within formal settlements; focusing on these geographic areas will help to identify the largest numbers of urban poor women. Local outreach workers can give them adequate information on the benefits of FP, answer any concerns the women may have in using FP, and inform and educate them on available FP methods and the locations of good quality services. High quality services that include a wide range of contraceptive methods can further be made available to the poor at an accessible location and cost through voucher programs specifically targeting the poor (UHI 2010). Subsidizing social services, such as healthcare, can provide the poorest citizens with
women continue using a method of their choice best suited to their needs. Improving the quality of services and training staff will ensure that women receive the attention they need to prevent unwanted pregnancies. Further, women identified at postpartum visits and their children’s under-5 follow-up visits can be counseled on the availability of existing services. In this manner, the desired contraceptive needs of women with the greatest need for FP, particularly urban poor women, can be met.
2.4.4 Conclusion
2.5 Tables and Figures
Table 2.1: Weighted distribution of background characteristics of urban women in Kenya, by neighborhood type and household wealth
Characteristics Total Neighborhood type Household wealth Informal Formal Poor Interm. Rich
(n=4968) (n=1056) (n=3912) (n=1575) (n=1633) (n=1761)
Neighborhood type **
Formal 78.7 65.5 77.2 92.0
Informal 21.3 34.5 22.8 8.0
Household wealth (3-city tertiles)
**
Poor 31.7 51.4 26.4
Intermediate 32.9 35.2 32.2
Rich 35.4 13.4 41.4
City **
Nairobi 75.3 74.6 75.5 70.7 79.8 77.1
Mombasa 19.2 7.4 22.3 21.9 16.1 18.3
Kisumu 5.5 18.0 2.2 7.4 4.0 4.6
Age * **
15-19 6.6 8.8 6.0 8.5 5.7 5.4
20-24 27.2 29.9 26.4 31.1 31.5 21.4
25-29 26.5 26.4 26.6 26.7 25.5 26.7
30-34 16.5 14.5 17.0 14.0 16.4 18.6
35-39 11.7 11.3 11.8 9.1 13.2 13.3
40-44 7.1 6.0 7.5 7.2 3.9 9.0
45-49 4.4 3.2 4.7 3.4 3.8 5.6
Marital status ** **
Never married 24.4 18.7 26.0 21.4 17.4 33.6
Married/ Cohabiting 63.7 68.6 62.3 62.3 72.2 57.5
Separated/ Divorced/ Widowed 11.9 12.8 11.7 16.3 10.4 8.9
Religion **
Catholic 23.8 27.3 22.8 24.2 26.1 22.3
Protestant/ Other Christian 65.2 67.5 64.6 63.2 66.0 66.6
Muslim/ Other/ None 11.0 5.2 12.6 12.6 7.9 11.1
Education ** **
None/ Primary incomplete 17.0 19.4 16.4 26.3 17.3 8.8
Primary complete 27.0 35.4 24.8 37.5 30.5 16.1
Secondary: some/complete 38.4 36.3 38.9 30.5 46.5 41.4
Post-secondary 17.6 8.9 19.9 5.7 5.7 33.7
Number of living children † **
0 21.6 18.5 22.4 17.5 13.7 28.8
1 30.9 30.4 31.0 30.5 36.0 28.7
2 22.6 22.9 22.5 23.0 25.3 21.1
3+ 24.9 28.2 24.1 29.0 25.0 21.4
Employed for cash, in the last 12
months † **
Yes 64.2 60.5 65.2 58.8 57.5 72.0
Migration to city † *
Migrated in the past 11 months 5.8 4.9 6.0 6.9 4.1 5.7
Migrated in the past 1-10 years 8.1 9.9 7.7 10.2 6.9 6.9
Lived in city for >10 years 86.1 85.2 86.3 82.9 89.0 87.4
Heard FP message on radio in
the past 12 months *
Yes 60.0 58.4 60.4 55.0 61.5 63.2
No 40.0 41.6 39.6 45.0 38.5 36.8
Table 2.2: Percentage distribution of contraceptive use among all women and current contraceptive users by neighborhood type and household wealth among urban women with knowledge of FP, aged 15-49 in Kenya
Contraceptive use Total Neighborhood type Household wealth
Informal Formal Poor Interm. Rich All women (n=4968) (n=1056) (n=3912) (n=1575) (n=1633) (n=1761)
Current users 52.0 52.8 51.7 44.0** 59.1 52.4
Former users 31.6 33.0 31.3 35.5 26.9 32.7
Never users 16.4 14.1 17.0 20.5 14.0 14.9
Current users (n=2582) (n=557) (n=2024) (n=693) (n=965) (n=924)
First method 53.6 54.7 53.3 58.4* 57.3 46.0
Switched from less more effective 28.4 30.4 27.9 26.0 26.1 32.6
Switched from more less effective 18.0 14.9 18.8 15.6 16.6 21.4
Among current users, current method
mix ** **
(n=558) (n=2024) (n=693) (n=965) (n=924)
Long-term permanent 13.7 11.2 14.3 9.5 9.9 20.7
Injectables 37.9 50.0 34.5 53.0 42.3 21.9
Pills 24.1 17.7 25.8 16.2 27.8 26.1
Condoms 14.9 12.1 15.6 10.4 11.8 21.3
Traditional 9.6 9.0 9.7 10.9 8.2 10.0
Among current users, previous method mix
(n=350) (n=1223) (n=559) (n=438) (n=575)
Long-term 7.0 5.0 7.6 4.1 5.4 10.2
Injectables 29.8 30.3 29.7 31.0 33.0 26.4
Pills 37.9 35.3 38.6 36.1 40.6 36.8
Condoms 13.7 16.8 12.9 16.5 10.8 14.5
Traditional 11.5 12.6 11.2 12.3 10.2 12.2
p-value: †≤0.10, *≤0.05, **≤0.01
4
Table 2.3: Multinomial logistic regression coefficients for current contraceptive use among women who are ever users in urban Kenya, n=5086
Independent variables Model 1: All women Model 2: All women
Current users Former users Current users Current users Former users Current users
Ref group never users never users former users never users never users former users
Neighborhood type; ref: formal residence
Informal 0.12 (0.10) 0.03 (0.10) 0.09 (0.07) 0.07 (0.12) 0.05 (0.11) 0.02 (0.08)
Household wealth; ref: rich
Poor - 0.54** (0.12) - 0.35** (0.12) - 0.19* (0.08) - 0.45** (0.14) - 0.26* (0.13) - 0.19* (0.09)
Intermediate -0.15 (0.12) - 0.27* (0.15) 0.12 (0.09) - 0.25 (0.13) - 0.28 (0.13) - 0.03 (0.10)
City; ref: Nairobi
Mombasa - 0.38** (0.06) - 0.28** (0.06) - 0.11* (0.04) - 0.32** (0.07) - 0.23** (0.06) - 0.09† (0.05)
Kisumu - 0.04 (0.04) - 0.05 (0.04) -0.001 (0.028) - 0.08† (0.05) - 0.06 (0.04) - 0.02 (0.03)
Age; ref: 20-24
15-19 - 0.05 (0.16) - 0.13 (0.15) 0.09 (0.13)
25-29 0.10 (0.12) 0.26* (0.12) - 0.16† (0.10)
30-34 0.004 (0.16) 0.32* (0.16) - 0.30** (0.11)
35-39 - 0.68** (0.18) - 0.25 (0.17) - 0.43** (0.14)
40-44 - 0.97** (0.23) - 0.04 (0.24) - 0.93** (0.17)
45-49 - 1.84** (0.26) - 0.38 (0.25) - 1.46** (0.20)
Marital status; ref: married/cohabiting
Never married - 0.42** (0.13) - 0.38** (0.13) - 0.04 (0.11)
Separated/ Divorced/ Widowed - 0.41* (0.17) 0.62** (0.16) - 1.02** (0.10)
Religion; ref: Protestant/ Other Christian
Catholic 0.27* (0.11) 0.09 (0.12) 0.18* (0.08)
Muslim/ Other/ None - 0.55** (0.16) - 0.37* (0.15) - 0.19 (0.12)
Education; ref: some/all secondary
None/primary incomplete - 0.83** (0.12) - 0.53** (0.13) - 0.30** (0.10)
Primary complete - 0.45** (0.11) - 0.28* (0.11) - 0.17* (0.08)
Post-secondary 0.89** (0.17) 0.68** (0.17) 0.20† (0.10)
Number of living children; ref: 1
0 - 1.43** (0.13) - 0.51** (0.14) - 0.92** (0.12)
2 0.95** (0.13) 0.60** (0.13) 0.35** (0.10)
3+ 1.47** (0.15) 0.87** (0.16) 0.61** (0.11)
Employed for cash, in the last 12 months; ref: yes
No - 0.46**(0.10) - 0.26** (0.09) - 0.21** (0.08)
Migration to city; ref: lived in city for >10 years
Migrated in the past 11 months - 0.24 (0.16) 0.03 (0.16) - 0.27† (0.14)
Migrated in the past 1-10 years 0.19 (0.15) 0.12 (0.15) 0.08 (0.10)
Heard FP message on radio in the past 12 months; ref: yes
No - 0.30** (0.09) - 0.36** (0.09) 0.05 (0.07)
p-value: †≤0.10, *≤0.05, **≤0.01; all models adjusted for clustering at the PSU level
4
46
Figure 2.1: Predicted probabilities of contraceptive use, by neighborhood type and household wealth
0.68 0.67
0.62 0.66
0.67
0.25 0.25 0.27 0.25 0.25
0.07 0.08 0.10 0.09 0.08
0 0.1 0.2 0.3 0.4 0.5 0.6 0.7 0.8
Informal Formal Poor Intermediate Rich
Place of residence Household wealth
P redi cte d p ro b ab ility o f co n traceptiv e u se
Predicted probabilities of contraceptive use, among all women
Table 2.4: Multinomial logistic regression coefficients for current contraceptive use among women who are current contraceptive users in urban Kenya, n=2568
Independent variables Model 1: Current users Model 2: Current users 1st method
users
1st method users
Switched less more effective
1st method users
1st method users
Switched less more effective
Ref group less more
effective switch
more less effective switch
more less effective switch
less more effective switch
moreless effective switch
more less effective switch
Neighborhood type; ref: formal residence
Informal - 0.019 (0.113) 0.10 (0.14) 0.11 (0.13) 0.05 (0.12) 0.10 (0.14) 0.05 (0.13)
Household wealth; ref: rich
Poor 0.29* (0.13) 0.62** (0.15) 0.33* (0.14) 0.31* (0.14) 0.40* (0.17) 0.12 (0.15)
Intermediate 0.29* (0.12) 0.44** (0.13) 0.15 (0.17) 0.34** (0.13) 0.31* (0.14) 0.01 (0.17)
City; ref: Nairobi
Mombasa 0.18* (0.07) 0.14 (0.09) - 0.05 (0.09) 0.17* (0.07) 0.16 (0.10) - 0.02 (0.10)
Kisumu - 0.09* (0.05) - 0.04 (0.05) 0.05 (0.05) - 0.07 (0.05) - 0.05 (0.05) 0.01 (0.05)
Age; ref: 20-24
15-19 0.09 (0.24) 1.38** (0.48) 1.30* (0.50)
25-29 0.16 (0.14) - 0.18 (0.16) - 0.34* (0.18)
30-34 0.16 (0.16) - 0.60** (0.19) - 0.75** (0.20)
35-39 - 0.07 (0.19) - 0.73** (0.22) - 0.65** (0.24)
40-44 - 0.18 (0.24) - 1.21** (0.28) - 1.00** (0.25)
45-49 0.13 (0.30) - 0.27 (0.38) - 0.36 (0.41)
Marital status; ref: married/cohabiting
Never married 0.17 (0.18) 0.06 (0.21) - 0.10 (0.24)
Separated/ Divorced/ Widowed - 0.43* (0.17) - 0.33 (0.21) 0.12 (0.19)
Religion; ref: Protestant/ Other Christian
Catholic - 0.03 (0.11) 0.28* (0.14) 0.32* (0.14)
Muslim/ Other/ None 0.35* (0.18) 0.12 (0.22) - 0.20 (0.22)
Education; ref: some/all secondary
None/primary incomplete - 0.11 (0.14) 0.002 (0.18) 0.12 (0.53)
Primary complete 0.001 (0.12) 0.35* (0.15) 0.34* (0.16)
Post-secondary - 0.30* (0.16) - 0.15 (0.17) 0.20 (0.18)
4
Number of living children; ref: 1
0 0.95** (0.22) 0.39 (0.23) - 0.57* (0.26)
2 - 0.02 (0.13) - 0.02 (0.18) - 0.01 (0.19)
3+ - 0.33* (0.14) 0.02 (0.19) 0.34† (0.19)
Employed for cash, in the last 12 months; ref: yes
No 0.22* (0.10) 0.06 (0.13) - 0.17 (0.14)
Migration to city; ref: lived in city for >10 years
Migrated in the past 11 months - 0.01 (0.22) - 0.005 (0.27) 0.07 (0.29)
Migrated in the past 1-10 years 0.18 (0.16) - 0.08 (0.19) - 0.25 (0.21)
Heard FP message on radio in the past 12 months; ref: yes
No 0.32** (0.11) 0.32* (0.13) 0.01 (0.13)
p-value: †≤0.10, *≤0.05, **≤0.01; all models adjusted for clustering at the PSU level
4
Figure 2.2: Predicted probabilities of current contraceptive use, by neighborhood type and household wealth
0.43
0.41
0.50 0.49
0.41
0.39 0.39
0.34 0.33
0.39
0.18 0.20
0.16 0.18
0.20 0.00 0.10 0.20 0.30 0.40 0.50 0.60
Informal Formal Poor Intermediate Rich
Place of residence Household wealth
P redi cte d p ro b ab ilities o f cur rent u se
Predicted probabilities of current contraceptive use, among current users