The genetic architecture of type 2 diabetes
A full list of authors and affiliations appears at the end of the article.
# These authors contributed equally to this work.
Abstract
The genetic architecture of common traits, including the number, frequency, and effect sizes of inherited variants that contribute to individual risk, has been long debated. Genome-wide
association studies have identified scores of common variants associated with type 2 diabetes, but in aggregate, these explain only a fraction of heritability. To test the hypothesis that lower-frequency variants explain much of the remainder, the GoT2D and T2D-GENES consortia performed whole genome sequencing in 2,657 Europeans with and without diabetes, and exome sequencing in a total of 12,940 subjects from five ancestral groups. To increase statistical power, we expanded sample size via genotyping and imputation in a further 111,548 subjects. Variants associated with type 2 diabetes after sequencing were overwhelmingly common and most fell within regions previously identified by genome-wide association studies. Comprehensive
enumeration of sequence variation is necessary to identify functional alleles that provide important clues to disease pathophysiology, but large-scale sequencing does not support a major role for lower-frequency variants in predisposition to type 2 diabetes.
Reprints and permissions information is available at www.nature.com/reprintsUsers may view, print, copy, and download text and data-mine the content in such documents, for the purposes of academic research, subject always to the full Conditions of use:http:// www.nature.com/authors/editorial_policies/license.html#terms
CORRESPONDENCE and REQUEST FOR MATERIALS Correspondence and request for materials should be addressed to [email protected] or [email protected].
†These authors jointly supervised this work. ‡Deceased.
Current addresses (where relevant) are provided in supplementary information.
Supplementary information is linked to the online version of the paper at www.nature.com/nature. AUTHOR CONTRIBUTIONS
Author contributions are provided in supplementary information. AUTHOR INFORMATION
Data deposition: Whole genome sequence data from the GoT2D project are available by application to the European Genotype Archive (EGAS00001001459) and from dbGAP (phs000840.v1.p1). Whole exome sequence data from the T2D-GENES project are available from the European Genotype Archive (EGAS00001001460) and from dbGAP (phs000847.v1.p1, phs001093.v1.p1, phs001095.v1.p1, phs001096.v1.p1, phs001097.v1.p1, phs001098.v1.p1, phs001099.v1.p1, phs001100.v1.p1, phs001102.v1.p1). Summary level data from the exome array component of this project (and from the exome and genome sequence) can be freely accessed at the Accelerating Medicines Partnership T2D portal (www.type2diabetesgenetics.org), and similar data from the GoT2D-imputed data at www.diagram-consortium.org.
COMPETING FINANCIAL INTERESTS
Ralph A DeFronzo has been a member of advisory boards for Astra Zeneca, Novo Nordisk, Janssen, Lexicon, Boehringer-Ingelheim, received research support from Bristol Myers Squibb, Boehringer- Ingelheim, Takeda and Astra Zeneca, and is a member of speaker's bureaus for Novo-Nordisk and Astra Zeneca.
Jose C Florez has received consulting honoraria from Pfizer and PanGenX.
HHS Public Access
Author manuscript
Nature
. Author manuscript; available in PMC 2017 February 04.Published in final edited form as:
Nature. 2016 August 4; 536(7614): 41–47. doi:10.1038/nature18642.
A
uthor Man
uscr
ipt
A
uthor Man
uscr
ipt
A
uthor Man
uscr
ipt
A
uthor Man
uscr
There is compelling evidence that individual risk of type 2 diabetes (T2D) is strongly
influenced by genetic factors1. Progress in characterizing the specific T2D-risk alleles
responsible has been catalyzed by the ability to perform genome-wide association studies (GWAS). Over the past decade, successive waves of T2D GWAS – featuring ever larger samples, progressively denser genotyping arrays supplemented by imputation against more complete reference panels, and richer ethnic diversity – have delivered >80 robust
association signals2-8. However, in these studies, the alleles interrogated for association are
predominantly common (minor allele frequency [MAF]>5%), and with limited
exceptions7,9, the variants driving known association signals are also common, with
individually-modest impacts on T2D risk 2-8,10. Variation at known loci explains only a
minority of observed T2D heritability2,3,11.
Residual genetic variance is partly explained by a long tail of common variant signals of
lesser effect2. However, the contribution to T2D risk attributable to lower-frequency variants
remains a matter of considerable debate, not least because of the relevance of disease
architecture to clinical application11. Next-generation sequencing enables direct evaluation
of the role of lower-frequency variants to disease risk7,12,13. This paper describes the efforts
of the coordinated, complementary strategies pursued by the Genetics of Type 2 Diabetes (GoT2D) and T2D-GENES (Type 2 Diabetes Genetic Exploration by Next-generation sequencing in multi-Ethnic Samples) Consortia. GoT2D collected comprehensive genome-wide sequence data from 2,657 T2D cases and controls; T2D-GENES focused on exome sequence variation, assembling data (after inclusion of GoT2D exomes) from a multiethnic sample of 12,940 individuals. Both consortia used genotype data to expand the sample size available for association testing for a subset of the variants exposed by sequencing.
Analysis of genome-wide variation
The GoT2D consortium selected for whole genome sequencing cases of type 2 diabetes (T2D) and ancestry-matched normoglycemic controls from northern and central Europe (Methods; Supplementary 1). To increase power to identify low-frequency
(0.5%<MAF<5%) and rare (MAF<0.5%) T2D variants of large effect, we preferentially ascertained individuals from the extremes of genetic risk (Methods). The genome sequence of 1,326 cases and 1,331 control individuals was determined through joint statistical analysis of low-coverage whole-genome sequence (~5x), deep-coverage exome sequence (~82x), and array-based genotypes at 2.5M single nucleotide variants (SNVs) (Extended Data Fig. 1;
Extended Data Table 2).
We detected, genotyped, and estimated haplotype phase for 26.7M genetic variants (Extended Data Fig. 1; Extended Data Table 3), including 1.5M short insertion-deletion variants (indels) and 8.9K large deletions. Individual diploid genomes carried a mean of 3.30M variants (range: 3.20M-3.35M), including 271K indels (262K-327K), and 669 (579-747) large deletions. These data include many variants not directly studied by previous GWAS, including all of the indels as well as 420K common and 2.4M low-frequency SNVs
poorly tagged (r2≤0.30)3,4 by genotype arrays. We estimate near-complete ascertainment
(98.2%) of SNVs with minor allele count >5 (MAF>0.1%), and high accuracy (>99.1%) at heterozygous genotypes (Methods; Fig. 1a). As half the sequenced individuals were T2D
A
uthor Man
uscr
ipt
A
uthor Man
uscr
ipt
A
uthor Man
uscr
ipt
A
uthor Man
uscr
cases, ascertainment was enhanced for any rare or low-frequency variants that substantially increase T2D risk (Fig. 1a). Specifically, we estimate ≥80% power to detect (at
genome-wide significance, α=5×10⁻⁸) T2D risk variants with MAF≥5% and OR≥1.87, or
MAF≥0.5% and OR≥4.70 (Extended Data Fig. 4).
We tested all 26.7M variants for T2D association by logistic regression assuming an additive genetic model (Supplementary 2). Analyses using a mixed-model framework to account for population structure and relatedness generated almost identical results. At genome-wide significance, 126 variants at four loci were associated with T2D (Fig. 1b). This included two previously-reported common-variant loci (TCF7L2, ADCY5), a previously-reported
low-frequency variant in CCND27 (rs76895963, MAF=2.6%, pseq=4.2×10⁻⁹), and a novel
common-variant association near EML4 (MAF=34.8%, pseq=1.0×10⁻⁸). There was no
significant evidence of T2D association for sets of low-frequency or rare variants within coding regions, nor within specified non-coding regulatory elements (Methods).
Power to detect association with low-frequency and rare variants of modest effect is limited in 2,657 individuals. To increase power for variants discovered via genome sequencing, we imputed sequence-based genotypes into 44,414 additional European-origin individuals (11,645 T2D cases, 32,769 controls; Methods) from 13 studies (Supplementary 3). We estimated power in the combined sequence plus imputed data, adjusting for imputation quality, to be ≥80% for variants with MAF≥5% and OR≥1.23, or MAF≥0.5% and OR≥1.92 (Extended Data Fig. 4). Meta-analysis combining results for the sequence and imputed data identified 674 variants across 14 loci associated with T2D at genome-wide significance (Fig.
1c). All were common except the CCND2 variant described above. We observed a novel association with a common variant near CENPW (rs11759026, MAF=23.2%,
pmeta=3.5×10⁻⁸; Fig. 1c) and replicated this association in an additional 14,201 cases and
100,964 controls from the DIAGRAM consortium (p=2.5×10⁻⁴; pcombined=1.1×10⁻¹¹;
Methods). The EML4 signal detected in the sequence data did not replicate in the imputed
data (p=0.59; pmeta=0.26; Fig. 1c).
To test for additional association signals we performed conditional analysis at loci previously associated with risk of T2D (Methods). We identified two novel association signals, both involving low-frequency variants, at a corrected significance threshold
(α<1.8×10⁻⁶; Methods): one at the IRS1 locus (rs78124264, MAF=2.2%,
pconditional=2.5×10⁻⁷) and one upstream of PPARG (rs79856023, MAF=2.2%,
pconditional=9.2×10⁻⁷) (Extended Data Table 5). The PPARG signal overlaps regulatory elements in hASC pre-adipose and HepG2 cells, consistent with evidence that altered
adipose regulation drives the primary PPARG signal14.
Analysis of coding variation
The T2D-GENES consortium adopted a complementary strategy, focused on variants in protein-coding sequence, and seeking to improve power to detect rare-variant association by exploiting the more robust functional annotation of coding variation and the potential to
aggregate multiple alleles of presumed similar impact in the same gene12,15. We combined
exome sequence data from 10,437 T2D cases and controls of diverse ancestry generated by
A
uthor Man
uscr
ipt
A
uthor Man
uscr
ipt
A
uthor Man
uscr
ipt
A
uthor Man
uscr
T2D-GENES, with the equivalent data from GoT2D. This created a joint data set (after all QC) comprised of 12,940 individuals (6,504 cases; 6,436 controls) drawn from five ancestry groups: 4,541 of European origin, and ~2,000 [range: 1,943-2,217] each of South Asian, East Asian, Hispanic, and African American origin (Extended Data Fig. 1; Extended Data Table 2; Supplementary 4). Mean coverage was 82x across the coding sequence of 18,281 genes, identifying 3.04M variants (1.19M protein-altering) (Supplementary 5,6). Each diploid genome carried a mean of 9,243 (range: 8,423-11,487) synonymous, 7,636 (6,935-9,271) missense, and 250 (183-358) protein-truncating alleles (Supplementary 7).
We tested for T2D association within the five ancestral groups, assuming an additive genetic model, using mixed-model approaches that account for population structure and
relatedness16, and combined ancestry-specific results via trans-ethnic meta-analysis
(Methods). We estimate ≥80% power to detect (at genome-wide significance) T2D risk variants with MAF≥5% and OR≥1.36, or MAF≥0.5% and OR≥2.29 (Methods; Extended
Data Fig. 4). Only one variant reached genome-wide significance (PAX4 Arg192His,
rs2233580, p=9.3×10⁻⁹) (Table 1; Extended Data Figs. 6,7; Supplementary 8). This
association was exclusive to East Asians, in whom the 192His allele is, in fact, common (MAF~10%) with a substantial effect size (allelic OR=1.79 [1.47-2.19]); 192His is virtually absent in other ancestries (MAF=0.014%). The rs2233580 association replicated in
independent East Asian case-control data (n=3,301; p=5.9×10⁻⁷: Supplementary 9) and
was distinct (r2<0.05) from previously-reported GWAS SNVs at the GCC1-PAX4 locus6,8.
PAX4 encodes a transcription factor involved in islet differentiation and function17
(Supplementary 10), and PAX4 variants have been implicated in early-onset monogenic
diabetes18. However, in East Asian cases, 192His was not associated with age of diabetes
diagnosis (p=0.64), indicating this variant influences risk of type 2 rather than early-onset monogenic diabetes (Supplementary 9).
To increase power to detect association of rare variants that cluster in individual genes, we
deployed gene-level variant aggregation tests15 across the exome sequence data (Methods;
Supplementary 11). We observed no deviation from the null distribution of association
statistics, and no single gene reached exome-wide significance (α=2.5×10⁻⁶) (Methods;
Supplementary 12,13). When we focused on 634 genes mapping to known GWAS regions,
only FES exceeded a reduced significance threshold of α=7.9×10⁻⁵ (psouthAsian=7.2×10⁻⁶,
pmultiethnic=1.9×10⁻⁵) (Method; Supplementary 14). This aggregate signal was driven entirely by the South Asian-specific Pro536Ser variant (MAF=0.9%, OR=6.7 [2.6-17.3],
p=7.5×10⁻⁶), indicating that FES is likely to be the effector gene at the PRC1 GWAS locus4.
To increase power to detect coding variant associations (Extended Data Fig. 4), we
contributed early T2D-GENES exome data to the design of Illumina exome array9, and then
collected genotypes from an additional 28,305 T2D cases and 51,549 controls of European-ancestry from 13 studies (Extended Data Fig. 1; Extended Data Table 2; Supplementary 15). Of 27,904 protein-altering variants with MAF>0.5% detected in exome sequence data from n=4,541 European individuals, variation at 81.6% was captured on the array
(Supplementary 16).
A
uthor Man
uscr
ipt
A
uthor Man
uscr
ipt
A
uthor Man
uscr
ipt
A
uthor Man
uscr
Association analysis in the combined sequence and array data from >90,000 individuals identified 18 coding variants (17 nonsynonymous), at 13 loci, which exceeded genome-wide
significance (α=5×10⁻⁸) (Table 1; Extended Data Figs. 6,7). All of these were common
(MAF>5%) and all but one mapped within established common-variant GWAS regions2,3.
The exception, which we replicated in the INTERACT study19 (n=9,292;
pINTERACT=2.4×10⁻⁴; pmeta=2.2×10⁻¹¹), involved a common haplotype of four strongly-correlated coding variants in MTMR3 and ASCC2 (Table 1). Of these, MTMR3 Asn960Ser (MAF=8.3%) had the strongest residual association signal on conditional analysis,
implicating MTMR3, encoding a phosphatidylinositol phosphatase20, as the probable
effector transcript at this locus (Extended Data Table 5; Extended Data Figs. 6,7; Supplementary 10,17).
The remaining coding variant signals provided an opportunity to highlight causal alleles and effector transcripts for known GWAS signals. For five loci (SLC30A8, GCKR, PPARG, KCNJ11-ABCC8, PAM), the coding variants identified had previously been nominated as
causal for their respective GWAS signals2,7,13. For the other seven loci, GWAS
meta-analyses had previously highlighted a lead variant in non-coding sequence2,5,6. We
(re)evaluated these relationships with conditional and credible set analyses, finding that, at most, the evidence supported a direct causal role for the coding variants concerned (Extended Data Table 5; Extended Data Figs. 6,7; Supplementary 10,17).
For example, at the CILP2 locus2, previous GWAS had identified the non-coding variant
rs10401969 as the lead SNV. However, direct genotyping of TM6SF2 Lys167Glu on the exome array revealed complete linkage disequilibrium with rs10401969, and reciprocal signal extinction in conditional analyses (Extended Data Table 5; Extended Data Figs.
6,7). In previous GWAS, the association at Lys167Glu had been obscured by incomplete
genotyping and poor imputation (Supplementary 18). The TM6SF2 Lys167 allele has been
shown to underlie predisposition to hepatic steatosis21, and was associated with fasting
hyperinsulinemia (p=1.0×10⁻⁴) in 30,824 non-diabetic controls from the present study. This
combination of genetic and functional data, consistent with known mechanistic links
between insulin resistance, T2D, and fatty liver disease22, implicates TM6SF2 Lys167Glu as
the likely T2D-risk variant at this locus.
In contrast, the association at RREB1 Asp1171Asn represented a novel signal, conditionally independent of the adjacent common-variant GWAS signal. This association, together with that involving a second associated coding variant, Ser1554Tyr, which has a marked
association with fasting glucose (p=2.7×10⁻⁹ in levels in 38,338 non-diabetic subjects from
the present study) (Supplementary 19), establishes RREB123 as the probable effector gene
at the SSR1 locus.
Given the concentration of coding-variant associations within established GWAS loci, we sought to nominate additional single-variant signals in 634 genes mapping to established
T2D GWAS regions using a Bonferroni-corrected α=1.6×10⁻⁵ (Methods; Supplementary
14,20). At HNF4A, we confirmed a T2D association at Thr139Ile (European MAF range
0.7-3.8%, OR=1.15 [1.08-1.22], p=2.9×10⁻⁶)10 distinct both from the common non-coding
lead GWAS SNV2,3,5, and multiple rare HNF4A variants implicated in monogenic
A
uthor Man
uscr
ipt
A
uthor Man
uscr
ipt
A
uthor Man
uscr
ipt
A
uthor Man
uscr
diabetes24. Additional coding variant associations in TSPAN8 and THADA highlighted these two genes as probable effector transcripts in their respective GWAS regions (Supplementary 10,21).
Rare alleles in Mendelian genes
We extended gene-based tests for rare-variant associations to gene-sets implicated in
monogenic or syndromic diabetes or in altered glucose metabolism24. Across 81 genes
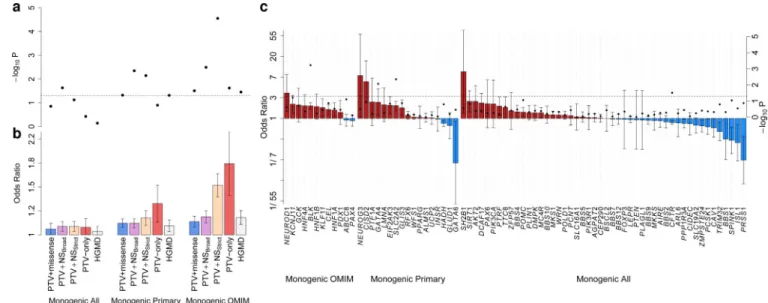
harboring rare alleles causal for monogenic or syndromic diabetes or related glycemic traits (‘Monogenic All’; Supplementary 22), the only variant or gene association genome-wide significance involved the previously-mentioned PAX4 Arg192His. However, across the entire gene-set, we observed a weak aggregate association with T2D-risk (p=0.023: Fig. 2a). The association was considerably stronger in two subsets of genes more directly implicated in monogenic and syndromic diabetes: a manually-curated set of 28 genes for which diabetes was the primary phenotype (‘Monogenic Primary’) and a partially-overlapping set of 13 genes reported in OMIM as causal for MODY or neonatal diabetes (‘Monogenic OMIM’) (Supplementary 22).
The ‘Monogenic OMIM’ gene-set had a statistically robust signal of association
(p=2.8×10⁻⁵, OR=1.51 [1.25-1.83]) driven by allelic burden of MAF<1% alleles. Effect size
estimates tracked with increasing stringency of variant annotation and gene-set definition, consistent with progressive enrichment for functional over neutral alleles (Fig. 2b). This signal does not reflect inclusion among T2D cases of individuals who, in reality, had monogenic diabetes: the association was not concentrated among genes most frequently
responsible for monogenic diabetes24 (Fig. 2c), and age of diabetes diagnosis was no
younger in variant carriers than non-carriers (Supplementary 23). The association signal remained after all alleles listed as ’disease-causing’ within the Human Genetic Mutation
Database were excluded (p=2.9×10⁻⁴, OR=1.50 [1.21-1.86]).
These analyses point to widespread enrichment for T2D association among rare coding alleles in genes causal for monogenic diabetes. In these genes, alleles of penetrance sufficient to drive familial segregation of early-onset diabetes coexist alongside those of more modest effect predisposing to later-onset T2D. No other compelling signals of rare-variant enrichment were detected using gene-set enrichment or protein-protein interaction analysis in other pre-defined gene-sets (Supplementary 24-26).
No evidence for synthetic association
In 2010, Goldstein and colleagues proposed that common-variant GWAS signals may be the consequence of low-frequency and rare variants that by chance cluster on common
haplotypes25. While this hypothesis has been debated26,27 and assessed indirectly3,28, we
used the near-complete ascertainment of genetic variation in 2,657 genome-sequenced
individuals to directly test the importance of ‘synthetic’ associations29. We focused on the
ten T2D GWAS loci at which our sample provided the strongest statistical evidence for association (p<0.001), implementing a conditional analysis procedure to assess whether
A
uthor Man
uscr
ipt
A
uthor Man
uscr
ipt
A
uthor Man
uscr
ipt
A
uthor Man
uscr
combinations of SNVs within a 5Mb window could explain the common-variant signal (Extended Data Table 8; Methods).
We first focused on missense variants, finding that none of the ten signals could be explained by low-frequency and rare variants within 2.5Mb of the common index SNV (Extended
Data Fig. 9). For example, at the IRS1 locus, including the five observed missense IRS1 alleles in the model did not meaningfully diminish the index SNV association
(punconditional=2.8×10⁻⁶, pconditional=4.3×10⁻⁶). With 99.7% ascertainment of low-frequency coding variants (Methods), these results rule out synthetic associations produced by missense variants at these ten loci.
We expanded the search to include all low-frequency and rare variants, non-coding and coding, within 2.5Mb of index SNVs. At no locus was a single low-frequency or rare variant sufficient to explain the GWAS signal (Extended Data Fig. 9). At 8 of the 10 loci, ≥10 low-frequency and rare variants were needed to reverse the direction of effect at the common index SNV; at TCF7L2, even 50 were insufficient (Extended Data Fig. 9). We note that the statistical procedure we developed and deployed is biased in favor of the synthetic
association hypothesis, since it is highly prone to over-fitting. Nonetheless, at 8 of the 10 loci the data were indistinguishable from a null model of no synthetic association (Extended
Data Table 8; Supplementary 27).
Nominating candidate functional alleles
Using the GoT2D whole genome sequence data, we constructed 99% ‘credible sets’ for each
T2D GWAS locus on the assumption of one causal variant per locus (Methods)30. Across 78
published autosomal loci at which the reported index SNV had MAF>1%, 99% credible set sizes ranged from 2 (CDKN2AB) to ~1,000 (POU5F1) variants; at 71 loci, the credible set contained >10 variants (Extended Data Fig. 9; Supplementary 28). The GoT2D dataset provides near-complete ascertainment of common and low-frequency variants to support more comprehensive credible set analysis than studies based on genotyping or imputation
alone3,31: of the credible set variants identified from whole genome sequence data, ~60% are
absent from HapMap and ~5% from 1000G Phase 1 (Extended Data Fig. 9).
Genomic maps of chromatin state or transcription factor binding32-35 have been used to
prioritize causal variants within credible sets36,37. We jointly modeled genetic association
and genomic annotation data at T2D GWAS loci using fgwas38. Consistent with previous
reports34,35, associated variants were enriched in coding exons, transcription factor binding
sites, and enhancers active in pancreatic islets and adipose tissue (Extended Data Fig. 10). Overall, including the functional annotation data reduced credible set size by 35%. At several loci, access to complete sequence data prioritized variants that overlap relevant regulatory annotations and were previously overlooked. For example, at the CCND2 locus, three variants not present in HapMap Phase 2 have combined probability of 90.0% of
explaining the common-variant signal2 (Extended Data Fig. 10); one of these (rs3217801)
is a 2bp indel overlapping an islet enhancer element.
A
uthor Man
uscr
ipt
A
uthor Man
uscr
ipt
A
uthor Man
uscr
ipt
A
uthor Man
uscr
Modelling disease architecture
To evaluate the overall contribution of low-frequency coding variation to T2D risk, we
estimated the proportion of variance in T2D-liability attributable to each such variant39
(Methods; Extended Data Fig. 11). We focused on exome array data to maximize sample size, and on variants with MAF>0.1%; sensitivity of variant ascertainment and accuracy of OR estimation decline below this threshold. Among the 31,701 variants on the exome array with 0.1%<MAF<5% there was a progressive increase in the maximum OR estimates with decreasing frequency. However, the liability variance explained for these variants rarely exceeded 0.05%, limiting power to detect association in the sample size available (Extended
Data Fig. 11). We estimated (Methods) that the liability variance collectively attributable to
coding variants in the 0.1%<MAF<5% range was 2.9%, compared to 6.3% for common variants.
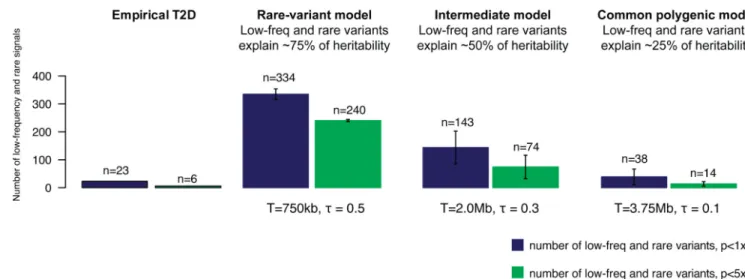
Finally, we compared our whole genome T2D association results with predictions from
population genetic simulations40 under twelve models that vary widely with respect to the
proportion of heritability explained by common, low-frequency, and rare variants. We mirrored the GoT2D study design (with imputation) and performed in parallel the same association analysis on empirical and simulated data, focusing on variants with MAF>0.1% and allowing for power loss due to imperfect imputation (Methods).
Figure 3 displays results for three representative models: a ‘purifying selection’ model in
which low-frequency and rare variants explain ~75% of T2D heritability, an intermediate model in which low-frequency/rare and common variants both contribute substantially, and a ‘neutral’ model in which common variants explain ~75% of T2D heritability. Predictions of the first two models differ markedly in the numbers of low-frequency and rare risk variants that are associated with T2D. Specifically, these two models predict a larger number and greater effect size of low-frequency variants found in our whole genome sequencing study as compared to those observed in the empirical data. In contrast, empirical data are consistent with predictions under the ‘neutral’ common-variant model.
The century-old Mendelian-biometrician debate pitted those who attributed trait variation to rare variants of large effect against those who argued that trait variation is largely due to many common variants of small effect. The debate today is about whether the ‘missing
heritability’ after GWAS is due largely to individually rare, highly-penetrant variants41 or to
a large universe of common alleles of modest effect42. The results are of more than
academic interest, since genetic architecture plays out powerfully in relation to the power of genetic diagnosis and the application of precision medicine.
Our data and analysis indicate that for T2D, nearly all common-variant associations detectable by whole genome sequencing were previously found by GWAS based on genotyping arrays and imputation: concerns about incomplete coverage due to ‘holes’ in
HapMap11 coverage were, we show, unfounded. Of more lasting interest, the combination of
genome and exome sequencing in large samples provides limited evidence of a role for lower-frequency variants — coding or genome wide — in T2D predisposition. Of course, rare risk alleles have long been known to contribute in families with early-onset forms of
A
uthor Man
uscr
ipt
A
uthor Man
uscr
ipt
A
uthor Man
uscr
ipt
A
uthor Man
uscr
diabetes, and sequencing of Mendelian and GWAS genes has identified rare variants that
influence disease risk43,44. Sequencing of T2D cases in much larger samples will
undoubtedly uncover additional low-frequency and rare variants that provide biological and potentially clinical value. Nonetheless, our empirical and simulated data argue that these lower-frequency variants contribute much less to T2D heritability than do common variants. Moreover, the frequency spectrum of variant association signals is consistent with a model whereby limited selective pressure distributes most the genetic variance influencing T2D
risk among common alleles40, consistent with the frequency distribution of inter-individual
sequence variation. Similar large-scale sequencing-based exploration of other complex traits will be required to determine the extent to which the genetic architecture of T2D is
representative of other late-onset diseases.
Our results further strengthen the case for sequencing of diverse samples: the
population-enriched T2D risk variant in PAX4 dovetails with similar findings involving SLC16A1145 in
East Asian and Native American populations and TBC1D446 in Greenland Inuits. Study of
populations subject to bottlenecks and/or extreme selective pressures43,46,47 may be
particularly fruitful.
Understanding the inherited basis of T2D will require much further progress in identifying the mechanisms whereby common, mostly non-coding, variants influence disease risk. The
combination of global epigenetic measurements, genome editing48, and high-throughput
functional assays49 make it increasingly practical to characterize large numbers of
non-coding variants and the processes they impact. Genome sequencing in much larger numbers of individuals than included in the current study are needed and will no doubt provide foundational information to guide such experimentation and connect the results to human population variation, physiology, and disease. Integration of biological insights gleaned from common and rare variant associations to T2D into a unified picture of disease
pathophysiology will be required to fully understand the basis of this common but challenging disease.
EXTENDED METHODS
Ethics statement
All human research was approved by the relevant institutional review boards and conducted according to the Declaration of Helsinki. All participants provided written informed consent.
1 Data generation
1.1 GoT2D integrated panel generation
1.1.1. GoT2D sequenced samples—Here we describe how we generated, processed, and carried out quality control (QC) on sequence and genotype data for the 2,891 individuals initially chosen for GoT2D from four studies, and how this resulted in 2,657 individuals (1,326 T2D cases and 1,331 non-diabetic controls) for analysis (Extended Data Figure 1). We preferentially sampled early-onset, lean, and/or familial T2D cases and overweight
controls with low fasting glucose levels50. Specific details of selected samples are provided
in Extended Data Table 2 and Supplementary 1.
A
uthor Man
uscr
ipt
A
uthor Man
uscr
ipt
A
uthor Man
uscr
ipt
A
uthor Man
uscr
1.1.2. DNA sample preparation—De-identified DNA samples were sent to the Broad Institute (DGI, FUSION), Wellcome Trust Centre for Human Genetics in Oxford (UKT2D), and Helmholtz Zentrum München (KORA) and prepared for genetic analysis. DNA quantity was measured by Picogreen (all), and samples with sufficient total DNA and minimum concentrations for downstream experiments were genotyped for a set of 24 SNVs using the Sequenom iPLEX assay (DGI, FUSION, UKT2D): one gender assay and 23 SNVs located across the autosomes. The genotypes for these SNVs were used as a quality filter to advance samples and a technical fingerprint for subsequent sequencing and genome-wide array genotypes.
1.1.3. Exome sequencing—Genomic DNA was sheared, end repaired, ligated with barcoded Illumina sequencing adapters, amplified, size selected, and subjected to in-solution hybrid capture using the Agilent SureSelect Human All Exon 44Mb v2.0 (DGI, FUSION, UK2T2D) and v3.0 (KORA) bait set (Agilent Technologies, USA). Resulting Illumina exome sequencing libraries were qPCR quantified, pooled, and sequenced with 76bp paired-end reads using Illumina GAII or HiSeq 2000 sequencers to ~82-fold mean coverage.
1.1.4. Genome sequencing—Whole-genome Illumina sequencing library construction was performed as described for exome capture above, except that genomic DNA was sheared to a larger target size and hybrid capture was not performed. Resulting libraries were size selected to contain fragment insert size of 380bp±20% (DGI, FUSION, KORA) and 420bp±25% (UKT2D) using gel electrophoresis or the SAGE Pippin Prep (Sage Science, USA). Libraries were qPCR quantified, pooled, and sequenced with 101bp paired-end reads using Illumina GAII or HiSeq 2000 sequencers to ~5-fold mean coverage.
1.1.5. HumanOmni2.5 array genotyping—Genotyping was performed by the Broad Genetic Analysis Platform. DNA samples were placed on 96-well plates and genotyped using the Illumina HumanOmni2.5-4v1_B SNV array.
1.1.6. Alignment and processing of exome and genome sequence data
1.1.6.1. Alignment of sequence reads to reference genome: Sequence data were processed
and aligned to hg19 using the Picard (broadinstitute. github.io/picard/), BWA51, and
GATK52,53 pipelines. Resulting BAM and VCF files were submitted to NCBI and are available in dbGaP (accession number phs000840.v1.p1, study name NIDDK_GoT2D).
1.1.6.2. Coverage and QC of aligned sequence reads: We excluded 151 exome samples
with average coverage ≤20x in >20% of the target bases and 68 genome samples with average coverage ≤5x. After sequence alignment and post-processing, aligned sequence reads were screened based on multiple QC criteria, including number of mapped reads, number of mapped bases with <1% estimated base call error rate (>Q20), fraction of duplicate reads, fraction of properly paired reads, distribution of insert sizes, distribution of mean base quality with respect to sequencing cycles, and GC bias (Extended Data Figure
1).
A
uthor Man
uscr
ipt
A
uthor Man
uscr
ipt
A
uthor Man
uscr
ipt
A
uthor Man
uscr
1.1.6.3. Detecting and handling contamination of sequence reads: We assessed possible
DNA contamination in the genome and exome sequence data using verifyBamID54 using
two methods. First, we estimated the contamination level of sequenced samples using allele frequencies estimated from the HumanOmni2.5 array on a thinned set of 100,000 markers with minor allele frequency (MAF)>5%. Second, for samples with HumanOmni2.5 genotypes, we used these genotypes together with sequence data to estimate contamination and identify possible sample swaps. We excluded exome sequence data for 7 individuals and genome sequence data for 59 individuals with estimated contamination ≥2% using either method. Prior to variant calling, uncontaminated sample swaps were assigned to the correct sample label after searching for the matching pairs using the same method.
1.1.7. GoT2D integrated panel genotype calling
1.1.7.1. SNV identification: We processed whole-genome sequence reads across the
remaining 2,764 QC-passed individuals by two SNV calling pipelines: GotCloud (www.gotcloud.org) and GATK UnifiedGenotyper55. We merged unfiltered SNV calls across the two call sets and then processed the merged site list through the SVM and VQSR filtering algorithms implemented by those pipelines. SNVs that failed both filtering
algorithms were removed before genotyping and haplotype integration. For the 2,733 QC-passed exome sequenced individuals, we used GATK UnifiedGenotyper to call SNVs.
1.1.7.1.1. Illumina HumanOmni2.5 array genotyping: We used Illumina GenomeStudio v2010.3 with default clusters to call HumanOmni2.5 genotypes after comparing different clustering algorithms and observing that the default cluster resulted in highest concordance with sequence-based genotypes. Called genotypes were run through a standard QC pipeline; samples passing a call rate threshold of 95%, and genetic fingerprint (24 marker panel) and gender concordance were passed on to downstream GWAS QC. SNVs with GenTrain score<0.6, cluster separation score<0.4, or call rate<97% were considered technical failures at the genotyping laboratory and deleted before data release. We removed samples with call rate<98%, and SNVs monomorphic across all samples, failed by 1000G Omni 2.5 QC filter,
or with Hardy-Weinberg equilibrium p<10−6 (Extended Data Figure 1). 85 samples were
removed in this process.
1.1.7.2. Short insertion and deletion (indel) identification: For the whole-genome
sequence data, we used the GATK UnifiedGenotyper to call short indels (<50bp). Because short indels are known to have high false positive rates due to systematic sequencing and
alignment errors55, we used stringent filtering criteria in SVM and VQSR and excluded
indels that failed either algorithm. For exome sequencing, we used GATK UnifiedGenotyper
to call short indels, following best practices described elsewhere52.
1.1.7.3. Large deletion identification: We used GenomeSTRiP56 to call large (>100bp) deletions in the whole-genome sequence data. After initial discovery of large deletions in 2,764 QC-passed individuals, we merged the discovered sites with deletions identified in 1,092 sequenced individuals from the 1000G Project to increase sensitivity and then genotyped the merged site lists across the 2,764 individuals. After applying the default filtering implemented in GenomeSTRiP, pass-filtered sites variable in any of the samples
A
uthor Man
uscr
ipt
A
uthor Man
uscr
ipt
A
uthor Man
uscr
ipt
A
uthor Man
uscr
were identified as candidate variant sites. Among these candidate sites, we excluded variants in known immunoglobin loci to reduce the impact of possible cell-line artifacts. We then excluded 136 more individuals owing to an unusually large number of variants per sample (>median+3×mean absolute deviation). Variants present only in these excluded individuals were removed from further analysis.
1.1.8. GoT2D integrated panel haplotype integration
1.1.8.1. Genotype likelihood calculation: We merged SNVs discovered from the three
experimental platforms into one site list and calculated genotype likelihoods across all sites separately by platform. Because exome sequence data have substantial off-target coverage, we calculated likelihoods across the genome combining data from the genome and exome sequence experiments. For genome sequence, we calculated likelihoods using GotCloud; for exomes, we used GATK UnifiedGenotyper; for HumanOmni2.5 genotypes, we converted
hard genotype calls into genotype likelihoods assuming a genotype error rate of 10−6. For
indels, we calculated likelihoods in a similar way except the HumanOmni2.5 data could not be used. For structural variants (SVs), genotype likelihoods were calculated from
GenomeSTRiP using the whole-genome sequence data.
1.1.8.2. Integration of genotype and sequence data: We calculated combined genotype
likelihoods across each of the 2,874 individuals as the product of the corresponding genome, exome, and HumanOmni2.5 likelihoods assuming independent data across platforms (Extended Data Figure 1). We then phased the genotype data using the strategy developed
for 1000G Phase 155. Specifically, we phased the integrated likelihoods using Beagle57 with
10,000 SNVs per chunk and 1,000 overlapping SNVs between consecutive chunks. We
refined phased sequences using Thunder58 as implemented in GotCloud
(genome.sph.umich.edu/wiki/GotCloud) with 400 states to improve genotype and haplotype quality.
1.1.9. GoT2D integrated panel QC—2,874 individuals were available in the integrated haplotype panel. To identify population outliers, we carried out principal components analysis (PCA). We computed PCs for each of the three variant types (SNVs, short indels,
large deletions) using EPACTS on an LD-pruned (r2<0.20) set of autosomal variants
obtained by removing large high-LD regions59,60, variants with MAF<0.01, and variants
with Hardy-Weinberg equilibrium p<10−6. Inspecting the first ten PCs for each variant type,
we identified 43 population outliers and 136 additional outliers for large deletions only; we excluded these 179 individuals. We excluded an additional 38 individuals based on close relationships (estimated genome-wide identity-by-descent proportion of alleles shared >0.20) with other study members. 2,657 individuals remained available for downstream analyses (Extended Data Figure 1).
1.1.10. GoT2D integrated panel evaluation of variant detection sensitivity— Since we had no external data to evaluate SNV and indel variant detection sensitivity and genotype accuracy for our integrated haplotype panel, we evaluated accuracy for the low-pass whole-genome sequence data using the exome sequence data as gold standard for variants at which exome sequence depth was ≥10. We consider the resulting sensitivity and
A
uthor Man
uscr
ipt
A
uthor Man
uscr
ipt
A
uthor Man
uscr
ipt
A
uthor Man
uscr
accuracy estimates as lower bounds for the integrated panel, which combined information from the genome, exome, and HumanOmni2.5 data.
We estimated the sensitivity of low-pass genome sequence data to detect true SNVs by calculating the proportion of exome-sequencing-detected SNVs detected by low-pass genome sequencing in the 2,538 individuals with data for all three experimental platforms. For exome sequence allele counts <1,000, we merged adjacent allele count bins until the number of alleles was >1,000. We estimated the sensitivity of low-pass genome sequencing to detect common, low-frequency, and rare SNVs as 99.8%, 99.0%, and 48.2%, respectively. Similarly, we estimated the sensitivity of low-pass genome sequence to detect true short indels by calculating the proportion of exome sequencing-detected short indels detected by low-pass genome sequencing. Sensitivity estimates were >99.9%, 93.8%, and 17.9% for common, low-frequency, and rare short indels, respectively.
To estimate the sensitivity of the combined low-pass genome and exome sequence data, we focused on coding SNVs and calculated the proportion of HumanOmni2.5 SNVs detected by either sequencing platform. Because HumanOmni2.5 SNVs are enriched for common variants, we calculated a weighted averaged sensitivity at each allele count, weighted by the number of exome-detected variants given the allele count. Sensitivity estimates were 99.9%, 99.7%, and 83.9% for common, low-frequency, and rare variants.
1.1.11. GoT2D integrated panel evaluation of genotype accuracy—To evaluate genotype accuracy for SNVs, we focused on chromosome 20, and compared the
concordance of low-pass whole-genome-sequence-based genotypes with those based on exome sequence. Overall genotype concordance was 99.86%. Homozygous reference, heterozygous, and homozygous non-reference concordances were 99.97%, 98.34%, and 99.72%. We also compared genotype concordance between exome sequence and HumanOmni2.5 genotypes. Overall concordance was 99.4%. When the HumanOmni2.5 genotypes were homozygous reference, heterozygous, and homozygous non-reference, concordances were 99.97%, 99.69%, and 99.88%. We evaluated genotype accuracy of indels for the 210 chromosome 20 indels that overlapped between those discovered by exome and genome sequencing. Overall genotype concordance was 99.4%. When the exome genotypes were homozygous reference, heterozygous, and homozygous non-reference, concordances were 99.8%, 95.8%, and 98.6%.
To evaluate the genotype accuracy of our low-pass genome sequence data to detect true structural variants, we took advantage of the 181 individuals in our study previously
included in the WTCCC array-CGH based structural variant detection experiment61. Taking
the WTCCC data as gold standard, we estimated genotype accuracy across 1,047 overlapping structural variants (with reciprocal overlap>0.8) genome-wide. The overall genotype concordance was 99.8%. When the WTCCC genotypes were homozygous reference, heterozygous, and homozygous non-reference, concordances were 99.9%, 99.6%, and 99.7%.
A
uthor Man
uscr
ipt
A
uthor Man
uscr
ipt
A
uthor Man
uscr
ipt
A
uthor Man
uscr
1.2. GoT2D+T2D-GENES multiethnic exome panel generation and QC
1.2.1. Samples—We considered 6,504 T2D cases and 6,436 controls from 14 studies of African American, East Asian, South Asian, Hispanic, and European ancestry. In contrast to the GoT2D whole-genome integrated panel, this data set also includes GoT2D individuals for whom whole genome data were not available. Sample characteristics are provided in
Extended Data Table 2 and Supplementary 4. Sequence reads were processed and aligned
to the reference genome (hg19) with Picard (http://picard.sourceforge.net). Polymorphic
sites and genotypes were called with GATK, with filtering of sites performed using Variant Quality Score Recalibration (VSQR) for SNVs, and hard filters for indels. Genotype likelihoods were computed controlling for contamination.
Hard calls (the GATK-called genotypes but set as missing at a genotype quality (GQ)<20
threshold52) and dosages (the expected value of the genotype, defined as Pr(RX|data)
+2Pr(XX|data), where X is the alternative allele) were computed for each sample at each variant site. Hard calls were used only for quality control, while dosages were used in all downstream association analyses. Multi-allelic SNVs and indels were dichotomized by collapsing alternate alleles into one category because downstream association analyses required bi-allelic variants.
Individuals were excluded from analysis if they were outliers on one of multiple metrics: poor array genotype concordance (where available), high number of variant alleles or singletons, high or low allele balance (average proportion of non-reference alleles at heterozygous sites), or excess mean heterozygosity or ratio of heterozygous to homozygous genotypes.
Within this reduced set of individuals, we then performed extended QC using ethnicity and T2D status to provide high-quality genotype data for downstream association analyses. Within each ethnicity, we excluded variants based on hard call rate (<90% in any cohort),
deviation from Hardy-Weinberg equilibrium (p<10−6 in any ancestry group), or differential
call rate between T2D cases and controls (p<10−4 in any ancestry group). We then
considered autosomal variants that passed extended QC and with MAF>1% in all ancestry groups for trans-ethnic kinship analyses. We calculated identity-by-state (IBS) between each
pair of samples based on independent variants (trans-ethnic r2<0.05) and constructed axes of
genetic variation through PCA implemented in EIGENSTRAT62 to identify ethnic outliers
(Supplementary 29). We also identified duplicates based on IBS, and excluded the sample from each pair with lowest call rate and/or mismatch with external information. The extended QC excluded 68 individuals, and 9.9% of SNVs and 90.8% of indels from the clean dataset.
2. Association analysis
2.1.1. Power calculation
We used the genetic power calculator (http://pngu.mgh.harvard.edu/~purcell/gpc/) to
estimate power to detect T2D association assuming 8% prevalence. For the T2D-GENES +GoT2D exome sequence data set we assumed: (i) a fixed-effect across all five ancestry groups (12,940 individuals); and (ii) an effect specific to one group (2,000 individuals)
A
uthor Man
uscr
ipt
A
uthor Man
uscr
ipt
A
uthor Man
uscr
ipt
A
uthor Man
uscr
(Extended Data Figure 4). We repeated our calculations for combined exome sequence and exome array data, assuming a fixed effect across all ethnicities, for an effective total sample size of 82,758 individuals (Extended Data Figure 4).
For the GoT2D integrated panel we allowed for incomplete variant detection by multiplying power by the estimated sensitivity to detect the variant as a function of MAF. For imputed variants, we first multiplied the sample size by the median imputation quality (rsq_hat)
obtained from MaCH/Thunder or minimac63 for the corresponding MAF bin across the
analyzed cohorts, and then multiplied the estimated power by the fraction of variants that passed the imputation quality cutoff for that MAF bin.
For gene-based tests in the T2D-GENES+GoT2D data, we made use of a Bonferroni
correction for 20,000 genes, corresponding to p<2.5×10⁻⁶. We used a simulated haplotype
dataset from the SKAT package (http://cran.r-project.org/web/packages/SKAT/vignettes/
SKAT.pdf) and estimated the power of SKAT-O to detect association of variants within a gene at this threshold as a function of the phenotypic variance (1%) in a liability scale explained by additive genetic effects and the percentage of variants that were causal (50% and 100%). As for single-variant power calculations, we considered: (i) a fixed-effect across all ethnicities (12,940 individuals); and (ii) an effect specific to one ancestry group (2,000 individuals) (Extended Data Figure 4).
2.2. GoT2D integrated panel association analysis
2.2.1. Single-variant association analysis—We tested for T2D association in a logistic regression framework assuming an additive genetic model. We used the Firth
bias-corrected likelihood ratio test64,65 as our primary analysis strategy; we repeated association
analysis using the score test for inclusion in sample-size-weighted meta-analysis (Supplementary 2). Tests were adjusted for sex, the first two genotype-based PCs to account for population stratification, and an indicator function for observed temporal stratification based on sequencing date and center. PCs were calculated using
linkage-disequilibrium (LD) pruned (r2<0.20) HumanOmni2.5M array variants with MAF>1% after
removing large high-LD regions59,60.
2.2.2. Aggregate association analysis—To test for aggregate association within coding regions of the genome, we used the approach described in 2.3.6. For every gene and
mask tested, p-values were greater than 2.5 × 10⁻⁴. We also tested for aggregate association
among variants in non-coding regions of the genome. We aggregated variants in individual pancreatic islet enhancer elements (see 6.1), as these elements collectively demonstrated strongest genome-wide enrichment of T2D association. We performed both the burden and SKAT tests using genotypes from the integrated panel on variants with MAF<5% in each
islet enhancer element. We used a Bonferroni threshold p<1.68×10⁻⁷ based on a nominal
significance level of α=0.05 corrected for 298,240 elements with at least one variant. All
elements tested in this manner had p-value greater than 2.5 × 10⁻⁶.
A
uthor Man
uscr
ipt
A
uthor Man
uscr
ipt
A
uthor Man
uscr
ipt
A
uthor Man
uscr
2.3. GoT2D+T2D-GENES multiethnic association analysis
2.3.1. Kinship analysis—Within each ancestry group, we considered autosomal variants that passed QC with MAF>1% for ethnic-specific kinship analyses. We calculated IBS between each pair of samples in the ancestry group based on independent variants
(ethnic-specific r2<0.05) and constructed a kinship matrix to account for intra-ethnic population
structure and relatedness in downstream mixed-model (EMMAX) based association
analyses16. We also used IBS to identify pairs of related individuals within each ancestry
group (defined by pi-hat>0.3). We then defined intra-ethnic related exclusion lists for downstream non-EMMAX association analyses using the following steps: (i) remove the control from each T2D-status discordant pair; and (ii) remove the sample with lowest call rate from each T2D-status concordant pair. We also constructed intra-ethnic axes of genetic
variation through PCA implemented in EIGENSTRAT62. We identified axes of genetic
variation in each ancestry group for inclusion as covariates in downstream non-EMMAX association analyses to account for intra-ethnic population structure that: (i) explain at least 0.5% genotypic variation; and/or (ii) demonstrate nominal association (p<0.05) with T2D in logistic regression analysis.
2.3.2. Single-variant association analysis—Within each ancestry group, we
performed a score test of T2D association with each variant passing ethnic-specific QC in a
linear regression framework under an additive model in EMMAX16. We also performed a
Wald test of T2D association with each variant passing ethnic-specific QC in a logistic regression framework under an additive model with adjustment for ethnic-specific axes of genetic variation after exclusion of related samples (Supplementary 30). Within each ancestry group, we calculated genomic control inflation factors (score EMMAX and Wald) based on independent variants used for the ethnic-specific kinship analyses and corrected association summary statistics (p-value and SE) to account for residual population structure.
Subsequently, we performed trans-ethnic fixed-effects meta-analysis of ancestry-specific association summary statistics at each variant based on: (i) sample size weighting of score EMMAX directed p-values; and (ii) inverse-variance weighting of Wald beta/SE (to obtain unbiased estimates of allelic odds ratios and confidence intervals that cannot be constructed from EMMAX effect estimates). We also performed trans-ethnic meta-analysis of ancestry-specific association summary statistics (score EMMAX beta/SE) at each variant using
MANTRA66, using pair-wise mean allele frequency differences at the subset of independent
variants used for trans-ethnic kinship analyses as a prior for relatedness between ancestry groups.
2.3.3. Validation of PAX4 association signal in additional East Asian studies— We validated the PAX4 Arg192His (rs2233580) association signal in an additional 1,789 T2D cases and 1,509 controls of East Asian ancestry from Hong Kong, Korea, and Singapore (Supplementary 9). Within each study, we tested for association with T2D in a logistic regression model, and combined association summary statistics across studies through fixed-effects meta-analysis (Supplementary 9). Among T2D cases, we also tested for association with age of diagnosis in a linear regression model, and combined association summary statistics across studies through fixed-effects meta-analysis (Supplementary 9).
A
uthor Man
uscr
ipt
A
uthor Man
uscr
ipt
A
uthor Man
uscr
ipt
A
uthor Man
uscr
2.3.4. Admixture analysis—Admixed populations can offer greater statistical power to detect association because diverse ancestry increases genetic variation. However, admixture can also introduce false-positive signals due to population stratification and heterogeneity of
effects because of differential LD67. To assess the contribution of ancestral background in
the two admixed groups (African American and Hispanic), we inferred local ancestry based on SNVs in available GWAS data using two approaches. For African Americans, we ran
HAPMIX68 using CEU and YRI haplotypes from HapMap as reference, and estimated the
proportion of European ancestry at each genomic position. For Hispanics, we ran
Multimix69 using European, West African, and Native American haplotypes from HapMap
as reference, and estimated the proportion of European ancestry at each genomic position, since we observe only a very low West African contribution (1.1-3.2%, Supplementary 31). We then repeated our intra-ethnic EMMAX-based analyses within African American and Hispanic ancestry groups, this time adjusting for local ancestry by including the estimated proportion of European ancestry at each variant as a covariate. Adjustment for local ancestry resulted in numerically similar association statistics as those from unadjusted analyses in the African American and Hispanic samples.
2.3.5. Gene-based analysis—We generated four variant lists (‘masks’) based on MAF and functional annotation. We mapped variants to transcripts in Ensembl 66 (GRCh37.66). Using annotations from CHAoS v0.6.3, SnpEFF v3.1, and VEP v2.7, we identified variants predicted to be protein-truncating (e.g. nonsense, frameshift, essential splice site) denoted PTV-only or ‘Mask 1’; or protein-altering (e.g. missense, in-frame indel, non-essential splice site) in at least one mapped transcript (by at least one of the three algorithms) with
MAF<1%, denoted PTV+missense or ‘Mask 2’. We additionally used the procedure
described by Purcell et al.70 to identify subsets of missense variants with MAF<1% meeting
‘strict’ or ‘broad’ criteria for being deleterious, using annotation predictions from Polyphen2-HumDiv, PolyPhen2-HumVar, LRT, Mutation Taster, and SIFT; variants predicted deleterious by all five algorithms or by at least one algorithm were denoted PTV +NSstrict or ‘Mask 3’ and PTV+NSbroad or ‘Mask 4’, respectively. Indels predicted by CHAoS, SnpEFF, or VEP to introduce frameshifts were included in the ‘strict’ category. We calculated MAFs for each ancestry using high-quality genotype calls (GQ>20) for all samples passing extended QC. We considered a variant to have MAF<1% if MAF estimates for every ancestry group were <1%.
We used the MetaSKAT R package (v0.32)15 with the SKAT v0.93 library to perform
SKAT-O71 analysis within each ancestry, and in meta-analysis. Within each ancestry group,
we analyzed genotype dosages with adjustment for ethnic-specific axes of genetic variation after exclusion of 96 related individuals. We assumed homogenous allele frequencies and genetic affects for all studies within an ancestry group. We performed meta-analysis using genotype-level data, allowing for heterogeneity of allele frequencies and genetic effects between (but homogeneity within) ancestry groups. All analyses were completed using the recommended rho vector for SKAT-O: (0, 0.12, 0.22, 0.32, 0.52, 0.5, 1).
A
uthor Man
uscr
ipt
A
uthor Man
uscr
ipt
A
uthor Man
uscr
ipt
A
uthor Man
uscr
2.4. Imputed data
2.4.1. Samples—We carried out genotype imputation into 44,414 individuals (11,645 T2D cases and 32,769 controls) from 13 studies using the GoT2D integrated haplotypes as reference panel. Characteristics of the imputed studies are provided in Extended Data Table
2 and Supplementary 3.
2.4.2. Single-variant association meta-analysis—The one sequenced and thirteen imputed studies totaled 12,971 T2D cases and 34,100 controls. Each study performed its own sample- and variant-based QC. In each study, SNVs with minor allele count (MAC)≥1 passing QC were tested for T2D association assuming an additive genetic model adjusting for study-specific covariates. Association testing was performed using logistic regression Firth bias-corrected, likelihood ratio, or score tests as implemented in EPACTS
(genome.sph.umich.edu/wiki/EPACTS) or SNPTEST72. To account for related samples in the Framingham Heart Study, generalized estimating equations (GEE) were used, as implemented in R. Residual population stratification for each study was accounted for using
genomic control73. We then carried out fixed-effects sample-size weighted meta-analysis as
implemented in METAL74.
2.4.3. Conditional analyses in established GWAS loci—We compiled a list of 143 previously-reported genome-wide significant SNVs in 81 T2D autosomal loci (a) from
Morris et al.2 and Voight et al.4; (b) from papers they referenced; and (c) from references in
the NHGRI GWAS catalog75. We LD pruned these SNVs (r2<0.95), yielding a list of 129
SNVs. We deleted the CILP2 locus (and two SNVs) from subsequent whole-genome analyses owing to large regions in which no variants passed QC, resulting in a list of 127 index SNVs at 80 autosomal loci. To identify additional T2D-associated variants within these 80 T2D autosomal loci in the genome-wide data, we repeated GWA analysis for 12 of the 13 studies (conditional analysis results for FHS were unavailable), conditioning on the 127 index SNVs. We performed fixed-effects inverse-variance meta-analysis to combine conditional analysis results from the studies totaling 12,298 cases and 26,440 controls. For each known locus, we analyzed all SNVs within 500kb of the known index SNVs; if there were multiple known index SNVs, we analyzed all SNVs within 500kb of the most proximal and distal index SNVs. We imposed a conditional-analysis significance threshold of
α=1.8×10⁻⁶ based on a proportional number of multiple tests for ~83Mb of the ~3000Mb
genome.
2.5. Exome array data
2.5.1. Samples—We considered 28,305 T2D cases and 51,549 controls from 13 studies of European ancestry, genotyped with the Illumina exome array. Characteristics of the studies are provided in Extended Data Table 2 and Supplementary 15.
2.5.2. Overlap of exome sequence variation with exome array—We assessed overlap of variants present on the exome array with those observed in our trans-ethnic exome-sequence data. Since exome array primarily contains SNVs that are predicted to be protein altering, we focused on nonsense, essential splice site, and missense variants. Only
A
uthor Man
uscr
ipt
A
uthor Man
uscr
ipt
A
uthor Man
uscr
ipt
A
uthor Man
uscr
variants passing QC in both sequence and array data were included in our overlap assessment.
2.5.3. Data processing, QC, and kinship analysis—Within each study, exome array
genotypes were initially called using GenCall (https://support.illumina.com/downloads/
gencall_software.html) and Birdseed76. Sample and variant QC was then undertaken within each study based on several quality control filters. Criteria for sample exclusion included low call rate (<99%), mean heterozygosity, high singleton counts, non-European ancestry, sex discrepancy, GWAS discordance (where data were available), genotyping platform fingerprint discordance, and duplicate discordance. Variants were excluded based on call
rate (<99%), deviation from Hardy-Weinberg equilibrium (p<10−6), duplicate, chromosome
or allele mismatch, GenTrain score <0.6, Cluster separation score <0.4, and manual cluster checks. Missing genotypes were subsequently re-called using zCall, with a second round of QC to exclude poor quality samples (call rate <99% and mean heterozygosity) and variants (call rate <99%). Within each study, we considered independent autosomal variants that passed QC with MAF>1% for kinship analyses, and calculated IBS between each pair of samples. We used these statistics to: (i) identify non-European ancestry samples to be excluded from all downstream analyses; (ii) construct a kinship matrix to account for fine-scale population structure and relatedness in downstream EMMAX-based association analyses; (iii) identify related samples to be excluded from downstream non-EMMAX association analyses; and (iv) calculate axes of genetic variation for inclusion as covariates in downstream non-EMMAX association analyses to account for fine-scale population structure (if required).
2.5.4. Single-variant association analysis—Within each study, we performed a score test of T2D association with each variant passing QC in a mixed-model regression
framework under an additive model in EMMAX16. We also performed a Wald test of T2D
association with each variant in a logistic regression framework under an additive model with adjustment for axes of genetic variation after exclusion of related samples. For each test, we corrected SE and p-value for the genomic control inflation factor (if >1) calculated based on the independent autosomal variants used for kinship analysis.
Across studies, we performed fixed-effects meta-analysis of association summary statistics at each variant based on: (i) inverse-variance weighting of score EMMAX beta/SE; (ii) sample size weighting of score EMMAX directed p-values; and (iii) inverse-variance weighting of Wald beta/SE. For each of these meta-analyses, we applied a second round of correction of SE and p-value by genomic control, again calculated based on the independent autosomal SNVs used for kinship analyses.
2.5.5. Combined exome sequence and exome array single-variant analysis— We considered variants that were represented both in the exome sequence and on the exome chip. We began by performing fixed-effects meta-analysis of association summary statistics (after correction for genomic control, as described above) from the exome-chip meta-analysis and the European ancestry sequenced samples using: (i) inverse-variance weighting of score EMMAX beta/SE; (ii) sample size weighting of score EMMAX directed p-values; and (iii) inverse-variance weighting of Wald beta/SE. Subsequently, we performed