A PHOTOMETRIC STUDY OF THE DWARF SPHEROIDAL GALAXIES LEO IV AND BOÖTES II
Haw Cheng
A dissertation submitted to the faculty of the University of North Carolina at Chapel Hill in partial fulfillment of the requirements for the degree of Doctor of Philosophy in the
Department of Physics and Astronomy.
Chapel Hill 2014
© 2014 Haw Cheng
ABSTRACT
HAW CHENG: A Photometric Study of the Dwarf Spheroidal Galaxies Leo IV and Boötes II
(Under the direction of Bruce W. Carney)
ACKNOWLEDGEMENTS
TABLE OF CONTENTS
List of Tables . . . xi
List of Figures . . . xii
1 Introduction . . . 1
1.1 Oh Satellites, Where Art Thou? . . . 1
1.2 The Dwarf Spheroidal Galaxies . . . 6
1.3 Isochrones . . . 10
1.3.1 Isochrones as Stellar Populations . . . 10
1.3.2 Isochrones and Star Formation Histories . . . 18
1.4 Star Formation, Fe’s, andα’s . . . 20
1.5 Leo IV . . . 24
1.5.1 Background . . . 24
1.5.2 Composition . . . 27
1.5.3 Leo IV & V & Crater . . . 30
1.6 Boötes II . . . 32
2 Observations . . . 35
3 Data Reduction. . . 47
3.1 Overscan & Bias . . . 48
3.2 Dark Current . . . 49
3.3 Flat Fielding . . . 50
4 Photometry . . . 61
4.1 Photometry Overview . . . 61
4.2 Combining Frames . . . 63
4.3 Synthetic Aperture Photometry of the Standard Stars . . . 65
4.4 PSF Photometry of the Galaxies & Control Fields . . . 66
4.4.1 The Analytic PSF . . . 69
4.4.2 Spatial Variation of the PSF . . . 72
4.5 Cross Matching and Combining Photometry I . . . 73
4.6 Aperture Correction . . . 79
4.7 Cross Matching and Combining Photometry II . . . 82
4.8 Transformation . . . 85
4.9 Differential Photometry . . . 86
5 Photometric Results . . . 92
5.1 Leo IV . . . 92
5.1.1 Color Magnitude Diagram . . . 92
5.1.1.1 Filtering by Photometric Uncertainty . . . 94
5.1.1.2 Filtering bysharp . . . 97
5.1.1.3 Filtering by Cross Matching . . . 99
5.1.1.4 Statistical Subtraction . . . 100
5.1.2 Variable Stars . . . 101
5.1.3 Blue Stragglers . . . 107
5.2 Boötes II . . . 116
5.2.1 Color Magnitude Diagram . . . 116
5.2.1.1 Filtering by Photometric Uncertainty . . . 117
5.2.1.2 Filtering bysharp . . . 119
6 Isochrone Fitting & M92 . . . 127
6.1 Distances & RR Lyraes . . . 127
6.2 The Choice of Isochrones . . . 129
6.2.1 Convection . . . 130
6.2.2 Settling / Diffusion . . . 132
6.2.3 Boundary Conditions . . . 133
6.2.4 Color-Tef f Relations . . . 135
6.2.5 Horizontal Branches . . . 136
6.2.6 The Choice & the Offset . . . 136
6.3 Up, Down, Left, Right, Shape: Degeneracy of Fits . . . 139
6.4 M92 . . . 143
6.4.1 Parameters . . . 144
6.4.1.1 [Fe/H] . . . 144
6.4.1.2 [α/Fe] . . . 145
6.4.1.3 Distance & Reddening . . . 146
6.4.2 Isochrone Fits . . . 150
6.4.3 Age fromΔVHBT O . . . 160
6.4.3.1 “Standard Way” . . . 161
6.4.3.2 VandenBerg et al.’s Way . . . 162
6.4.3.3 VandenBerg et al.’s Way & M92 . . . 164
6.4.4 Age Summary . . . 166
7 Isochrone Fits : Leo IV . . . 173
7.1 Distance and Reddening . . . 173
7.2 Isochrone Fits . . . 173
7.3 The Age of Leo IV . . . 176
7.3.3 Age Summary . . . 181
7.4 Extended Star Formation History . . . 187
7.5 Horizontal Branches & Star Formation History . . . 191
7.6 Discussion . . . 194
7.7 Future Work . . . 198
8 Isochrone Fits : Boötes II . . . 200
8.1 Distance and Reddening . . . 200
8.2 Composition . . . 201
8.3 Isochrone Fits & Discussion . . . 201
8.4 Future Work . . . 206
9 Concluding Remarks & Questions . . . 208
9.1 Leo IV, Boötes II, & the Halo . . . 208
9.2 Leo IV & Reionization . . . 210
LIST OF TABLES
1.1 Photometric Studies of Leo IV . . . 27
1.2 Leo IV Literature Parameters . . . 28
1.3 Photometric Studies of Boötes II . . . 32
1.4 Boötes II Literature Parameters . . . 33
2.1 Leo IV Observations . . . 36
2.2 Leo IV Control Field Observations . . . 40
2.3 Boötes II Observations . . . 42
2.4 Landolt 1992 Standard Star Observations . . . 44
4.1 Transformation Coefficients . . . 86
6.1 Isochrones . . . 131
6.2 M92 Distance Modulus Estimates . . . 147
LIST OF FIGURES
1.1 Fig.1 of Smecker-Hane et al. 1994, a B band montage of the Carina dwarf spheroidal galaxy. Carina’s half light radius is 5.7 arcminutes (McConnachie 2012). Reproduced by permission of the AAS. . . 7 1.2 Fig. 8 of Walsh et al. 2008. The original caption reads : “Size-luminosity
plot of known Galactic satellites. The previous position of Boötes II is shown in gray along with the region bounded by the uncertainties in rh and MV . Values for the new Milky Way satellites are taken from Martin et al. (2008). Globular cluster properties are from Harris (1996). Dotted lines show lines of constant surface brightness.” Walsh et al. use “rh” for half light radius. Elsewhere in this thesis half light radius is referred to as r1/2. Reproduced by permission of the AAS. . . 8 1.3 Fits of Dartmouth isochrones to M92 from Dotter et al. 2007. The two
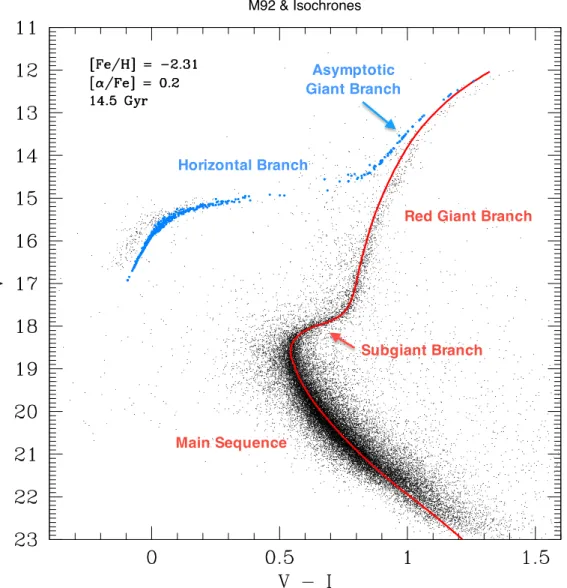
panels are for the two different synthetic color transformations available for the isochrones (§6.2.4). Reproduced by permission of the AAS. . . 11 1.4 CMD of globular cluster M92 with Dartmouth isochrone (red) and
syn-thetic horizontal branch (indigo) overplotted in order to highlight major evolutionary sequences. [Fe/H] =−2.31 and [α/Fe] = 0.2 for the models. The isochrone is that of a 14.5 Gyr old population. The M92 data is from Paust et al. 2007 (Nathaniel Paust, private communication). . . 12 1.5 Plots of Dartmouth isochrones (Dotter et al. 2007, Dotter et al. 2008) of
varying age. . . 13 1.6 Plots of Dartmouth isochrones (Dotter et al. 2007, Dotter et al. 2008) of
varying [Fe/H]. The squares and triangles on the [Fe/H] =−0.50 and 0.00 isochrones represent stars of the same mass on the two isochrones. The triangles represent stars of mass≈0.751 M, while the squares represent
stars of mass 0.793 M. . . 14
1.7 Plots of Dartmouth isochrones (Dotter et al. 2007, Dotter et al. 2008) of varying [α/Fe]. . . 15 1.8 Fig. 2 of Venn et al. 2004. The open squares are data from seven classical
1.9 Fig. 11 from Sim07. The original caption reads : “Metallicity-luminosity relationship for dwarf galaxies in the Local Group. The new ultra-faint galaxies (red circles) follow the trend of decreasing metallicity with lu-minosity set by more luminous dwarf galaxies (black squares). The two lowest-luminosity objects ( UMa II and Com) show possible evidence of tidal stripping. In comparison, Galactic globular clusters (blue triangles) do not follow any luminosity-metallicity relationship. Data for luminous dwarf galaxies are from Mateo (1998), Galactic globular clusters from Har-ris (1996), and the ultra-low luminosity dwarf Boötes (open square at MV =−5.8) from Muñoz et al. (2006a). Martin et al. (2007) find a somewhat higher metallicity for Boötes of [Fe/ H] =−2.1. The smaller horizontal bars on our galaxy measurements represent the uncertainty in the mean metallicity.” Leo IV is at MV of−5.1and [Fe/H] of−2.31. Note that this [Fe/H] value has been superseded (§1.5.2). Reproduced by permission of the AAS. . . 25 3.1 I band raw image of Boötes II, taken on the night of May 16, 2007, at UT
mid-exposure of 02:30. Notice not just the fringing, but also artifacts such as dark dust donuts. SOI’s detector consists of two CCDs each read out by two amplifiers. Note the slightly different bias level of the quarter image corresponding to each amplifier. . . 55 3.2 The image of Fig. 3.1 after overscan fitting and subtraction, subtraction of
the bias, and division by the flat. Note the disappearance of image artifacts. 56 3.3 The image of Fig. 3.1 after overscan fitting and subtraction, subtraction of
the bias, division by the flat, and defringing. Some residue of fringing is still visible, but the fringes are by and large gone. . . 57 3.4 Master bias frame for the night of May 16, 2007, used in the reduction
illustrated in Figures 3.1 through 3.3. . . 58 3.5 Master I band dome flat for the night of May 16, 2007, used in the reduction
illustrated in Figures 3.1 through 3.3. . . 59 3.6 Fringe frame used in the reduction illustrated in Figures 3.1 through 3.3.
4.2 Combined V band frame of Leo IV after PSF fitting and subtraction of stars by ALLSTAR. Some of the brighter stars may look unsubtracted when they have in fact been removed. The size of the post-subtraction residuals is greater for brighter stars, and they are large enough for the brightest ones that the stars look like they are still there when the star-subtracted image is displayed. Radial profile plots or surface brightness plots would show these bright areas to consist of low level residues left over from the subtraction. 71 4.3 Difference between the magnitudes derived from a constant PSF and a
quadratic PSF for the stars of the combined V band frame of Leo IV as a function of brightness. The difference is between instrumental magnitudes, and the horizontal axis plots the instrumental magnitude derived from the quadratic PSF. . . 74 4.4 Difference between the magnitudes of the stars in the combined V frame of
Leo IV derived from quadratic PSF’s produced from two different lists of model stars, one with 33 stars and the second with those plus an additional 19. The difference is between instrumental magnitudes, and the horizontal axis plots the instrumental magnitude derived from the PSF produced from the smaller PSF star list. . . 75 4.5 Difference between the magnitudes of the stars in the combined V frame
of Leo IV derived from linear PSF’s produced from two different lists of model stars, one with 33 stars and the second with those plus an additional 19. The difference is between instrumental magnitudes, and the horizontal axis plots the instrumental magnitude derived from the PSF produced from the smaller PSF star list. . . 76 4.6 Difference between the magnitudes of the stars in the combined I frame of
Leo IV derived from linear PSF’s of two different radii, 15 and 17 pixels. The difference is between instrumental magnitudes, and the horizontal axis plots the instrumental magnitude derived from the PSF produced from the smaller radius. . . 77 4.7 Difference between the magnitudes of the stars in the combined I frame of
4.8 Curve of growth for the V band master frame of Boötes II, a 900 second frame observed on the night of May 17/18, 2007. The difference in magni-tudes measured between successive apertures is plotted on the vertical axis. The average radius of successive aperture pairs in pixels is plotted on the horizontal axis. The open circles are the data points, with some artificial scatter along the horizontal axis introduced for ease of viewing. . . 84 4.9 Linear fit of standard V versus-extinction corrected instrumental color for
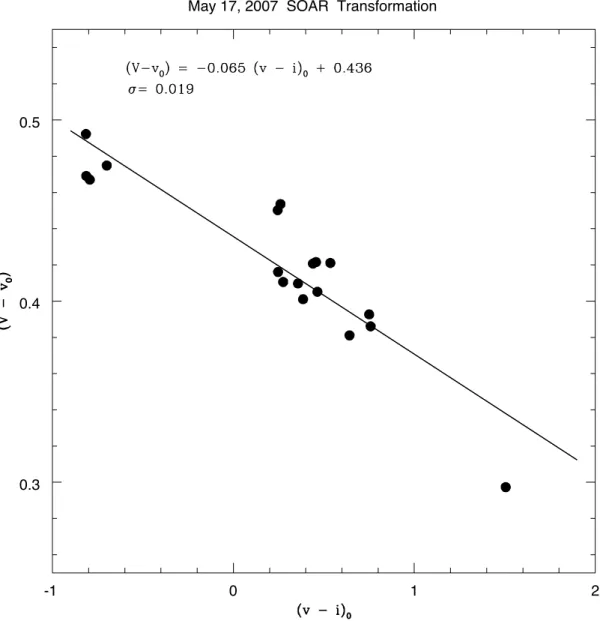
the standard stars for the night of March 22/23, 2007. . . 87 4.10 Linear fit of standard versus extinction-corrected instrumental color for the
standard stars for the night of March 22/23, 2007. . . 88 4.11 Linear fit of standard V versus extinction-corrected instrumental color for
the standard stars for the night of May 17/18, 2007 . . . 89 4.12 Linear fit of standard versus extinction corrected instrumental color for the
standard stars for the night of May 17/18, 2007. . . 90 5.1 Combined V band frame of Leo IV. The SOI imager has a field of view of
5.24×5.24 arcmin2 at a pixel scale of 0.00077. . . 94
5.2 Color magnitude diagram of Leo IV prior to the application of any filtering (by photometric uncertainty orsharp) or statistical subtraction. . . 95 5.3 a) Photometric error versus the raw magnitude for the combined V frame
of Leo IV (Fig. 4.1). One can see a main run of points following an approx-imately exponential curve along with a “cloud” of points lying above the main body. An exponential function was fit to the data. At each given step, points greater than one RMS uncertainty away from the fit were eliminated and the fit recalculated. b) The final fit is shown in green, while the rejected points are marked in red. . . 97 5.4 Results after filtering by bothsharp and photometric uncertainty for the
combined V frame of Leo IV. Points in red were eliminated. a) Plot of sharpvs. raw instrumental magnitude. b) Photometric uncertainty vs. raw instrumental magnitude. . . 99 5.5 A 1200 s V band exposure of Leo IV’s control field taken on May 16, 2007.
(This is exposure number 55 from Table 2.2.) . . . 102 5.6 The CMD for the control field of Leo IV. The CMD has been filtered by
5.7 The final CMD for Leo IV. The data for the CMD has been filtered by photometric uncertainty, sharpness, and has had the control field subtracted from it in order to remove foreground contamination.) or statistical sub-traction. . . 104 5.8 Same as Fig. 5.7 except with variable stars V1 and V2 (§5.1.2) marked
as red squares (V1 is the redder star) and the radial velocity members identified by Sim07 as cyan triangles. V2 is among the stars identified by Sim07 as a radial velocity member of Leo IV. . . 105 5.9 Finding chart for Leo IV’s variable stars. North is up, east is left. . . 106 5.10 The photometric variability plot for Leo IV’s variable star V1, 2007. . . . 108 5.11 The photometric variability plot for Leo IV’s variable star V1, 2009. . . 109 5.12 The photometric variability plot for Leo IV’s variable star V2, 2007. . . 110 5.13 The photometric variability plot for Leo IV’s variable star V2, 2009. . . 111 5.14 The photometric variability plot for comparison star 4383 (numbering of
this study, the star ID assigned by DAOPHOT.) Note that the vertical axis is v0,SOI, V in the SOI instrumental rather than Johnson-Cousins photometric system. . . 112 5.15 The photometric variability plot for comparison star 4383 (numbering of
this study, the star ID assigned by DAOPHOT.) Note that the vertical axis is v0,SOI, V in the SOI instrumental rather than Johnson-Cousins photometric system. . . 113 5.16 (RA,Dec) plot of Leo IV’s stars. Radial velocity members as identified by
Sim07 are plotted as magenta triangles, RGB and HB stars not so identified are plotted in black, and the blue straggler stars are plotted as large blue points. . . 114 5.17 A 900 s V band image of Boötes II. The SOI imager has a field of view of
5.24×5.24 arcmin2 at a pixel scale of 0.00077. . . 117 5.18 Color magnitude diagram of Boötes II prior to the application of any
5.19 Same as Fig. 5.3 for Leo IV. a) Photometric error versus the raw instru-mental magnitude for the V photometry of Boötes II. One can see a main run of points following an approximately exponential curve along with a “cloud” of points lying above the main body. An exponential function was fit to the data. At each given step, points greater than one RMS uncertainty away from the fit were eliminated and the fit recalculated. b) The final fit is shown in green, while the rejected points are marked in red. The multiple “sequences” are not a cause for concern. The large majority of those points would have been easily excluded based onsharpfiltering anyway (see Fig. 5.20.) Examination of those points which would not have been excluded bysharpfiltering revealed them to largely be false detections found only in single frames, often on the edges of those frames. . . 119 5.20 Same as Fig. 5.4 for Leo IV. Results after filtering by bothsharpand
pho-tometric uncertainty for the V photometry of Boötes II. Points in red were eliminated. a) Plot ofsharpvs. raw instrumental magnitude. b) Photomet-ric uncertainty vs. raw instrumental magnitude. The multiple “sequences” are not a cause for concern (see Fig. 5.19’s caption for details.) . . . 121 5.21 The final CMD for Boötes II. The data for the CMD has been filtered by
photometric uncertainty andsharp. . . 122 5.22 Same as Fig. 5.21 except with variable star V1 (§5.2.2) marked with a red
square and radial velocity members identified by Koch et al. 2009 marked with cyan triangles. . . 123 5.23 Finding chart for V1. North is up and east is to the left. . . 124 5.24 The photometric variability plot for Boötes II’s variable star V1. . . 125 5.25 The photometric variability plot for comparison star 1478 (numbering of
this study, the star ID assigned by DAOPHOT.) Note that the vertical axis is v0,SOI, V in the SOI instrumental rather than Johnson-Cousins photometric system. . . 126 6.1 CMD of M3’s horizontal branch plotted using data from Corwin & Carney
6.2 Fig.1 of Dotter et al. 2007. Here is the original caption : “Evolution of calibrated solar models from the pre-main sequence to the tip of the red giant branch in the theoretical H-R diagram (except for Krishna Swamy, where no pre-main sequence is plotted). Each model employs a different surface boundary condition and requires a different solar-calibrated mixing length. The PHOENIX model atmosphere boundary condition adopted in this paper lies between the Eddington and Krishna Swamy models, both in terms of the mixing length and, as a result, the temperature of the red giant branch. Note also that while the Eddington and Krishna Swamy models have a similar amount of curvature above log L/L = 1, the PHOENIX
model red giant branch is relatively straight.” Reproduced by permission of the AAS. . . 134 6.3 Comparison of Victoria-Regina and Dartmouth models of solar
composi-tion in the theoretical and observacomposi-tional planes. . . 138 6.4 Comparison of metal poor Victoria-Regina and Dartmouth models in the
theoretical and observational planes. . . 139 6.5 Dartmouth isochrones of differing age and composition, yet similar
mor-phology. Panel b shows constant offsets in V and (V−I) applied to the [Fe/H] =−1 isochrone in order to overlay it on the [Fe/H] =−1.8 isochrone. In fitting a cluster or galaxy CMD, uncertainties on the order of those off-sets in the reddening and distance modulus of the object and color offset δ(V−I) of the isochrone would leave one in doubt as to which of these two isochrones fit the object, unless outside information on composition was available. . . 141 6.6 Isochrones of slightly different age and somewhat different composition
which are very similar to each other. . . 143 6.7 Fitting of HD 140283 to the SGB of M92, assuming E(B−V) of 0 (see
text.) The M92 fiducial is from Johnson & Bolte 1998. . . 151 6.8 Same as Fig. 6.7, except assuming E(B−V) of 0.051 (see text.) . . . 152 6.9 Best fitting Dartmouth isochrone of [Fe/H] =−2.31 and [α/Fe] of 0.2 to
6.11 Victoria-Regina isochrone (magenta) and zero age horizontal branch (ZAHB) fit to M92. The fiducial sequences for M92 were obtained from Johnson & Bolte 1998 (indigo, solid lines) and Saviane et al. 2000 (indigo, dashed line.) The adopted distance modulus (m−M)0 is 14.49. . . 155 6.12 Figure 3 of VandenBerg 2000. The original caption : “Fits of ZAHB loci
and isochrones for the indicated parameters to BV and V I CMDs of M92. The photometry in the right-hand panel is from JB98, while Stetson & Harris (1988) and M. Bolte (1998, private communication) are the sources of the fiducial and the photometry for individual HB stars, respectively, that are plotted in the left-hand panel. The adopted reddenings and the derived distance modulus are as specified. Note that the isochrones, but not the ZAHBs, have been shifted in color by the indicated amounts in order to be able to infer the best estimate of the cluster age”. “JB98” refers to Johnson & Bolte 1998. Reproduced by permission of the AAS. . . 156 6.13 Figure 4 of VandenBerg 2000. The original caption : “Similar to the
left-hand panel in Fig. 3, except that the assumed (m−M)V, [α/Fe], [Fe/H], Y , andαM LT values, as well as the adopted color-Tef f relations, are varied in turn, as noted in panels (a)-(i), to determine how such variations affect the inferredΔVHBT O age. With the exception of panels (a) and (b), the M92 distance is set by matching the cluster HB stars to the relevant ZAHB. Quantities not specified in any given panel have the same values as in the previous fgure. E(B−V ) = 0.02 mag is assumed throughout.” Their Fig. 3 is reproduced here as Fig. 6.12. Reproduced by permission of the AAS. . . 158 6.14 Paust et al. 2007’s M92 data (black points) plotted together with the M92
fiducials of Johnson & Bolte 1998 (solid indigo line) and Saviane et al. 2000 (dashed indigo line). The fiducials have been shifted in color by
−0.014 magnitude in order to match the MSTO color of Paust’s data. . . . 165 6.15 Van13’s method applied to Paust et al. 2007’s M92 data using [α/Fe] = 0.2
Dartmouth isochrones. The distance modulus (m−M)0 found from fitting the model to observed HB is 14.60. Color offsets applied to the isochrones are as follows : δ(V−I) of 0.008 for the 13.5 Gyr isochrone,−0.008 for the 14.5 Gyr isochrone, and−0.0215 for the 15.5 Gyr isochrone. . . 167 6.16 Same as Fig. 6.15, except zoomed in to the MSTO and SGB region. . . 168 6.17 Van13’s method applied to Paust et al. 2007’s M92 data using [α/Fe] = 0.4
6.18 Same as Fig. 6.17, except zoomed in to the MSTO and SGB region. . . 170 6.19 Van13’s method applied to M92 fiducials from Johnson & Bolte 1998 (solid
indigo line) and Saviane et al. 2000 (dashed indigo line) using [α/Fe] = 0.2 Dartmouth isochrones. The distance modulus (m−M)0 found from fitting the model to observed HB is 14.64. A color offset ofδ(V−I) of 0.014 was applied to the isochrone. . . 171 6.20 Van13’s method applied to M92 fiducials from Johnson & Bolte 1998 (solid
indigo line) and Saviane et al. 2000 (dashed indigo line) using [α/Fe] = 0.4 Dartmouth isochrones. The distance modulus (m−M)0 found from fitting the model to observed HB is 14.59. A color offset ofδ(V−I) of 0.007 was applied to the isochrone. . . 172 7.1 Multi-age fits of Dartmouth isochrones of [α/Fe] = 0.2 to the CMD of Leo
IV along with a synthetic horizontal branch fit for the same composition. Red points are variable stars V1 and V2 (V2 is the bluer star.) Blue points are radial velocity members identified by Simon & Geha 2007 (Sim07). Open circles are stars identified as non-members by Sim07. Average pho-tometric uncertainties in V and (V−I) in one magnitude V bins are shown as error bars on the right hand side. The synthetic horizontal branch is that of a population that is 12.5 Gyr old, matching the age of the best fitting isochrone for this [α/Fe] as shown in Figure 7.5 (see text for details.) . . . 175 7.2 Same as Fig. 7.1 except zoomed in to give a better view of the MSTO and
SGB. . . 176 7.3 Multi-age fits of Dartmouth isochrones of [α/Fe] = 0.4 to the CMD of Leo
IV along with a synthetic horizontal branch fit for the same composition. Symbols are as for Fig. 7.1. The synthetic horizontal branch plotted is for population that is 12 Gyr old, matching the age of the best fitting isochrone for this [α/Fe] as shown in Figure 7.6 (see text for details.) . . . 177 7.4 Same as Fig. 7.3 except zoomed in to give a better view of the MSTO and
SGB. . . 178 7.5 Best fit of [α/Fe] = 0.2 Dartmouth isochrones plus synthetic horizontal
branch to the CMD of Leo IV. Symbols are as for Fig. 7.1. . . 179 7.6 Best fit of [α/Fe] = 0.4 Dartmouth isochrones plus synthetic horizontal
7.7 Van13’s method applied to Leo IV using [α/Fe] = 0.2 Dartmouth isochrones. The distance modulus (m−M)0 found from fitting the model to observed HB is 21.04. Color offsets applied to the isochrones are as follows :δ(V−I) of 0.022 for the 11.5 Gyr isochrone, 0 for the 12.5 Gyr isochrone, and
−0.024 for the 13.5 Gyr isochrone. Symbols are as for Fig. 7.1. . . 182 7.8 Same as Fig. 7.7 except zoomed in to give a better view of the MSTO and
SGB. . . 183 7.9 Van13’s method applied to Leo IV using [α/Fe] = 0.4 Dartmouth isochrones.
The distance modulus (m−M)0 found from fitting the model to observed HB is 21.01. Color offsets applied to the isochrones are as follows :δ(V−I) of 0.022 for the 11 Gyr isochrone, 0 for the 12 Gyr isochrone, and−0.022 for the 13 Gyr isochrone. Symbols are as for Fig. 7.1. . . 184 7.10 Same as Fig. 7.9 except zoomed in to give a better view of the MSTO and
SGB. . . 185 7.11 Fiducial sequences of M92 projected to the distance of Leo IV and
over-plotted on Leo IV’s CMD. A distance modulus of (m−M)0 = 14.62 is assumed for M92. The fiducial sequences for M92 were obtained from Johnson & Bolte 1998 (indigo, solid lines) and Saviane et al. 2000 (indigo, dashed line.) Other symbols are as for Fig. 7.1. . . 188 7.12 Isochrones of [α/Fe] = 0.2, age 12.5 Gyr, and multiple metallicities
over-plotted on the CMD of Leo IV. Symbols are as for Fig. 7.1. . . 190 7.13 Same as Fig. 7.12 except zoomed in to give a better view of the MSTO and
SGB. . . 191 7.14 Dartmouth isochrones and synthetic horizontal branches fitted to the CMD
of Leo IV. Symbols are as for Fig. 7.1. . . 195 8.1 Isochrone fits to the CMD of Boötes II for [α/Fe] = 0.2. Variable star V1
(§5.2.2) is plotted as a red point, radial velocity members as identified by Koch et al. 2009 are plotted as blue points. Average photometric uncertain-ties in V and (V−I) in half magnitudeV bins are shown in error bars on the right hand side of the panel. . . 202 8.2 Isochrone fits to the CMD of Boötes II for [α/Fe] = 0.4. Symbols are as for
8.3 Best fits to the CMD of Boötes II for [α/Fe] = 0.2. Distance moduli (m−M)0 for the fits are as follows : 18.15 for 13 Gyr, 18.07 for 13.5 Gyr, and 18.02 for 14 Gyr. The distance modulus (m−M)0 applied to the synthetic hor-izontal branch is 18.07. Note that the fits are so similar that they almost overlay each other. Symbols are as for Fig. 8.1. . . 204 8.4 Best fits to the CMD of Boötes II for [α/Fe] = 0.4. Distance moduli (m−M)0
for the fits are as follows : 18.09 for 12.5 Gyr and 18.04 for 13 Gyr. The distance modulus (m−M)0 applied to the synthetic horizontal branch is 18.04. Note that the fits are so similar that they almost overlay each other. Symbols are as for Fig. 8.1. . . 205 9.1 The age-metallicity plot for 55 globular clusters from VandenBerg et al.
CHAPTER 1 : INTRODUCTION
1.1 Oh Satellites, Where Art Thou?
Our Local Group of galaxies, by virtue of proximity and therefore accessibility, remains one of the most well studied galaxy groups. It provides a key observational standard against which to test theories of galaxy and structure formation. Any theory of structure formation must reproduce the properties of the Local Group.
In 1999, the Local Group was known to possess 38 members (Mateo 1998). Of these, three are massive spirals : the Milky Way, Andromeda (M31), and Triangulum (M33). Dwarf galaxies constitute the rest. By far the most numerous of these are the dwarf spheroidals, with dwarf ellipticals, dwarf irregulars, and galaxies intermediate to these types making up the remainder. Eleven of these satellites are bound directly to the Milky Way (nine dwarf spheroidals and the irregular Magellanic Clouds, though this is not uncontroversial in the case of the Clouds (Besla et al. 2007).)
ΛCDM is the currently accepted paradigm of cosmological structure formation (the theory’s initials point to what it states are the dominant components of the universe’s energy density - “CDM” is cold dark matter, andΛis Einstein’s cosmological constant.) Structure formation occurs hierarchically in this theory, with smaller dark matter halos merging to form larger ones. Galaxies are the luminous baryonic components embedded in the centers of these halos. The largest, which host galaxies such as the Milky Way, are expected to sport satellite systems of smaller subhalos which host the dwarf galaxies.
Local Group as a whole. This rather alarming shortfall was dubbed the “missing satellite problem”.
A possible answer to the problem arrived in the discovery of the ultra-faint dwarfs (UFDs). The first of these faintest of dwarf spheroidal galaxies was discovered in 2005 by Willman et al., who ran automated searches for overdensities of red giants through Sloan Digital Sky Survey (SDSS) data. Since then, a total of 17 additional Milky Way companions have been uncovered by such searches, all but one (the UFD candidate Crater) through SDSS data (Zucker et al. 2006a, Belokurov et al. 2007, Koposov et al. 2007, Walsh et al. 2007, Belokurov et al. 2008, Belokurov et al. 2009, Grillmair 2009, Belokurov et al. 2010, Belokurov et al. 2014). The total Local Group census currently stands at 76 (McConnachie 2012, Belokurov et al. 2014).
SDSS covers approximately one quarter of the sky. This suggests that the remaining three quarters harbor approximately another 50 or so undiscovered dwarfs, closing the gap between observations andΛCDM predictions. Unfortunately, it is not that simple.
Recent high resolution cosmological simulations both confirm the 1999 results and predict vastly greater numbers of dark matter subhalos. Klypin et al. 1999’s simulations were complete down to vcirc of approximately 20 km/s. (For practical reasons, circular
velocity vcirc, or alternatively its maximum within a given radius vmax, is the preferred
method of quantifying the size of dark matter halos in cosmological simulations. According to the vmax-to-bound-mass relation of Springel et al. 2008, a circular velocity of 20 km/s
corresponds to a bound mass of approximately4×108 M.) That study’s predictions are
for the number of dark matter subhalos with vcircgreater than 20 km/s.
∼2 km/s, corresponding to bound masses of∼105 M
. They find the cumulative number
of subhalos to be∼105.
Tollerud et al. 2008 calculated the observational incompleteness of Milky Way satel-lites in SDSS. They corrected for both sky coverage and luminosity bias, assuming the spatial distribution of satellites found in Via Lactea I. The study concluded that there are approximately 400 Milky Way satellites that cannot be detected in SDSS. This happens to correspond very closely to the number of Milky Way subhalos predicted atvmax ≈10 km/s (bound mass of∼106M
) by all three of the aforementioned high resolution simulations.
While that might be an encouraging sign, it is also not clear that smaller subhalos do not in fact form galaxies (Kravtsov 2010).
A possible solution to the missing satellites problem involves astrophysical mechanisms which work to suppress star formation in possibly the large majority of dark matter halos, leaving them dark. Most of these work by injecting energy into the baryonic component, removing gas before star formation can occur : cosmic reionization, supernova feedback, the photodissociation of H2(which acts as coolant for such systems.) Ram pressure stripping of subhalos by larger host halos can also work to remove gas and halt or prevent star formation. These mechanisms in conjunction with observational incompleteness potentially resolve the missing satellites problem. Alternatively, the solution might require modifications to current descriptions of dark matter. (See the reviews of Kravtsov 2010 and references therein for details.)
Whatever the case, the dwarf spheroidal galaxies, as by far the most numerous of the observed satellites, constitute an important piece of the puzzle. Their star formation histories should show the imprints of any mechanisms which serve to suppress galaxy formation. Their elemental abundances, in turn, can shed light on their star formation histories.
halo was built up by the accretion of satellites like them. The ages of the dSphs, including the UFDs, relative to the age of the halo, are an important aspect of this issue. If the halo was built up from dark matter halos like those which host the dSphs, then it would be reasonable to believe that their stellar populations should have similar ages given similar composition.
This thesis aids in the exploration of this matter by deriving the ages of Leo IV and Boötes II relative to the old, metal poor Milky Way globular cluster M92. Only two dSphs, Fornax and Sagittarius, have been observed to host globular clusters, so it is not thought that the Galactic globular clusters were accreted from systems like the dSphs. Rather, globular clusters, as self contained stellar systems within the MW halo, are relatively easy to study and age date. Therefore, the oldest and most metal poor among them provide an upper limit to the age of the halo. The ages of Leo IV and Boötes II relative to M92 thus provide age comparisons with one of the clusters key to defining that upper limit. Once this relative age is in hand, it will also enable comparisons with the rest of the Milky Way’s globular clusters. (Just as importantly, relative ages are, practically speaking, more reliable than absolute ages, a matter which will be taken up in a later chapter.)
age determination results for Leo IV and Boötes II, respectively, and discuss and explore possibilities for their star formation histories. Finally, Chapter 9 discusses the implications of these results vis à vis the hierarchical formation of the Galactic halo from accretion of dSph-like systems.
1.2 The Dwarf Spheroidal Galaxies
The unassuming dwarf spheroidal galaxies (dSphs) are so diffuse that they hardly appear to be galaxies (or anything at all, really) when inspected by eye in images. They appear instead to be regions of slightly enhanced stellar density (Fig. 1.1.) Yet their reality as distinct systems is clearly confirmed by photometric and kinematic studies (see the review of Mateo 1998 and references therein.) DSph stellar density contours are elliptical - hence the “spheroidal” portion of the moniker. By contrast, dwarf elliptical galaxies (dE’s) such as the Andromeda satellite M32, while also elliptical, possess compact, dense cores. As such, they are immediately identifiable as a different class of objects than the dSphs (not to mention immediately identifiable as objects at all.)
Dwarf spheroidal galaxies are gas poor, show no signs of recent star formation, and lack angular momentum. In these respects, they are diametric opposites to dwarf irregular galaxies (dIrr’s) such as the Magellanic Clouds, which show strong signs of not just re-cent but ongoing star formation. The stellar populations of dSphs are predominantly old and intermediate age. The pre-SDSS “classical” dSphs possess both, while the UFDs are nearly exclusively old. Dwarf ellipticals are also gas poor, lack angular momentum, and are dominated by old and intermediate age populations, but recent star formation is observed. The dIrr’s possess old, intermediate age, and young populations. The reader is referred to the reviews of Mateo 1998, Grebel 2001, Tolstoy et al. 2009, Belokurov 2013, and the next section for details and references.
The UFDs extend the dSph class of galaxies to significantly fainter/lower ranges of absolute magnitude MV, surface brightnessµV, and radius than occupied by the classical dSphs (Tolstoy et al. 2009). While UFDs like Canes Venatici I are clearly galaxy-size, others have dimmer MV, lowerµV, and smaller r1/2 (half light radius) than many globular
Figure 1.1: Fig.1 of Smecker-Hane et al. 1994, a B band montage of the Carina dwarf spheroidal galaxy. Carina’s half light radius is 5.7 arcminutes (McConnachie 2012). Repro-duced by permission of the AAS.
globular clusters and the dSphs (classical and UFDs) occupy distinct bands in the MV-r1/2
plane, bands which intersect in the region occupied by the dimmest UFDs with the smallest radii. This begs the question : are the UFDs galaxies or star clusters?
are generally thought to be dSphs. Koch et al. 2009, for instance, constrained Boötes II’s M/L to 98, with lower and upper limits of 84 and 420, based on tidal arguments (§1.6).
1.3 Isochrones
1.3.1 Isochrones as Stellar Populations
“Isochrone” is a word constructed from Greekiso, “equal”, andchronos,“time”. From this etymology one gets the essential idea ofisochronesas stellar population models : an isochrone is a model of a population of stars of uniform age (and for the sake of simplicity, of uniform composition as well.) While even globular clusters are not remotely such simple populations (though we formerly thought them to be - see the review of Gratton et al. 2012), isochrones have proven to be of immense value in understanding a range of stellar systems.
Figure 1.3 shows fits of Dartmouth isochrones to the color-magnitude diagram (CMD) of globular cluster M92 from Dotter et al. 2007. These fits show us that M92’s population is consistent with a stellar population that is 13.5 Gyr old with [Fe/H] of−2.3 (modulo distance and reddening uncertainties, also modulo model uncertainties - see §6.1 through §6.2.)
Figures 1.5 through 1.7 illustrate how isochrones tell us these things. The CMD of M92 with stellar evolutionary sequences labeled is plotted in Fig. 1.4 for illustration.
All stars begin life on the main sequence (MS) burning hydrogen in their cores. As that core hydrogen is exhausted, hydrogen fusion commences in a shell around the core and the star moves off of the MS and onto the subgiant branch (SGB). Figure 1.5 shows that the clearest indication of the age of a stellar population is the position of its main sequence turnoff (MSTO), the point where this transition between the MS and SGB is occurring.
Figure 1.3:Fits of Dartmouth isochrones to M92 from Dotter et al. 2007. The two panels are for the two different synthetic color transformations available for the isochrones (§6.2.4). Reproduced by permission of the AAS.
greater pressure leads to greater temperature and density, and therefore to higher nuclear reaction rates. The greater luminosity in turn, produces a higher effective temperature Tef f and therefore a bluer color.
Because of their higher nuclear reaction rates, more massive stars exhaust their core hydrogen more quickly than less massive stars. They thus make the transition from the main sequence to the subgiant phase first. Therefore the location of the MSTO travels down a main sequence towards less massive stars with the passage of time, and this can be used to date a stellar population.
M92 & Isochrones
Horizontal Branch
Asymptotic Giant Branch
Main Sequence
Red Giant Branch
Subgiant Branch
Figure 1.5:Plots of Dartmouth isochrones (Dotter et al. 2007, Dotter et al. 2008) of varying age.
the isochrones with greater heavy element abundances, both in terms of [Fe/H] and [α/Fe], are located lower (dimmer) and to the right (redder) in a CMD, and have red giant branches (RGBs) that are less nearly vertical and curve more.
Figure 1.6:Plots of Dartmouth isochrones (Dotter et al. 2007, Dotter et al. 2008) of varying [Fe/H]. The squares and triangles on the [Fe/H] =−0.50 and 0.00 isochrones represent stars of the same mass on the two isochrones. The triangles represent stars of mass≈0.751 M,
Figure 1.7:Plots of Dartmouth isochrones (Dotter et al. 2007, Dotter et al. 2008) of varying [α/Fe].
based on the fact that the heavy element-rich main sequence is“above” and/or to the“right” of its heavy element-poor counterpart. But this appearance is deceptive. In fact, if one has two main sequence stars of the same mass but different metallicities, the more metal-poor one will be both brighter and bluer. Fig. 1.6 shows this for main sequence stars of two different masses.
P is proportional to a power of densityρ:
P =Kρn+1n (1.1)
These models are called polytropes. The constant K depends upon the nature of the poly-trope.
If one further assumes that n = 3 and that the opacity of the stellar material obeys a Kramer’s opacity law
k =k0ρT−3.5 (1.2)
where k0 is a function of composition (Clayton 1983), then one has what is termed the “standard model" because of its good match to the properties of the Sun. For such a model,
the luminosity obeys the following relation (Clayton 1983, Carney & Harris 1998) :
LM S ∝
µ7.5M5.5 k0
(1.3)
whereµis mean molecular weight, M is the total stellar mass, and“MS” stands for“main sequence”.
Another difference between isochrones of differing compositions which is immediately apparent from a casual look at Figs. 1.6 and 1.7 is that the red giant branches of populations with greater abundances of heavy elements are redder and have shallower slopes than those of populations with lower abundances of heavy elements.
The reason that more heavy element-rich red giant branches are redder than heavy element-poor ones is that more heavy element-rich stars have greater opacity, owing to the greater numbers of electrons contributed by the larger number of heavy element atoms. The layers of these stars therefore absorb more of the outgoing photon flux, experiencing greater outward photon pressure, leading to a larger radius and a cooler, redder envelope. For cool stars such as red giants, much of the opacity comes from H−, and the metals furnish the extra electrons for neutral hydrogen to capture in order to form H−.
There are several reasons for the differences in slope and curvature between RGBs of differing compositions. As explained earlier, a higher heavy element abundance leads to a larger radius, lower effective temperature, and redder color. This effect becomes more pro-nounced as one moves up the red giant branch. Additionally, line blanketing and bolometric correction increase with increasing heavy element abundance.
of more molecular species to remain bound.
When employing isochrones to study stellar systems, the general preference is for [Fe/H] and [α/Fe] to be determined by spectroscopy while the age is determined by isochrone fitting.
At the MSTO and SGB, unless one or the other is determined, it would not be possible to disentangle the effects of age and composition, as both greater age and greater heavy element presence produce a dimmer and redder MSTO and SGB. (For more on degeneracy issues, see §6.3.)
In the middle of the RGB, the differences between isochrones of rather widely varying composition is small enough to be overwhelmed by issues of photometric uncertainty, membership, and general sparseness in that region of the CMD.
The differences between isochrones of varying composition at the tip of the RGB are rather great. Unfortunately, the tips of the RGBs of Leo IV and Boötes II are sparsely populated (see Chapter 5.) Given that these systems are thinly populated to begin with, and that stars spend a relatively short time on the RGB (compared to the main sequence), this is not surprising. In the case of Boötes II, in fact, the upper portions of the RGB presented in this study and previous ones are unpopulated. This study and previous ones find Leo IV’s upper RGB to be sparsely populated, with a single radial velocity member. Drawing conclusions concerning composition from such a basis is rather risky.
As such, this study will draw upon spectroscopic studies for [Fe/H] and [α/Fe] while employing isochrones to find the ages of Leo IV and Boötes II.
1.3.2 Isochrones and Star Formation Histories
and compositions.
“Apply” here can mean simply to overplot, as in the case of single isochrones. But a more sophisticated application involves generating a synthetic CMD which is populated from a linear superposition of isochrones (Carrera et al. 2002, Dolphin 2002, Dolphin et al. 2005).
The coefficient of each isochrone in such a linear superposition determines what fraction of the total number of stars in the synthetic CMD is drawn from the population represented by that isochrone. The resulting CMD is iteratively compared to the observed CMD of the object of study, and the coefficients adjusted to produce a better match, until the algorithm converges on a best fit.
1.4 Star Formation, Fe’s, andα’s
Fig. 1.8 (from Venn et al. 2004) plots [α/Fe] for several of the classical dwarf spheroidals and the Milky Way as a function of [Fe/H]. Several things are immediately apparent from this plot.
First, the stars of each of the classical dSphs do not possess a single metallicity, but show spreads of a dex or more in [Fe/H]. They are also more metal rich, on average, than the stars of the Milky Way halo, and possess lower abundances of the α elements for a given metallicity (Venn et al. 2004, Kirby et al. 2011). Venn et al. take the view that such differences in composition argue against the build-up of the halo from the accretion of satellites like the classical dSphs.
Large abundance spreads within a stellar system can arise through several mechanisms. Extended star formation produces successive generations of stars from gas that is ever more enriched by the nucleosynthetic products of their predecessors, assuming such gas is retained. Inhomogeneous mixing of the expelled matter of individual supernova events (again, assuming gas retention) and the merger of progenitors of differing chemistries are other possibilities.
found Carina’s star formation history to be consistent with three distinct episodes of star formation, with one corresponding to each subgiant branch. Other authors have derived star formation histories for Carina ranging from the sharply peaked (Hernandez et al. 2000, Rizzi et al. 2003) to the much more smoothly varying (Dolphin 2002). A feature common to the SFH’s of all the dwarf spheroidals is the lack of star formation within the last 2 Gyr, in contrast to dwarf irregulars like the Magellanic Clouds, which are experiencing ongoing star formation.
The UFDs also show abundance spreads in [Fe/H] of 0.5 to more than 1 dex (Simon & Geha (2007), Kirby et al. 2008, Vargas et al. 2013). Unlike the classical dSphs, however, their stars have [α/Fe] ratios typical of halo stars at any given [Fe/H]. Their metallicities are also also much lower than those of the classical dSphs.
Another major point of difference between the classical dSphs on the one hand and the UFDs and the Milky Way halo on the other is that the latter host a significant number of extremely metal poor (EMP) stars with [Fe/H]<−3, while the former do not. 10 out of 61 stars from eight UFDs observed by Vargas et al. 2013 are EMP stars. Moreover, carbon-enhanced EMP stars, another type represented in the halo, have been observed in the UFDs (Norris et al. 2010, Frebel et al. 2010). Several authors (Frebel et al. 2010, Vargas et al. 2013, Belokurov 2013) have thus suggested that systems similar to the UFDs could have supplied a large fraction of the metal poor end of the MW halo population.
system (Ryan-Weber et al. 2008).
The CMDs of the rest of the UFDs show no little or no indication of anything other than a single old, metal poor, stellar population. Brown et al. 2012 fit isochrones to HST data of Hercules, Leo IV, and Ursa Major I and find that their populations are as old as the very old globular cluster M92 (11.5±1.5 Gyr according to Di Cecco et al. 2010; 13.5±1.5 Gyr according to VandenBerg et al. 2002.) They find that there is at most a trace population of younger, more metal rich stars that is no more than 2 Gyr younger than the main population.
How are such simple star formation histories consistent with such large metallicity spreads?
Several authors (Koch et al. 2008, Simon et al. 2010, Frebel et al. 2010) have noted that the enhancedαand low neutron capture abundances of the UFDs are consistent with the predicted abundances of material ejected by supernovae from the very first generation of stars, the Population III stars. They suggest that a significant proportion of the UFDs’ stars could be the direct offspring of the first generation of stars.
1.5 Leo IV
1.5.1 Background
Leo IV was among a quintet of dwarf spheroidal galaxies uncovered by Belokurov et al. 2007 in an automated search through SDSS data (see Table 1.1 for a full list of photometric studies.) It is located well above the galactic plane at (l,b) = (265.4, 56.5). While it does lie perilously close to the intersection of the bands occupied by globular cluster’s and dSphs in Fig. 1.2, Sim07’s spectroscopic study found its M/L to be 151±177, placing it among the dSphs.
A quantity with such great uncertainty might seem like a weak reed upon which to lean for a determination of Leo IV’s status. After all, within uncertainties, Leo IV’s M/L might be−26! However, Sim07 consistently obtain such large M/L’s for the eight UFDs in their study. Even accounting for uncertainties, all the M/L’s except for Leo IV’s and Leo T’s are in the hundreds (Leo T’s M/L is determined to be 138±71, still easily making it a galaxy, even with uncertainty.) Dwarf spheroidal galaxies also appear to obey a metallicity-luminosity relation. Fig. 1.9, reproduced from Sim07 shows this relationship. The fact that the UFDs, including Leo IV at MV of−5.1, clearly extend the trend formed by the classical dSphs, strongly supports the assertion that the UFDs are the same kind of object as the classical dSphs.
Martin et al. 2008a, de Jong et al. 2010, Sand et al. 2010, Okamoto et al. 2012, and Jin et al. 2012 have derived structural parameters for Leo IV. Sand et al. 2010 found Leo IV to be very round, with ellipticityessentially zero, while de Jong et al. 2010 foundof 0.49±
Figure 1.9:Fig. 11 from Sim07. The original caption reads : “Metallicity-luminosity rela-tionship for dwarf galaxies in the Local Group. The new ultra-faint galaxies (red circles) follow the trend of decreasing metallicity with luminosity set by more luminous dwarf galax-ies (black squares). The two lowest-luminosity objects ( UMa II and Com) show possible evidence of tidal stripping. In comparison, Galactic globular clusters (blue triangles) do not follow any luminosity-metallicity relationship. Data for luminous dwarf galaxies are from Mateo (1998), Galactic globular clusters from Harris (1996), and the ultra-low luminosity dwarf Boötes (open square at MV =−5.8) from Muñoz et al. (2006a). Martin et al. (2007) find a somewhat higher metallicity for Boötes of [Fe/ H] =−2.1. The smaller horizontal bars on our galaxy measurements represent the uncertainty in the mean metallicity.” Leo IV is at MV of−5.1and [Fe/H] of−2.31. Note that this [Fe/H] value has been superseded (§1.5.2). Reproduced by permission of the AAS.
through the galaxy. de Jong et al. 2010 studied RGB and HB stars, while Sand et al. 2010 looked at MS and SGB stars.
Photometric studies by Moretti et al. 2009, de Jong et al. 2010, Sand et al. 2010, Okamoto et al. 2012, and Brown et al. 2012 have produced CMDs for Leo IV. Moretti et al. 2009 produced the first post-discovery CMD of Leo IV, locating its turnoff at V = 24.7. The deepest CMD is that of Brown et al. 2012, which used the Hubble Space Tele-scope to produce a CMD that extends more than three magnitudes below the turnoff in the Hubble 814W filter.
Moretti et al. 2009 and Okamoto et al. 2012 both produced distance estimates for Leo IV based on Cacciari et al. 2003’s MV-[Fe/H] relation for RR Lyraes, arriving at essentially the same answer. Moretti et al. 2009 found (m−M)0of 20.94±0.07 and Okamoto et al. 2012 found 20.99± 0.12. Brown et al. 2012 arrived at an apparent distance modulus of 21.15
±0.08 by fitting M92’s horizontal branch to Leo IV’s. Using the relative extinction table of Schlegel et al. 1998, one finds that the reddening for Leo IV E(B−V) = 0.05 derived by Brown et al. 2012 corresponds to AV of 0.17. This would produce an extinction corrected distance modulus (m−M)0 of 20.98.
Table 1.1:Photometric Studies of Leo IV
Study Dates of Data Telescope(s) Filters & Total
Collection Exposure Times
Belokurov et al. 2007 SDSS data
Moretti et al. 2009 March - May 2007 INT, WHT, SOAR B, V, I de Jong et al. 2010 February 2009 Calar Alto B (1950 s)
V (2600 s)
Sand et al. 2010 April 2009 MMT g, r (1250 s)
Okamoto et al. 2012 April 2008 Subaru V (630 s)
I (2830 s)
Brown et al. 2012 HST 606W (20,530 s)
814W (20,530 s)
This Study March - May 2007, SOAR V
Jan. - March 2009 30,300 s, Leo IV
8700 s, control field I
30,000 s, Leo IV 8700 s, control field
1.5.2 Composition
Sim07 performed the first spectroscopic study of Leo IV in 2007. They performed medium resolution spectroscopy using the Keck DEIMOS spectrograph, identifying 18 red giants and horizontal branch stars as Leo IV members based on radial velocity. The mean metallicity was found to be [Fe/H] =−2.31±0.10.
Kirby et al. 2008 reanalyzed that study’s data to produce a much lower value of−2.58
Table 1.2:Leo IV Literature Parameters
Parameter Martin Moretti de Jong Sand
et al. 2008a et al. 2009 et al. 2010 et al. 2010
(m−M)∗ 20.94±0.07
Distance 154±5 kpc
MV -5.0+0.6−0.5 -5.8±0.4 -5.5±0.3
LV (L) 8.7+4.4−4.7×10³ 1.8±0.8×10⁴
(ellipticity) 0.22+0.18−0.22 0.49±0.11 <0.23 r1/2 (exponential) 2.50+0.5−0.7 4.60 +0.8−0.7 2.850 ±0.640
116+26−34pc 206
+36
−31pc 127.8±28.8 pc
r1/2(Plummer) 2.860 ±0.400
128.10 ±18.0 pc
rc(King) 1.610 ±0.220
72.2±10.3 pc
rt(King) 18.550 ±4.390
831.0±196.7 pc
Parameter Brown Okamoto Jin
et al. 2012 et al. 2012 et al. 2012 (m−M)∗ 21.15±0.08 20.99±0.12
Distance 157±6 kpc∗ 158±8 kpc
MV -4.97±0.2
LV (L)
(ellipticity) 0.04 0.03+0.18−0.03
r1/2 (exponential) 2.440±0.100 2.30 +0.3−0.4 112±5 pc 1030 +13−18pc
r1/2(Plummer) 2.550 ±0.80
117±37 pc
rc(King) 1.790±0.170
82.3±7.8 pc
rt(King) 10.60±1.080
487±50 pc
∗The distance modulus of Brown et al. 2012 is an apparent distance modulus. All others are
the metallicity range −2.1 . [Fe/H] . −0.6. This relation fails, however, at very low metallicities, and the metallicities of many of Sim07’s radial velocity members certainly fall outside of the quoted range. Kirby et al. 2008 took a different tack and compared their CaT data to synthetic spectra calculated over a grid of effective temperature, surface gravity, and composition values. With a photometric estimate of effective temperature and surface gravity for a given star in hand, the [Fe/H] of the synthetic spectrum with the best match to the observed spectrum was adopted as the [Fe/H] of the star.
Finally, Kirby, employing an updated methodology (Kirby et al. 2009), once more re-analyzed all twelve of the stars rere-analyzed in Kirby et al. 2008, excepting one whose mea-surements fall short of the S/N requirements for the updated method (Josh Simon, private communication.) The reanalysis yields [Fe/H] =−0.56±0.23 for one of the stars. Not only is this measurement an outlier, at two magnitudes richer in [Fe/H] than most of the others, but its S/N is among the lowest of the data set, a S/N which would not appear to justify an uncertainty as low as 0.23. The error estimation of the new method seems to break down at low S/N (Evan Kirby, private communication.) This star is discarded for the purpose of estimation of the mean [Fe/H] of Leo IV.
Applying the maximum likelihood algorithm of Walker et al. 2006 to this set of re-maining metallicities yields a mean [Fe/H] of−2.49 ±0.18, with dispersion σp of 0.40
±0.10. This agrees rather well with the result obtained by a straightforward unweighted mean, which yields [Fe/H] = −2.46± 0.15. This study will adopt the unweighted mean [Fe/H] as the metallicity of Leo IV.
1.5.3 Leo IV & V & Crater
Leo IV and V are separated by∼3◦ on the sky and lie at similar distances (154±5 kpc (Moretti et al. 2009) and 175±9 kpc (de Jong et al. 2010) respectively), leading naturally to the speculation that they are a bound pair, a fainter counterpart to the Large and Small Magellanic Clouds. Additionally, Belokurov et al. 2014 report the discovery of another Milky Way companion, possibly a UFD, in the constellation Crater, only approximately 10◦ to the south of Leo IV & V. They also found Crater to lie at a similar distance to the Leos, at a heliocentric distance of between 145 and 170 kpc. Additionally, one can draw an approximately north-south great circle that connects all three objects. These facts suggest that there may be a connection between the three. A possible connection between Leo IV and V has already been the subject of several studies. Crater, having only recently been discovered, has not yet been the subject of such investigation.
de Jong et al. 2010 investigated this possibility, finding a bridge of stars between the two galaxies, an overdensity in RGB and HB stars running almost along the axis linking their centers. Energy and angular momentum considerations ruled out the possibility that the two are moving in tandem along a common orbit. The minimum mass required for the two to be a “tumbling pair”, to be a gravitationally bound pair of bodies orbiting their common center of mass, was calculated as being a few times 109 M
, a number which, though
large, falls within the range produced by dynamical simulations of dSphs (Penarrubia et al. 2008). Through N-body simulations, the study further determined the probability of the two galaxies becoming bound through a random collision to be on the order of 10−5. Therefore, the authors consider that the most likely scenario is that of Leo IV and V having been associated before having been captured by the Milky Way.
foreground at a distance of 20 kpc, and is most likely associated with the Virgo overdensity, an enormous, low surface brightness halo structure which is estimated to cover between 2000 and 3000 deg2on the sky (see Belokurov 2013 and references therein.)
Blaña et al. 2012 performed a more sophisticated analysis than de Jong et al. 2010 to derive the masses that Leo IV and V would have if bound. They treated the galaxies as rigid potentials rather than point masses and calculated what masses were necessary to keep their maximum separation at or below the virial radius of the smaller one, deriving masses on the order of 1010M. While large, the M/L ratio inferred from these masses do fall along
the observed trend of log( M/L ) vs. MV for dSphs extrapolated to the MV of Leo IV and V (Wilkinson et al. 2006).
Table 1.3:Photometric Studies of Boötes II
Study Dates of Data Telescope(s) Filters & Total
Collection Exposure Times
Walsh et al. 2007 SDSS data
Walsh et al. 2008 June 2007 MMT g (900 s) r (1200s)
Koch et al. 2009 May 2007 INT g (2700 s)
i (1800 s) This Study May - June 2007 SOAR V (9540 s)
I (9720 s)
1.6 Boötes II
Boötes II was discovered in a search through SDSS data by Walsh et al. 2007 high above the galactic plane at (l,b) of (353.7,68.9). It is, even today, a rather understudied object. To date, there are only two studies dedicated solely to it aside from the discovery paper and this thesis, Walsh et al. 2008 and Koch et al. 2009. Basic parameters derived by these studies are tabulated in Table 1.4. Information about the photometric studies themselves is given in Table 1.3.
Table 1.4:Boötes II Literature Parameters
Parameter Walsh et al. 2007 Martin et al. 2008b Walsh et al. 2008 Koch et al. 2009
(m−M)∗ 18.9±0.5 18.1±0.06 18.3±0.2
Distance 60±10 kpc 42±1.6 kpc 46±4 kpc
MV −3.1±1.1 −2.7±0.9 −2.3±0.7
LV (L) 1.0±0.8×10³
ε(ellipticity) 0.21±0.21 0.34±0.15 r1/2(exponential) 4.00 ±1.90 4.2−0+1.11.4 2.60±0.80
51±17 pc 33±10 pc 56+8−6pc r1/2 (Plummer) 4.10 ±1.60 2.80±0.70 4.00−+0.70.3
36±9 pc rc(King)
25±9 pc rt(King)
155±35 pc
∗ Koch et al. 2009’s distance modulus is extinction corrected. Walsh et al. 2007 and 2008
do not make clear whether their distance moduli are apparent or extinction corrected.
dispersion of 10.5±7.4 km/s.
Questions of the nature of Boötes II naturally arise given its low brightness and small radius. Along with Willman 1 and Segue 1, it falls squarely in the region of MV-rh space that lies between the classical dSphs and the Milky Way’s globular clusters. The answer hinges on whether or not Boötes II is dark matter dominated. If it is, it is a dSph. If not, it may be some kind of star cluster.
There is insufficient radial velocity data to reliably calculate a velocity dispersion, from which a mass-to-light ratio can be derived, as Koch et al. 2009 noted. Walsh et al. 2008 calculated an estimate based on the minimum mass required for Boötes II to remain gravi-tationally self bound while in the Milky Way’s potential well. They derived M/L of 98, with lower and upper limits of 84 and 420.
massive galaxies have higher metallicities because their deeper potential wells retain gas for longer times, allowing for more extended star formation from more enriched material.
Relative to the documented trends, Boötes II is too metal rich by ∼1 dex in [Fe/H]. This could indicate that Boötes II was once more massive than it presently is, having been stripped down to its current size by tidal interactions with the Milky Way. Walsh et al. 2008 found that Boötes II might show signs of tidal distortion. It appears to be enlongated along the direction of the Galactic potential gradient. However, they also found this elongation not to be statistically significant.
It is possible that the mass-luminosity relation does not hold at dimmer luminosities and lower masses. At MV . −6, the [Fe/H]-MV trend is approximately linear. At MV ∼ −6 the trend appears to flatten out, and there are signs of it turning up at MV >−4. Boötes II is in this last range, and it is kept company there by Ursa Major II and Coma Berenices. These latter two are also too metal rich given their brightnesses, if the linear trend does indeed continue to such dim luminosities (Sim07). They also show signs of tidal stripping. In short, one cannot say based on these UFDs whether or not the metallicity-luminosity trend holds at very low brightnesses.
Koch et al. 2009 also floated the suggestion that whether star cluster or dSph, that Boötes II was formerly associated with Sagittarius. This is based on the proximity in projection on the sky of Boötes II and the northern leading arm of the Sagittarius stream, and the similarity in distance and radial velocity of the two. They compared Boötes II’s positional and kinematic properties with the Sagittarius stream’s and conclude that it is possible that Boötes II was stripped from Sagittarius.
CHAPTER 2 : OBSERVATIONS
All objects were observed with the SOI (SOAR Optical Imager) instrument on the SOAR (SOuthern Astrophysical Research) telescope in Chile in the Johnson-Cousins V and I filters. The SOI imager has a field of view of 5.24×5.24 arcmin2 at a pixel scale of 0.00077. With 2×2 binning, that translates into 0.00154 for the binned pixels.
Leo IV was observed over five nights in 2007 and three nights in 2009. For purposes of statistical subtraction of foreground contamination, a control field for Leo IV centered at (α,δ) of (11:32:56.7,−00:41:59.3) was observed on three of the 2007 nights. (In galactic coordinates, this would be (l,b) = (265.6, 56.4), compared to (l,b) = (265.4, 56.5) for Leo IV. Note that this difference in position is many multiples of Leo IV’s exponential r1/2 of
∼ 2.50, or 0.04◦ (Table 1.2.)) Boötes II was observed on two of the same nights as Leo IV in 2007 plus one additional night in 2007. Foreground contamination is low enough for Boötes II that statistical subtraction of foreground objects was deemed unnecessary and no control field was observed for it. Landolt 1992 standard stars were observed on several of the aforementioned nights.
Total observation times for the objects are as follows : 30300 s in V and 30000 s in I for Leo IV; 8700 s in V and 8700 s in I for Leo IV’s control field; 9540 s in V and 9720 s in I for Boötes II.
Table 2.1:Leo IV Observations
Filter Date U.T.a Exposure (s) FWHM (arcsec)
2007
V Mar 23 02:06 300 0.82
V Mar 23 02:14 300 0.84
V Mar 23 02:19 300 0.83
I Mar 23 02:25 300 0.69
I Mar 23 02:30 300 0.65
I Mar 23 02:36 300 0.65
V Mar 23 02:56 1800 0.66
V Mar 23 03:26 1800 0.66
V Mar 23 03:56 1800 0.66
I Mar 23 04:29 1800 0.65
I Mar 23 05:00 1800 0.54
I Mar 23 05:36 1800 0.52
V Apr 10 00:48 300 0.94
V Apr 10 01:02 1200 1.10
V Apr 10 01:24 1200 0.86
I Apr 10 01:45 1200 0.70
V Apr 10 03:07 1200 1.07
I Apr 10 03:28 1200 0.86
Table 2.1 – continued from previous page
Filter Date U.T.a Exposure (s) FWHM (arcsec)
V Apr 12 01:35 300 1.02
V Apr 12 01:42 300 1.06
V Apr 12 01:47 300 0.99
I Apr 12 01:53 300 0.91
I Apr 12 01:58 300 0.86
I Apr 12 02:04 300 0.85
I Apr 12 02:17 1200 0.83
I Apr 12 02:37 1200 0.80
I Apr 12 02:57 1200 0.83
V Apr 12 03:20 1200 0.91
V Apr 12 03:41 1200 0.86
V Apr 12 04:01 1200 0.92
V May 16 23:15 300 0.90
V May 16 23:21 300 0.92
V May 16 23:26 300 0.77
I May 16 23:33 300 0.75
I May 16 23:38 300 0.70
I May 16 23:43 300 0.65
V May 18 00:08 300 0.75
I May 18 00:13 300 0.54
Table 2.1 – continued from previous page
Filter Date U.T.a Exposure (s) FWHM (arcsec)
I May 18 00:27 1200 0.62
V May 18 00:48 1200 0.68
2009
V Jan 30 05:03 600 0.91
I Jan 30 05:14 600 0.72
V Jan 30 05:26 600 0.82
I Jan 30 05:38 600 0.71
V Jan 30 05:48 600 0.82
I Jan 30 06:01 600 0.72
V Jan 30 06:12 600 0.88
I Jan 30 06:22 600 0.82
V Jan 30 06:33 600 0.91
I Jan 30 06:44 600 0.71
V Jan 30 06:55 600 0.74
I Jan 30 07:06 600 0.65
I Jan 30 07:38 600 0.69
I Jan 30 07:51 600 0.71
V Jan 30 08:02 600 0.75
I Jan 30 08:27 600 0.71
V Jan 30 08:39 600 0.75
Table 2.1 – continued from previous page
Filter Date U.T.a Exposure (s) FWHM (arcsec)
V Jan 31 05:21 600 0.97
I Jan 31 05:32 600 1.02
V Jan 31 05:43 600 1.09
I Jan 31 05:53 600 1.03
V Jan 31 06:16 600 0.75
I Jan 31 06:26 600 0.65
V Jan 31 06:37 600 0.72
I Jan 31 06:53 600 0.63
V Jan 31 07:04 600 0.62
I Jan 31 07:19 600 0.74
V Jan 31 07:29 600 0.68
I Jan 31 07:39 600 0.68
V Jan 31 07:50 600 0.69
I Jan 31 08:01 600 0.55
V Jan 31 08:12 600 0.63
I Jan 31 08:23 600 0.54
V Jan 31 08:33 600 0.69
I Jan 31 08:43 600 0.63
V Mar 7 06:29 600 0.80
I Mar 7 06:40 600 0.74
Table 2.1 – continued from previous page
Filter Date U.T.a Exposure (s) FWHM (arcsec)
V Mar 7 06:50 600 0.88
I Mar 7 07:01 600 0.74
V Mar 7 07:11 600 0.83
I Mar 7 07:22 600 0.71
V Mar 7 07:32 600 0.77
I Mar 7 07:42 600 0.60
V Mar 7 07:53 600 0.74
I Mar 7 08:03 600 0.63
aTimes are given for mid-exposure.
Table 2.2:Leo IV Control Field Observations
Filter Datea U.T.b Exposure (s) FWHM (arcsec)
I Mar 23 05:59 300 0.69
V Mar 23 06:08 300 0.71
V Mar 23 06:21 300 0.63
I Mar 23 06:28 300 0.61
I Mar 23 06:47 1800 0.69
V Mar 23 07:20 1800 0.85
Table 2.2 – continued from previous page
Filter Datea U.T.b Exposure (s) FWHM (arcsec)
I May 16 23:59 1200 0.77
I May 17 00:19 1200 0.79
I May 17 00:39 1200 0.79
V May 17 01:01 1200 1.00
V May 17 01:21 1200 1.02
V May 17 01:41 1200 0.85
V May 18 01:04 300 0.74
I May 18 01:09 300 0.69
I May 18 01:23 1200 0.66
I May 18 01:43 1200 0.69
V May 18 02:03 1200 0.77
V May 18 02:23 1200 0.72
aAll dates are in 2007.
Table 2.3:Boötes II Observations
Filter Datea U.T.b Exposure (s) FWHM (arcsec)
V May 17 02:11 300 0.85
I May 17 02:17 300 0.85
I May 17 02:30 1200 0.72
V May 17 02:51 1200 0.82
V May 17 03:12 1200 0.80
I May 17 03:32 1200 0.91
V May 18 02:41 60 0.85
V May 18 02:42 60 0.83
V May 18 02:43 60 0.89
I May 18 02:45 60 0.72
I May 18 02:46 60 0.75
I May 18 02:47 60 0.66
I May 18 02:50 300 0.68
V May 18 02:56 300 0.80
V May 18 03:07 900 0.77
V May 18 03:22 900 0.65
V May 18 03:37 900 0.63
I May 18 03:53 900 0.55
Continued on next page aAll dates are in 2007.
Table 2.3 – continued from previous page
Filter Datea U.T.b Exposure (s) FWHM (arcsec)
I May 18 04:09 900 0.60
I May 18 04:24 900 0.60
I Jun 17 23:43 120 0.79
I Jun 17 23:45 120 0.85
I Jun 17 23:47 120 0.80
V Jun 17 23:51 120 0.95
V Jun 17 23:53 120 1.00
V Jun 17 23:55 120 0.94
I Jun 18 00:05 900 0.79
I Jun 18 00:21 900 0.77
I Jun 18 00:37 900 0.94
I Jun 18 00:53 900 0.92
V Jun 18 01:10 900 0.97
V Jun 18 01:26 900 1.02
V Jun 18 01:41 900 1.09
V Jun 18 01:57 900 0.94
aAll dates are in 2007.
Table 2.4:Landolt 1992 Standard Star Observations
Field Filter Datea U.T.b Exposure (s) FWHM (arcsec)
SA 98 V Mar 23 00:46 5 0.85
V Mar 23 00:48 5 1.03
V Mar 23 00:49 3 0.83
I Mar 23 00:53 3 0.68
I Mar 23 00:56 2 0.69
Ru 149 V Mar 23 01:19 4 0.79
V Mar 23 01:20 4 0.77
I Mar 23 01:23 3 0.85
I Mar 23 01:25 3 0.69
I Mar 23 01:26 3 0.68
PG 0918+029 V Mar 23 01:35 5 0.66
V Mar 23 01:36 5 0.85
I Mar 23 01:40 3 0.80
I Mar 23 01:41 4 0.66
I Mar 23 01:41 4 0.74
PG 0942-029 V Mar 23 01:50 15 0.75
V Mar 23 01:52 15 0.75
I Mar 23 01:56 15 0.69
Continued on next page aAll dates are in 2007.