CONSERVATION OF THE LONGLEAF PINE ECOSYSTEM: ECOLOGY AND SOCIAL CONTEXT
Jennifer Kwasny Costanza
A dissertation submitted to the faculty of the University of North Carolina at Chapel Hill in partial fulfillment of the requirements for the degree of Doctor of Philosophy in Ecology in the Curriculum for the Environment and Ecology.
Chapel Hill 2010
ii
© 2010
iii
ABSTRACT
Jennifer Kwasny Costanza: Conservation of the longleaf pine ecosystem: ecology and social context
(Under the direction of Aaron Moody)
Worldwide, ecosystems are increasingly influenced by human actions and land use. As a result, landscapes include a mosaic of human land uses along with fragments of relatively natural habitat. Effective conservation requires a consideration of both local sites and the broader social and ecological landscape in which they occur. Partnerships among multiple landowners have become a popular way to implement conservation across broad extents because they can be effective at integrating ecological goals with their social context. My research examines how collaborative partnerships conduct conservation in the longleaf pine ecosystem of the US southeast. Longleaf pine communities provide important habitat for many plants and animals, and when frequently burned, can have among the highest levels of plant diversity of any ecosystem in the world. However, the ecosystem has become severely degraded, and several collaborative partnerships have been established with the goal of restoring the ecosystem.
iv
three collaborative partnerships in the conservation of longleaf pine ecosystems. Finally, I investigate how decisions are made about prescribed burning, a major management tool for restoring the longleaf pine ecosystem.
My results illustrate that heterogeneity in environmental variables measured across a range of scales is related to local plant diversity, suggesting that incorporating broad-scale context into conservation efforts in the longleaf pine ecosystem is
important. In addition, a focus on long-term ecosystem sustainability drives the
v
To my parents, who taught me the value of education and hard work. and
To Adam, who reminds me to have fun.
In loving memory of my grandma, Priscilla Slamkowski.
vi
ACKNOWLEDGEMENTS
I have been amazed by the many talented, intelligent people who have
surrounded me throughout my graduate career. There are many people who helped me with this research and to whom I owe a debt of gratitude.
First, I thank my advising committee. Aaron Moody has always given me the freedom to pursue the research questions that interest me. I appreciate Peter White for fostering my critical thinking on issues related to conservation. Bob Peet has been extremely supportive and encouraging throughout my graduate career. Thanks to Sam Pearsall for providing the unique insights of a conservation professional who excels at thinking critically across disciplines. Cecil Frost has let me share his love of landscape fire ecology and I have enjoyed collaborating with him.
Many people provided technical and financial support. Jack Weiss shared with me only a portion of his vast statistical genius, but his assistance was critical to my analysis. He is most surely the greatest resource in the UNC Ecology Curriculum. UNC’s Odum Institute staff, particularly Teresa Edwards, helped with my survey design and analysis. Margit Bucher and the staff of The Nature Conservancy offered me the opportunity to conduct research that was applicable to real-world conservation. Bob Peet and the Carolina Vegetation Survey staff were kind enough to let me use their data.
vii
Chunco have made my work interesting and enjoyable. Todd Jobe’s knowledge of analytical tools in ecology is outstanding; his ability to share his knowledge with others is truly impressive.
Other students in Geography, Ecology, and Biology have been instrumental parts of my graduate career. I could not have made it through my last year of research and writing without the help of my weekly writing group: Amanda Chunco, Brooke Wheeler, and Lisa Mangiamele. They read much of my dissertation and provided helpful
comments, but more importantly, offered indispensable support and encouragement. Brooke Wheeler provided continued camaraderie: our writing sessions in Wilson Library helped me complete my dissertation. Monica Smith and Lauren Patterson have also been smiling faces who I enjoyed meeting for coffee or lunch on campus and off.
viii
TABLE OF CONTENTS
LIST OF TABLES ... xiii
LIST OF FIGURES ... xiv
Chapter 1. INTRODUCTION ... 1
Background and aim of dissertation ... 1
Chapter summaries ... 5
References ... 8
Figure ...10
2. MULTI-SCALE HABITAT HETEROGENEITY AS A PREDICTOR OF PLANT SPECIES RICHNESS ON THE SOUTHEAST COASTAL PLAIN, USA ...11
Keywords ...12
Introduction ...12
Methods ...15
Study Area ... 15
Data ... 16
Analysis ... 19
Results ...22
Discussion ...24
Conclusions ...32
ix
Tables ...37
Figures ...41
3. LESSONS LEARNED IN COLLABORATIVE CONSERVATION: STRATEGIES USED BY PARTNERSHIPS IN THE LONGLEAF PINE ECOSYSTEM ...45
Abstract ...45
Keywords ...46
Introduction ...46
Background: conservation of the longleaf pine ecosystem ...48
Objective 1: Improve and maintain existing longleaf pine habitat ... 49
Objective 2: Expand and connect habitat in a coordinated fashion ... 50
Objective 3: Improve management on privately-owned forest lands ... 51
Objective 4: Promote a variety of land uses across the remainder of the landscape that are compatible with conservation objectives ... 51
Methods ...52
Partnerships included ... 52
Interviews ... 54
Results ...55
Strategy 1: Find common ground among all partners while leveraging the strengths of individual partners ... 55
Strategy 2: Facilitate communication and information sharing among partners ... 56
Strategy 3: Establish a mechanism for sharing resources among partners ... 58
Strategy 4: Focus on public outreach via a consistent message ... 59
Strategy 5: Develop a channel of communication with local governments ... 60
Challenges for partnerships ... 61
x
References ...68
Tables ...72
Figure ...74
4. STAKEHOLDER PRIORITIES AND RISK PERCEPTION IN COLLABORATIVE MANAGEMENT OF PRESCRIBED BURNING ...75
Abstract ...75
Keywords ...76
Introduction ...76
Methods ...80
Study area ... 80
The longleaf pine ecosystem ... 81
Surveys ... 82
Analysis ... 84
Results ...85
Constraints ... 85
Criteria for prioritization ... 86
Rationales ... 87
Discussion ...89
Conclusions ...95
References ...97
Tables ... 101
Figures ... 102
5. RISKS, BENEFITS, AND THE POTENTIAL FOR RESTORATION OF A FIRE-DEPENDENT ECOSYSTEM ... 108
xi
Keywords ... 109
Introduction ... 109
Study system and area... 113
The longleaf pine ecosystem ... 113
The Onslow Bight... 114
Methods ... 115
Collection of prescribed burn data ... 115
Spatial analysis of prescribed burn criteria ... 117
Statistical analysis ... 119
Results ... 123
Discussion ... 125
Conclusions ... 130
References ... 131
Tables ... 135
Figures ... 139
6. CONCLUSION ... 145
Summary of major conclusions ... 145
Fundamental contributions ... 146
Future directions ... 147
Implications for collaborative partnerships ... 151
References ... 155
xii
xiii
LIST OF TABLES Table
2.1 Scales, grain sizes, predictor variables,
and metrics included in heterogeneity analysis………...37 2.2 Results from univariate mixed effects models………..38 2.3 Results of model comparison among the best
univariate models for each extent……….39 2.4 Percentage of longleaf versus non-longleaf vegetation
plots that fall within each habitat type………...40 3.1 The ways in which each collaborative strategy helps address
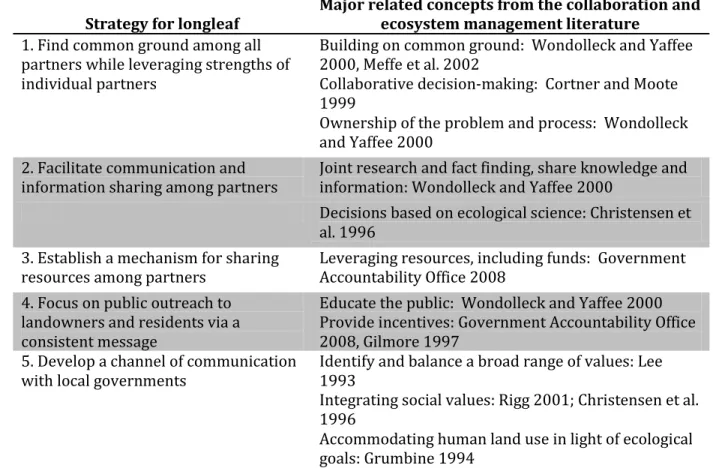
conservation objectives in the longleaf pine ecosystem………..72 3.2 Strategies for collaborative conservation of the longleaf
pine ecosystem, and related concepts in the literature………73 4.1 Ecological and non-ecological burn priority criteria named by
focus group participants and used in the online surveys……….101 5.1 Criteria for decisions about prescribed burning, and
corresponding predictor variables used in analysis………...135 5.2 Variables included as predictors, and results of Wald tests for
significance in three optimal multiple regression models………….……….136 5.3 Area and percent of longleaf pine sites treated with prescribed
burning by the six management agencies in the Onslow Bight………137 5.4 Confusion matrices for optimal models using only ecological,
xiv
LIST OF FIGURES Figure
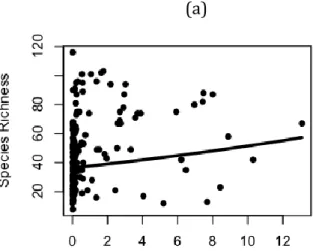
1.1 Overall framework for ecosystem conservation………..10 2.1 Study area in the Middle Atlantic Coastal Plain ecoregion……….41 2.2 The relationship between species richness and three
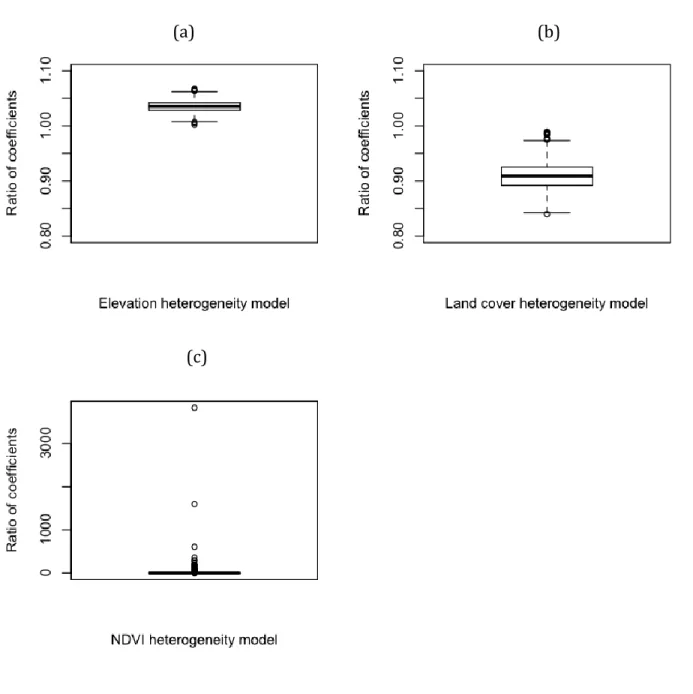
scales of heterogeneity……….42 2.3 Boxplots showing the posterior distributions of the ratio
of level-1 to level-2 coefficients from the MCMC analysis………..43 2.4 Boxplots showing the distribution of heterogeneity among
plots in longleaf pine communities versus non-longleaf plots………44 3.1 Locations of the three collaborative partnerships
in which interview subjects participate……….74 4.1 The Onslow Bight landscape……….102 4.2 Constraints on burning and their mean importance
for all respondents………..….103 4.3 Mean number of important ecological and non-ecological
criteria named per respondent in each stakeholder group……….……..….104 4.4 Proportion of survey respondents who indicated each
criterion is important for determining burn priorities……….105 4.5 Proportion of survey respondents who agreed with each
rationale related to the ecological benefits of burning………...……106 4.6 Proportion of survey respondents who agreed with each
rationale related to the risks of burning……….107 5.1 Onslow Bight study area, showing the locations of the
six management agencies included………139 5.2 Effect of distance from development on the probability a site
was burned, with increasing time since the last burn on a site………140 5.3 Receiver operating characteristic (ROC) curve for the three
xv
5.5 Odds ratios for the model with non-ecological predictors……….….143 5.6 Effect of distance to development on the probability of a site being
CHAPTER 1 INTRODUCTION
Background and aim of dissertation
Worldwide, ecosystems are increasingly influenced by human actions and land use. As a result, landscapes include a mosaic of human land uses, with fragments of relatively natural habitat. Because ecological processes occurring locally are influenced by processes that operate across larger extents, effective conservation requires a consideration of both local sites and the broader social and ecological landscape in which they occur. For example, the configuration of habitats, along with the intensity of human land uses in a landscape, helps determine which plant or animal species are able to disperse to any given habitat patch (Turner et al. 2001).
As the importance of ecological processes across large scales has become apparent, ecosystem management has become a dominant paradigm for achieving broad-scale conservation over the last twenty years (Meffe et al. 2002, Yaffee 1999). Rather than focusing on traditional single species or resource-based approaches, ecosystem management takes a holistic viewpoint, recognizing the complexity of ecological processes situated within their social and ecological contexts at broad extents (Christensen et al. 1996).
2
partnerships have been established across the United States (Keough and Blahna 2006, Doyle and Drew 2008). For instance, conservationists and ranchers in the western US have been able to preserve habitat while improving commodity production by working collaboratively toward a common vision of protecting open spaces (Keough and Blahna 2006). In several partnerships in the eastern US, the Department of Defense has played a crucial role in restoring the longleaf pine ecosystem, while the land managed by the agency has also been used to support military training and human recreation
(Rosenzweig 2003). These partnerships are becoming increasingly important ways in which to address conservation goals across broad extents as the human population grows and habitat becomes more fragmented. Collaborative partnerships have been successful at accomplishing ecosystem-based conservation because they can be effective at integrating ecological goals with their social context (Keough and Blahna 2006). Thus, while collaborative partnerships often aim to conserve and restore individual sites, they also implement strategies that affect the broader ecological and social context of these sites. Their management decisions are, in turn, affected by site-level characteristics and social and ecological characteristics of the surrounding landscape (Stankey et al. 2005).
This dissertation aims to examine the links among ecological processes at local sites, their broader context, and the collaborative partnerships that conduct ecosystem conservation (Figure 1.1). My research addresses the following general questions:
3
2. What strategies do successful collaborative conservation partnerships employ to affect conservation objectives addressing site-level conditions as well as the social and ecological context of sites? (Chapter 3)
3. How do site-level conditions and the context of sites influence the ecosystem management decisions of collaborative partnerships? (Chapters 4 and 5) I address my research questions in the context of conservation of the longleaf pine ecosystem in the Southeast US. The longleaf pine ecosystem is an important conservation target. This ecosystem provides essential habitat for a diversity of plant species and several endangered animal species (Van Lear et al. 2005). When frequently burned, longleaf pine ecosystems have among the highest number of plant species at small scales of any ecosystem in the world (Peet and Allard 1993). Due to widespread timber harvesting and fire suppression, the ecosystem has been severely degraded and fragmented, reducing this forest type to a mere 2% of its pre-European settlement range (Frost 2006). As a result, many species that depend on longleaf pine habitat have declined (Van Lear et al. 2005). This decline has prompted Noss et al. (1995) to
designate the ecosystem as “critically endangered”, and others to call for large-scale restoration involving prescribed burning (Landers et al. 1995, America's Longleaf 2009). Several collaborative conservation partnerships have been established with the aim of large-scale restoration of the longleaf pine ecosystem.
4
process. These issues are each relevant to a different stage in collaboration, from setting objectives, to determining strategies that will accomplish those objectives, to
implementing those strategies. First, in order to achieve conservation goals locally, partnerships must know how and at which scales they should focus their efforts in the broader landscape. Affecting the wrong processes or focusing at inappropriate scales can lead to wasted time or resources for partnerships (Meffe et al. 2002). My research examines the precise scales at which the surrounding landscape influences ecological processes at local sites, and more clearly establishes the link between local sites and their social and ecological contexts. The result gives conservation partnerships better information about where and how to focus their broad-scale efforts.
Second, after establishing conservation objectives, it is important to know which strategies may be most effective for accomplishing those objectives, and which will ensure long-term sustainability of ecosystems. My research investigates the strategies used by successful partnerships and offers a set of guidelines that will inform
partnerships about which strategies to implement. Finally, even when the strategies for implementing ecosystem management have been established, implementing them can be challenging. Managing complex ecosystems inherently involves risk and uncertainty, and failing to acknowledge risk may make it difficult to accomplish management
objectives. This, in turn, can lead to further ecosystem degradation (Stankey et al.
5
Chapter summaries
Each of my dissertation chapters addresses one or more links among local ecological processes, their social and ecological context, and the efforts of collaborative conservation partnerships in the longleaf pine ecosystem (Figure 1.1). In chapter 2, I consider the link between local plant communities and broad-scale ecological and social factors in the Southeast Coastal Plain ecoregion. When trying to detect the effects of large-scale processes on local communities, it is often difficult to know which variables to use and at which scales to measure them. Using data from a variety of vegetation types in the region, I explore the relationship between local plant species richness and multiple scales of heterogeneity measured with multiple variables. Because the
Southeast Coastal Plain contains a high level of plant diversity and endemism (Sorrie and Weakley 2001), local plant species richness is an important ecosystem
conservation target there. I show that the best predictor of local plant species richness depends on spatial extent. In particular, at the largest spatial extent measured,
heterogeneity of land cover predicts plant species richness better than plant
productivity and elevation, and longleaf pine communities occur in regions with the most heterogeneity in land cover. The regional scale in this analysis covered extents of 38,000 ha to 705,000 ha, approximately the scale of a watershed or landscape. The correlation between regional heterogeneity and local richness indicates that
conservation efforts must consider the larger landscape when aiming to conserve local sites. The results of this study could help collaborative partnerships who work at similar scales better determine how to focus their efforts, and underscore the
6
Once partnerships determine which conservation objectives are important, they must determine which strategies to use to accomplish their objectives. In chapter 3, I examine the strategies used by collaborative partnerships in the longleaf pine
ecosystem. I present the results from interviews of participants in three collaborative partnerships in the ecosystem. I show how the fire management strategies used by these three partnerships relate to longleaf pine conservation objectives on individual sites and across regions. Each of these strategies helps to facilitate adaptive
management on existing conservation lands and affects the larger landscape context. In particular, they all help alleviate the biggest challenge for conservation and restoration in the longleaf pine ecosystem: how to conduct prescribed burning at ecologically significant scales.
In chapters 4 and 5, I investigate how site-level characteristics and the ecological and social context of sites affect decisions about ecosystem management of longleaf pine. In particular, I determine how stakeholders in a collaborative conservation
partnership make decisions about prescribed burning. In these two chapters, I focus on the Onslow Bight, a region on the coastal plain of North Carolina where a partnership has been established for longleaf pine conservation. The region contains a mix of land uses, including rural residential, protected areas, and commodity producing lands.
7
Bight. I use records of recent prescribed burns from Onslow Bight management agencies to show how a suite of ecological and non-ecological factors are related to prescribed burning activity. I extend the findings of chapter 4 to show explore the interaction between the time since a site was last burned and its distance from development: for sites that had not burned in four or more years, burning increased with distance from developed areas. The results from these two chapters indicate that both site-level factors and the configuration of social and ecological factors in the landscape influence management decisions.
In chapter 6, I synthesize the results from each chapter and discuss how my research contributes to the field of conservation biology. I then suggest future
8
References
America's Longleaf. 2009. Range-wide conservation plan for longleaf pine. Available online at: www.americaslongleaf.org.
Christensen, N. L., A. M. Bartuska, J. H. Brown, S. Carpenter, C. M. D'Antonio, R. Francis, J. F. Franklin, J. A. MacMahon, R. F. Noss, D. J. Parsons, C. H. Peterson, M. G. Turner, and R. G. Woodmansee. 1996. The Report of the Ecological Society of America Committee on the Scientific Basis for Ecosystem Management. Ecological Applications 6:665-691.
Doyle, M., C. Drew. 2008. Large-scale ecosystem restoration: five case studies from the United States. Island Press, Washington, D.C., USA.
Frost, C. C. 2006. History and future of the longleaf pine ecosystem. Pages 9-48 In S. Jose, E. Jokela, and D. Miller, editors. Longleaf pine ecosystems: ecology,
management, and restoration, Springer, New York, New York, USA. Keough, H., D. J. Blahna. 2006. Achieving integrative, collaborative ecosystem
management. Conservation Ecology 20:1373-1382.
Landers, J. L., D. H. Van Lear, and W. D. Boyer. 1995. The longleaf pine forests of the Southeast: requiem or renaissance? Journal of Forestry 9:39-44.
Meffe, G. K., L. A. Nielsen, R. L. Knight, and D. A. Schenborn. 2002. Ecosystem
Management: Adaptive, Community-based conservation. Island Press, Washington, DC.
Noss, R. F., E. T. LaRoe, and J. M. Scott. 1995. Endangered ecosystems of the United States: a preliminary assessment of loss and degradation. Biological report 28. National Biological Service, Washington, D.C., USA.
Peet, R. K., and D. J. Allard. 1993. Longleaf pine vegetation of the southern Atlantic and eastern Gulf Coast regions: a preliminary classification. Pages 45-81 in S. M. Hermann, editor. Proceedings of the Tall Timbers Fire Ecology Conference, No. 18, The Longleaf Pine Ecosystem: ecology, restoration and management. Tall Timbers Research Station, Tallahassee, Florida, USA.
Rosenzweig, M. L. 2003. Win-win ecology: how the earth's species can survive in the midst of human enterprise. Oxford University Press, Oxford, UK.
9
Stankey, G. H., B. T. Bormann, and R. N. Clark. 2005. Adaptive management of natural resources: theory, concepts, and management institutions. USDA Forest Service Pacific Northwest Research Station. General Technical Report PNW-GTR-654. Portland, Oregon, USA.
Stankey, G. H., B. T. Bormann, C. Ryan, B. Shindler, V. Sturtevant, R. N. Clark, and C. Philpot. 2003. Adaptive management and the Northwest Forest Plan. Journal of Forestry 101:40-46.
Turner, M. G., R. H. Gardner, and R. V. O'Neill. 2001. Landscape ecology in theory and practice: pattern and process. Springer, New York, New York, USA.
Van Lear, D. H., W. D. Carroll, P. R. Kapeluck, and R. Johnson. 2005. History and restoration of the longleaf pine-grassland ecosystem: implications for species at risk. Forest Ecology and Management 211:150-165.
Wondolleck, J. M., S. L. Yaffee. 2000. Making collaboration work: lessons from innovation in natural resource management. Island Press, Washington, DC.
10
Figure
Figure 1.1: Overall framework for ecosystem conservation, which guides the research in this dissertation. Local sites exist within and are influenced by social and ecological context. Collaborative partnerships work directly to maintain and restore local sites, as well as to influence the broader context of sites. The ability of collaborative
CHAPTER 2
MULTI-SCALE HABITAT HETEROGENEITY AS A PREDICTOR OF PLANT SPECIES RICHNESS ON THE SOUTHEAST COASTAL PLAIN, USA
Abstract
Regional assessments of biodiversity increasingly rely on modeled relationships between multi-scale environmental variables and local species data. Because ecological theory predicts a positive influence of local-, landscape-, and regional-scale spatial environmental heterogeneity on local species richness, metrics that quantify heterogeneity could be important for assessing biodiversity. However, more information is needed regarding how heterogeneity is best measured. I took a modeling approach to determine whether metrics of heterogeneity measured locally and at larger scales are useful predictors of local species richness. Local plant species richness data came from 150 vegetation plots in the Southeast Coastal Plain, USA. At each of four scales, I used either GIS or field data to derive three classes of
heterogeneity variables: abiotic factors, plant productivity measures, and locations of vegetation communities. I related those variables to plot-level plant species richness using univariate mixed effects models to determine the best heterogeneity metric at each scale. I then used Markov chain Monte Carlo sampling to fit models that
12
heterogeneity metrics were better predictors than means, and each of the three classes of variables I used had a distinct scale at which it performed better than the others. Furthermore, two measures of heterogeneity were significantly different on average for longleaf pine communities, which are important conservation targets in the region, than for other communities. These results suggest that when processes occurring at scales larger than vegetation plots need to be incorporated in regional assessments of biodiversity, heterogeneity metrics are potentially important predictors of local plant species richness.
Keywords
Carolina Vegetation Survey, elevation, land cover, productivity, landscape scale, regional scale
Introduction
Ecological theory predicts that spatially varying environments allow more species to coexist locally than homogenous environments. Environmental
13
(Pulliam 1988, Brown and Kodric-Brown 1977). Greater regional heterogeneity increases the size of the regional species pool, or the species that are available to colonize a given local area. Despite the fact that theory predicts a positive influence of environmental heterogeneity at each of these scales on local species richness, few studies have fully investigated this relationship across multiple scales. My study integrates data collected within vegetation plots using GIS and remotely sensed variables in order to examine the relative contribution of heterogeneity at local, landscape, and regional scales to local plant species richness in the Southeast US.
Relating heterogeneity measures to species richness has particular relevance to conservation. Models that relate species richness to continuous variables are important tools for assessing biodiversity across large extents. Continuous variables can provide more information about the processes responsible for biodiversity than other
approaches such as indirect mapping of biodiversity via habitat classification, which ignores variability within habitats (Nagendra 2001). In addition, models using continuous variables allow direct application of the continuum concept of ecology, in which species and their assemblages sort along gradients (Austin 1999). Therefore, it is worth examining how various types of heterogeneity relate to local species richness, and in particular whether heterogeneity measures can be useful in distinguishing species-rich communities within a region.
Thus far, little work has been done to determine which heterogeneity variables, measured using which metrics at which scales are relevant for modeling species
14
availability or vegetation structure (Gould and Walker 1997, Davies et al. 2005). Across landscapes, heterogeneity is often measured in terms of variation in land cover or vegetation productivity. Palmer et al. (2002) proposed that variation in the spectral properties of remotely sensed images should be related to species richness. A suite of image texture metrics (St-Louis et al. 2006) can be used to characterize variability in vegetation productivity across a landscape. Regional heterogeneity is most often characterized in terms of topographic, climate or land cover variation and is often summarized within the boundaries of ecoregions (Kerr et al. 2001). For each of these scales and variables, heterogeneity has been measured using a variety of metrics, including standard deviation, variance, and coefficient of variation.
In this study, I used data from vegetation communities sampled on the Coastal Plain of North and South Carolina (NC and SC), USA, to examine the relationship between local plant species richness (within 20 x 20 vegetation plots) and measures of heterogeneity. I characterized heterogeneity in terms of the variability of vegetation structure, the variability of abiotic environmental variables, and community diversity at each of four scales. For each vegetation plot, I measured heterogeneity in terms of these variables within the plot, within habitat patches, across habitats, and across regions. For each environmental variable, I computed the same suite of indices at each scale to allow comparison among variables and among scales. Specifically, I asked:
1. Are measures of heterogeneity measured locally, as well as at larger scales, useful for predicting local plant species richness?
15
I hypothesize that heterogeneity measures at all scales are useful predictors of local species richness, and all heterogeneity measures will be positively correlated with local plant species richness. Because at any given scale, the ecological processes influencing local species richness differ, I predict that the heterogeneity metric most local related to species richness will differ for each scale examined here.
Methods Study Area
The Southeast Coastal Plain provides a good context in which to study the relationship between habitat heterogeneity and plant species richness. The region is home to a rich diversity of plant species, including a large number of endemics (Sorrie and Weakley 2001). A variety of plant communities exist there as well, including
longleaf pine savannas and flatwoods, pocosins, bottomland hardwood forests, and tidal marshes. Vegetation on the coastal plain is highly influenced by soil characteristics and elevation. Species-rich longleaf pine ecosystems occur on more sandy soils, while pocosin vegetation occurs where soil organic matter content is high. Subtle changes in these soil characteristics as well as elevation and geographic distance can lead to large variation in local plant species richness in the region (Christensen 2000, Peet 2006).
Longleaf pine ecosystems are important conservation targets in the region (America's Longleaf 2009). These communities provide habitat for many plant and animal species, including the federally-endangered Red-cockaded Woodpecker
16
vegetation maps based on classification of values in satellite imagery suffer from low accuracy for longleaf pine communities (McKerrow 2006). Therefore, incorporating measures of heterogeneity into models of plant species richness may be particularly helpful for distinguishing and characterizing these diverse ecosystems.
Data
Species richness data
Species richness data came from 150 vegetation plots in NC and SC, in the Middle Atlantic Coastal Plain ecoregion (Environmental Protection Agency 2004, Figure 2.1). Plot data are part of the Carolina Vegetation Survey (CVS) database, and were collected between 1998 and 2007. CVS follows a consistent data collection protocol and is a long-term effort to inventory and characterize the plant composition in the natural
communities of the Southeast (Peet et al. 1998). Plots in the database are located throughout NC and SC, but are not uniformly distributed across the region (Figure 2.1). Plots in the CVS database vary in size, but all plots used here contain four intensively sampled 10 m x 10 m quadrats, in which the identity of each vascular plant species has been recorded and environmental data have been collected. I summed the total number of plant species across the four quadrats as my measure of plant species richness.
Heterogeneity data
17
was not measured within vegetation plots, because vegetation plots were explicitly located in areas assumed to be representative of a single community type.
For within-plot heterogeneity measures, I used habitat data collected in CVS vegetation plots. Within each of the four intensively sampled quadrats, a soil sample was collected. Soil chemistry analyses were performed on the samples by Brookside Laboratories, Incorporated, New Knoxville, Ohio. For my within-plot abiotic variables, I used measurements of soil pH and percent organic matter content taken from each quadrat. In addition to soil metrics, the basal area of all stems greater than 2.5 cm dbh was measured within each plot. I used the total basal area per quadrat, in units of m2. To calculate heterogeneity for the soil variables and basal area, I computed the
variance, standard deviation, range, and coefficient of variation (CV) of values among quadrats in each plot.
To derive heterogeneity metrics at neighborhood, within-habitat, and regional scales, I used data from GIS coverages of environmental variables. First, I delineated the extents across which heterogeneity metrics would be calculated. To delineate
neighborhoods, I employed circular buffers surrounding each plot location, with radii of 150 m, 450 m, and 1380 m, corresponding to areas of 7 ha, 64 ha, and 600 ha,
respectively. I chose these sizes because they approximate the neighborhoods
18
EPA’s Middle Atlantic Coastal Plain ecoregion. These polygons correspond to a finer level of division than Level IV ecoregions. There were 17 of these regional polygons containing vegetation plots in my study area. These regions ranged from 380 km2 to 7050 km2 (38,000 ha to 705,000 ha) in size, and had a mean area of 1821 km2 (182,100 ha).
I used three types of variables to measure heterogeneity from GIS and remotely sensed data at within-habitat, neighborhood, and regional scales: elevation,
19
Program’s (GAP) land cover map (Southeast Gap Analysis Project 2008). I calculated the variety of land cover classes, as well as Simpson’s Index (Simpson 1949) of land cover diversity. Simpson’s Index was used because it has been shown to be less sensitive to rare cover types, and thus to classification errors in land cover data, than other diversity indices (Nagendra 2002). Therefore, while land cover variety
represents the richness of land cover types, Simpson’s Index emphasizes the evenness component of land cover diversity. The DEM, Landsat NDVI and GAP data have 30 m resolution. MODIS NDVI data have a resolution of 250 m.
Analysis
To examine the effects of single measures of heterogeneity on plant species richness, I used linear mixed effects models. I fit random intercepts models using maximum likelihood estimation with region as a random effect. At each within-plot, within-habitat, neighborhood, and regional scale, I fit a separate model for each heterogeneity metric, as well as the mean. I also fit multiple regression models using each heterogeneity metric together with the mean, both with and without interaction terms. Within-plot, within-habitat, and neighborhood metrics were treated as level-1 predictor variables here, while regional metrics were level-2 predictors. By grouping the data into regions, these mixed effects models incorporate similarities among vegetation communities sampled here in a more ecologically meaningful way than would incorporating a measure of simple geographic distance.
20
generalized linear mixed models using Poisson distributions. I compared the results of these three using AIC to determine which type was most appropriate for my species richness data. To compare these models, I scaled the AIC from the log-normal models to the raw response for comparison. I fit all linear mixed effects models using the lme function in the nlme package (Pinheiro et al. 2009) in R (R Development Core Team 2009). I also fit generalized additive models (GAMs) to the species richness data using a smoother for each predictor and examined the general shape of the relationship using the mgcv package (Wood 2006) in R. Thus, I determined whether to model the
relationship as linear or to use a higher-order polynomial relationship in the linear mixed effects models.
I used the approach of Burnham and Anderson (2002) to determine which heterogeneity metrics predicted plant species richness for each variable at each scale. For models using regional variables, I computed AICc based on a sample size equal to the number of regions (groups). I used an extra sum-of-squares F-test to compare models containing each of the heterogeneity metrics for each variable type at each scale to the unconditional means model, which contains no predictors but still accounts for structure in the data because data are grouped by ecoregion. I also used the Burnham and Anderson approach to compare all heterogeneity metrics within a given scale to determine which heterogeneity variable best predicted species richness for each scale. To quantify the proportion of variation in the species richness data explained in each of the univariate models, I calculated level-1 and level-2 pseudo-R2 statistics from the
21
Next, I examined the relative effects of level-1 and level-2 heterogeneity measures together on plant species richness. Because the appropriate choice for degrees of freedom in mixed effects models is unknown, particularly when combining parameters from different levels in the model, I took a Bayesian approach for this part of my analysis. I used the arm (Gelman et al. 2010) package of R, which interfaces with WinBUGS (Lunn et al. 2000). I used Markov chain Monte Carlo (MCMC) sampling to fit mixed effects models with random intercepts containing local and regional variables. My models had locally uniform priors for fixed effects and non-informative priors for random effects, and I sampled for 10,000 iterations. This approach allowed me to sample from the posterior distributions of ratios of level-1 to level-2 coefficients
occurring at different levels of a multilevel model. I used the best heterogeneity metric for each variable, whether level-1 or level-2, and combined it with a corresponding metric calculated at the other level. Thus, the two predictors had the same units in each model, and the ratio of level-1 to level-2 coefficients corresponded to the relative
influence of the two predictors.
22
Results
GAMs fitted to smoothed predictors suggested linear relationships between species richness and all of the metrics except mean within-plot pH. A quadratic relationship was suggested for mean pH, so I used a quadratic term in all models containing mean pH. I assumed a linear relationship between plant species richness and each of the other variables. In addition, my comparison of AIC among normal, log-normal, and Poisson distributions indicated that the linear mixed effects model with normal distribution and log-transformed species richness was most appropriate, so I present results from those models here.
While the means of all variables measured within plots predicted richness better than measures of heterogeneity, at larger scales, a heterogeneity metric was always a better predictor of species richness than the mean in cases when the unconditional means model was not selected (Table 2.2). For 450 m and 1380 m within-habitat grains, heterogeneity metrics were the best predictors and better than the
23
I compared the best predictors within each scale (Table 2.3). Of all variables at the within-plot scale, mean pH was the best predictor of species richness. Within habitats, NDVI at 450 m was the best predictor and had a negative relationship with species richness. Across neighborhoods, the variance of elevation at 150 m was the best predictor, and was positively related to species richness. Across regions, land cover variety was the best predictor of plant species richness, and the relationship was positive. A comparison of models using these four predictors showed that mean within-plot pH was the best overall predictor of plant species richness. The variance of
elevation across a neighborhood with radius 150 m was the best overall heterogeneity predictor.
Results from the MCMC analysis show that the same type of heterogeneity had varying effects at local and regional scales. Because the best measure of land cover heterogeneity was regional land cover variety, I used a model combining that metric with the same metric calculated in neighborhoods within 1380 m of plot locations. The posterior distribution of the ratio of the coefficients for within-habitat and regional heterogeneity in that model had a median of 0.90 and a 95% credibility interval below 1.00 (Figure 2.3a). This indicates that on average for land cover, a one-unit change in heterogeneity surrounding vegetation plots leads to the same change in species
richness as a 0.90-unit change in regional heterogeneity does. Therefore, regional land cover heterogeneity has a greater influence on species richness than local land cover heterogeneity. For the bivariate elevation model, I combined variance measured across a 150-m radius neighborhood with regional elevation variance. The posterior
24
credibility interval greater than 1.00 (Figure 2.3b). Therefore, a one-unit change in elevation locally nearly always has a greater effect on species richness than an
equivalent regional change. Finally, I combined standard deviation of NDVI in habitat patches within 450 m from vegetation plots with regional NDVI standard deviation. The posterior distribution of the ratio is highly skewed, with a median of 0.02, and a credibility interval between 1.4 x 10⁻⁵ and 5.2 x 101 (Figure 2.3c). Thus, the ratio of level-1 to level-2 coefficients in this model is highly variable, probably because regional NDVI heterogeneity is not a significant univariate predictor.
I conducted one-sided Welch’s t-tests to test for significant differences between longleaf and non-longleaf plots in the best heterogeneity variables: NDVI within
habitats, elevation across neighborhoods, and land cover across regions. Results from the t-tests showed that NDVI heterogeneity measured within habitats was on average significantly lower for longleaf plots than for non-longleaf plots (Figure 2.4a). There was no significant difference in neighborhood elevation heterogeneity on average among longleaf and non-longleaf plots (Figure 2.4b). However, mean regional land cover heterogeneity was significantly greater for longleaf plots (Figure 2.4c). On average, longleaf plots had higher species richness (57.4 +/- 5.3 species) than non-longleaf plots (47.6 +/- 2.2 species, two-sample t(41) = 1.70, p = 0.048).
Discussion
25
scales larger than vegetation plots, local plant species richness was related to heterogeneity, and heterogeneity variables were significantly different between longleaf pine and non-longleaf communities. The strongest association between local plant species richness and heterogeneity occurred at different scales for different variables. Heterogeneity of NDVI, elevation, and land cover were the best predictors at within-habitat, neighborhood, and regional scales, respectively. Overall, among all variables at these three scales larger than plots, elevation heterogeneity across neighborhoods was the best predictor of species richness, and the relationship was positive.
Within vegetation plots, mean pH was the best predictor, and predicted species richness better than any other variable or metric used in this study. Heterogeneity likely matters at this scale (Chesson 2000), but the level of environmental variation within plots may be too small to capture with the metrics and variables in this study or with the precision recorded in the CVS database. The inherent characteristics of the vegetation plots used in this analysis could account for the fact that within plots, the means of variables were better predictors than heterogeneity metrics. Because vegetation plots were located to inventory sites that are characteristic of a single vegetation community, variation in environmental variables within plots is likely minimal.
26
variability among habitats across neighborhoods could result in increased source-sink dynamics among habitat patches, which act to maintain local population sizes via the rescue effect (Pulliam 1988, Brown and Kodric-Brown 1977). However, my results show that variation in elevation across neighborhoods was not significantly different for longleaf and non-longleaf plots. On the Southeast Coastal Plain, different vegetation communities result from subtle changes in elevation, and this variation can lead to considerable differences in plant species richness and composition even within the longleaf pine ecosystem (Peet 2006).
Land cover heterogeneity across regions showed a positive relationship with local richness and had a greater influence on richness than land cover heterogeneity within habitats. Regional land cover heterogeneity was significantly higher for longleaf plots than all other plots. Ecologically, this relationship is likely due to the fact that in the Southeast Coastal Plain, species-rich longleaf pine communities generally exist in smaller patches or in regions of higher habitat fragmentation while communities, such as pocosins, that contain fewer plant species often still exist in large expanses
(Christensen 2000). In addition, and cover likely relates to local plant species best when measured across regions because the accuracy of digital land cover classifications is highest when the data is summarized at large extents (Hollister et al. 2004).
27
is positive at all scales. This relationship is likely a direct result of the way in which patches were delineated in this study. I delineated patches based on areas of
contiguous vegetation according to NLCD land cover data. Because relatively species poor communities in the Southeast, such as pocosin, exist within larger expanses of vegetation, patch sizes for these vegetation types are likely higher. Consequently, there is more potential for variation within these larger patches, and heterogeneity values would be greater. Indeed, patch sizes surrounding plots with lower than average values of NDVI heterogeneity had a mean size of 30.4 ha, while plots with higher values of NDVI heterogeneity had a mean patch size of 38.9 ha.
Compared to other plots examined here, those in longleaf pine communities were on average higher in species richness and had significantly different values for within-habitat NDVI heterogeneity and regional land cover heterogeneity. The
continuous nature of the heterogeneity variables are helpful for regional assessments because they allow a determination of the statistical distribution of environmental conditions over which species-rich longleaf communities are likely to occur. In contrast, discrete habitat classifications do not allow such a determination. For example, longleaf plots fall in a number of land cover classes in the NLCD 2001 land cover classification (Homer et al. 2007), all of which contain plots in other vegetation communities (Table 2.4). Woody wetlands, the class on which the majority of longleaf plots fall, also
contains the majority of other plots.
28
example, across landscapes, St-Louis et al. (2006) showed that variability in vegetation productivity was related to landscape-scale bird species richness. In addition, a study by Kerr et al. (2001) showed that the variety of land cover across ecoregions was an important predictor of regional butterfly richness. Thus, my results showing the
importance of NDVI heterogeneity within habitats, and land cover heterogeneity across regions correspond to those previous findings. However, while other studies have shown a relationship between local heterogeneity and local plant richness, I found no significant relationship between richness and local heterogeneity in my study.
My results can be related to species pool theory, which states that there are environmental and geographic factors that act at different scales to filter the total species pool and determine local species composition and richness. Following the terminology of Kelt (1995) and Belyea and Lancaster (1999), the ecological species pool, or the species available to colonize any local area, is a subset of the total species pool that has been filtered by dispersal constraints and the environment.
Heterogeneity measured across regions represents variability in the number of habitat types within an ecoregion, and likely represents longer-term processes, such as soil formation, that would also influence the total species pool in a region. Therefore, the positive regional heterogeneity-local richness relationship I found could suggest that regional heterogeneity acts to increase local species richness by increasing the number of species in the total species pool, providing a larger group of species available before dispersal and environmental filters.
29
variability in habitat among habitat patches that surround a plot location. This scale may be similar to the scale at which plants disperse from neighboring habitat patches. Thus, greater variability among habitats surrounding a site increases the number of species that are able to disperse to a given site. The positive relationship I found between neighborhood heterogeneity and local richness suggests that heterogeneity at this scale is associated with decreased dispersal constraints, and therefore increases the size of the geographic species pool.
The different subset of species in the total species pool that has been filtered by environmental constraints is called the habitat species pool. Heterogeneity measured within habitats in this study is at the scale of environmental filtering. The negative relationship I found suggests that increased heterogeneity represents increased
environmental filtering within habitat patches, which leads to a smaller habitat species pool. Local internal dynamics such as competition determine which species in the ecological species pool actually establish at a given site. It has been argued that within-plot heterogeneity corresponds to decreased local competition, which promotes species coexistence (Chesson 2000) and thus local richness. Although I tried to find evidence for that in this study, my results do not show a relationship between local heterogeneity and local species richness.
30
development occurred first in most the fertile longleaf pine communities, where highest plant species richness occurs (Frost 2006). The positive correlation between richness and heterogeneity at neighborhood and regional scales could therefore be due to increased habitat fragmentation at those scales.
Measuring and monitoring diversity across broad scales is important to
conservation. At these scales, local measures of species richness at plot locations often must be extrapolated across regions using predictive models based on GIS and
remotely-sensed data. My results have implications for these prediction-based assessments of plant species richness. When modeling local species richness across broad extents, heterogeneity measures are better predictors than the means of variables such as NDVI, elevation and land cover. My results show that models that incorporate these continuous variables, at a variety of scales, can be useful in predicting species richness, and for distinguishing communities of known conservation
importance. Specifically, by showing that at within-habitat and neighborhood scales, local species richness could be predicted by variation in unclassified spatial data, I found support for the spectral variation hypothesis, proposed by Palmer et al. (2002) as a tool that can inform surveys of species richness.
31
indicate that conservation and management of an entire preserve affects local plant communities. The neighborhood scale measured variability across vegetation and non-vegetation at the same extents, and represents the scale of a preserve plus the
surrounding land uses, while the regional scale, measured at extents of 38,000 ha to 705,000 ha, is close to the scale of a small watershed. The influence of neighborhood and regional heterogeneity on local richness indicates that conservation efforts must consider the larger landscape when aiming to conserve local sites. Indeed, taking an approach such as ecosystem management, which works to achieve conservation while integrating broad-scale ecological and social factors across regional extents
(Christensen et al. 1996), would be successful here.
My study examines whether heterogeneity variables are useful predictors of plant species richness. This study does not aim to develop the best multivariate models to predict richness, but rather to examine the richness-heterogeneity relationship using a range of easily computable heterogeneity metrics derived from ecologically
32
Conclusions
33
References
America's Longleaf. 2009. Range-wide conservation plan for longleaf pine. Available online at: www.americaslongleaf.org.
Austin, M. P. 1999. The potential contribution of vegetation ecology to biodiversity research. Ecography 22:465-484.
Belyea, L. R., J. Lancaster. 1999. Assembly rules within a contingent ecology. Oikos 86:402-416.
Brown, J. H., A. Kodric-Brown. 1977. Turnover rates in insular biogeography: effect of immigration on extinction. Ecology 58:445-449.
Burnham, K. P., D. R. Anderson. 2002. Model selection and multi-model inference: a practical information-theoretic approach. Springer-Verlag, New York, New York, USA.
Chesson, P. 2000. General theory of competitive coexistence in spatially-varying environments. Theoretical Population Biology 58:519-553.
Christensen, N. L., A. M. Bartuska, J. H. Brown, S. Carpenter, C. M. D'Antonio, R. Francis, J. F. Franklin, J. A. MacMahon, R. F. Noss, D. J. Parsons, C. H. Peterson, M. G. Turner, and R. G. Woodmansee. 1996. The Report of the Ecological Society of America Committee on the Scientific Basis for Ecosystem Management. Ecological Applications 6:665-691.
Christensen, N. L. 2000. Vegetation of the Southeastern Coastal Plain. Pages 397-448 in M. G. Barbour and W. D. Billings, editors. North American terrestrial vegetation, Cambridge University Press, Cambridge, UK.
Davies, K. F., P. Chesson, S. Harrison, B. D. Inouye, B. A. Melbourne, and K. J. Rice. 2005. Spatial heterogeneity explains the scale dependence of the native-exotic diversity relationship. Ecology 86:1602-1610.
Environmental Protection Agency. 2004. Level III and IV Ecoregions of EPA Region 4. [spatial data]. U.S. Environmental Protection Agency, National Health and
Environmental Effects Research Laboratory, Western Ecology Division, Corvallis, Oregon, USA.
34
Frost, C. C. 2006. History and future of the longleaf pine ecosystem. Pages 9-48 In S. Jose, E. Jokela, and D. Miller, editors. Longleaf pine ecosystems: ecology,
management, and restoration, Springer, New York, USA.
Gelman, A., Y. Su, M. Yajima, J. Hill, M. G. Pittau, J. Kerman, and T. Zheng. 2010. Arm: Data analysis using regression and multilevel/hierarchical models. R package version 1.2-9. Available online at: http://www.stat.columbia.edu/~gelman/software/ Gould, W. A., M. D. Walker. 1997. Landscape-scale patterns in plant species richness
along an arctic river. Canadian Journal of Botany 75:1748-1765.
Hollister, J. W., M. L. Gonzalez, J. F. Paul, P. V. August, and J. L. Copeland. 2004. Assessing the Accuracy of National Land Cover Dataset: Area Estimates at Multiple Spatial Extents. Photogrammetric Engineering and Remote Sensing 70:405-414.
Homer, C., C. Huang, L. Yang, B. Wylie, and M. Coan. 2004. Development of a 2001 National Land-Cover Database for the United States. Photogrammetric Engineering and Remote Sensing 70:829-840.
Homer, C., J. Dewitz, J. Fry, M. Coan, N. Hossain, C. Larson, N. Herold, A. McKerrow, J. N. VanDriel, and J. Wickham. 2007. Completion of the 2001 National Land Cover Database for the Coterminous United States. Photogrammetric Engineering and Remote Sensing 73:337-341.
Kelt, D. A., M. L. Taper, and P. L. Meserve. 1995. Assessing the impact of competition on community assembly: a case study using small mammals. Ecology 76:1283-1296. Kerr, J. T., T. R. E. Southwood, and J. Cihlar. 2001. Remotely sensed habitat diversity
predicts butterfly richness and community similarity in Canada. Proceedings of the National Academy of Sciences 98:11365-11370.
Levin, S. A. 2000. Multiple scales and the maintenance of biodiversity. Ecosystems 3:498-506.
Lunn, D. J., A. Thomas, N. Best, and D. Spiegelhalter. 2000. WinBUGS -- a Bayesian modelling framework: concepts, structure, and extensibility. Statistics and Computing 10:325-337.
McKerrow, A. J. 2006. Mapping and monitoring plant communities in the coastal plain of North Carolina: a basis for conservation planning. PhD Dissertation. North Carolina State University, Raleigh, North Carolina, USA.
35
Nagendra, H. 2002. Opposite trends in response for the Shannon and Simpson indices of landscape diversity. Applied Geography 22:175-186.
NASA. 2008. MODIS MOD13Q1 Vegetation Indices 16-Day L3 Global 250m, collection 5.0. [spatial data]. Available at: https://lpdaac.usgs.gov/
Palmer, M. W., P. G. Earls, B. W. Hoagland, P. S. White, and T. Wohlgemuth. 2002. Quantitative tools for perfecting species lists. Environmetrics 13:121-137.
Peet, R. K., and D. J. Allard. 1993. Longleaf pine vegetation of the southern Atlantic and eastern Gulf Coast regions: a preliminary classification. Pages 45-81 in S. M. Hermann, editor. Proceedings of the Tall Timbers Fire Ecology Conference, No. 18, The Longleaf Pine Ecosystem: ecology, restoration and management. Tall Timbers Research Station, Tallahassee, Florida, USA.
Peet, R. K., T. R. Wentworth, and P. S. White. 1998. A flexible, multipurpose method for recording vegetation composition and structure. Castanea 63:262-274.
Pettorelli, N., J. O. Vik, A. Mysterud, J. Gaillard, C. J. Tucker, and N. C. Stenseth. 2005. Using the satellite-derived NDVI to assess ecological responses to environmental change. Trends in Ecology & Evolution 20:503-510.
Pinheiro, J., D. Bates, S. DebRoy, D. Sarkar, and the R Core team. 2009. nlme: linear and nonlinear mixed effects models. R package version 3.1-92.
Pulliam, H. R. 1988. Sources, sinks, and population regulation. American Naturalist 132:652-661.
R Development Core Team. 2009. R: A language and environment for statistical computing. Foundation for Statistical Computing, Vienna, Austria.
Ricklefs, R. E. 1987. Community diversity: Relative roles of local and regional processes. Science 235:167-171.
Riitters, K. H., J. D. Wickham, J. E. Vogelmann, and K. B. Jones. 2000. National land-cover pattern data. Ecology 81:604.
Shmida, A., M. Wilson. 1985. Biological determinants of species diversity. Journal of Biogeography 12:1-20.
Simpson, E. H. 1949. Measurement of diversity. Nature 163:688.
36
Snyder, R. E., P. Chesson. 2004. How the spatial scales of dispersal, competition, and environmental heterogeneity interact to affect coexistence. The American Naturalist 164:633-650.
Sorrie, B. A., A. S. Weakley. 2001. Coastal plain vascular plant endemics: phytogeographic patterns. Castanea 66:50-82.
Southeast Gap Analysis Project. 2008. Southeast GAP Regional Land [spatial data]. Available online at: www.basic.ncsu.edu/segap/index.html.
St-Louis, V., A. M. Pidgeon, V. C. Radeloff, T. J. Hawbaker, and M. K. Clayton. 2006. High-resolution image texture as a predictor of bird species richness. Remote Sensing of Environment 105:299-312.
U.S. Geological Survey. 1999. National Elevation Dataset 7.5-Minute Elevation Data [spatial data].
37
Tables
Table 2.1: Scales, grain sizes, predictor variables, and metrics included in heterogeneity analysis.
Levela Scale Grain size Abioticb Productivityb
Vegetation communityc
1 Within-plot
400 m2
Soil pH and
OMd Basal area N/A
1 Within-habitat
150 m radius Elevation NDVI Land cover 450 m radius Elevation NDVI Land cover 1380 m
radius Elevation NDVI Land cover
1 Neighborhood
150 m radius Elevation NDVI Land cover 450 m radius Elevation NDVI Land cover 1380 m
radius Elevation NDVI Land cover
2 Region
Ecoregions Elevation NDVI Land cover
aIndicates level of predictor in mixed effects models.
bMean, variance, standard deviation, range, coefficient of variation were calculated. cSimpson's diversity index and variety were calculated.
Table 2.2: Results from univariate mixed effects models. Boldface indicates the best model for a given scale, based on AICc wi.
Scale Variable and radius Uncond means Mean Variance Stdev Range CV Variety Simpson likelihood Log- AICca valueP- b
Within-plot
pH 1.00 -644.21 1298.84 <0.001
OM 0.74 -664.54 1337.35 0.01
Basal area 0.85 -659.87 1328.02 <0.001
Within-habitat
Elevation 150 m 0.32 0.12 0.13 0.16 0.16 * * N/A
Elevation 450 m 0.35 0.45 -664.97 1338.22 0.01
Elevation 1380 m 0.22 0.32 0.20 -666.71 1341.41 0.09
NDVI 150 m 0.29 0.20 0.14 0.17 0.11 0.10 * * N/A
NDVI 450 m 0.63 -664.31 1336.61 0.01
NDVI 1380 m 0.16 0.20 0.35 0.15 -666.28 1340.55 0.06
Land cover 150 m 0.71 -665.66 1339.59 0.03
Land cover 450 m 0.25 0.60 -665.75 1339.77 0.03
Land cover1380 m 0.26 0.59 -665.72 1339.72 0.03
Neighborhood
Elevation 150 m 0.80 -662.47 1333.22 <0.001
Elevation 450 m 0.24 0.55 -664.15 1336.57 0.01
Elevation 1380 m 0.59 0.38 -663.12 1334.51 0.002
NDVI 150 m 0.28 0.24 0.12 0.12 0.12 0.13 * * N/A
NDVI 450 m 0.31 0.25 0.12 * * N/A
NDVI 1380 m 0.35 0.14 0.14 * * N/A
Land cover 150 m 0.50 * * N/A
Land cover 450 m 0.58 * * N/A
Land cover1380 m 0.58 * * N/A
Regional
Elevation 0.53 -664.72 1337.71 0.01
NDVI 0.49 * * N/A
Land cover 0.94 -663.49 1338.32 0.003
Values represent AICc wi for each metric for a given measure and radius, for all models with Δ AICc less than 2.
a * indicates the unconditional means model was better than models containing any of the metrics as predictors bP-values are from an extra sum-of-squares F-test.
39
Table 2.3: Results of model comparison among the best univariate models for each extent. Boldface indicates the best univariate model for a given extent, based on Δ AICc.
Scale Model Radius likelihood Log- Ka AICc
Δ
AICc wi
p -valueb
Level-2 R2 d
Level-1 R2 d Shape
Within-plot
Unconditional means -668.13 3 1342.42 14.40 0.00
Mean pH -644.21 4 1296.70 0.00 1.00 < 0.001 0.57 0.24 Inverted U
Mean Organic matter -664.54 4 1337.35 40.65 0.00 0.01 0.24 0.03 Neg. linear Mean Basal area -659.87 4 1328.02 31.32 0.00 < 0.001 -0.04 0.12 Neg. linear
Within-habitat
Unconditional means -668.13 3 1342.42 5.53 0.03
Land cover heterogeneity 150 m -665.66 4 1339.59 2.70 0.10 0.03 -0.10 0.04 Neg. linear Land cover heterogeneity 450 m -665.75 4 1339.77 2.88 0.09 0.03 -0.12 0.04 Neg. linear Land cover heterogeneity 1380 m -665.72 4 1339.72 2.83 0.10 0.03 -0.10 0.04 Neg. linear Elevation heterogeneity 450 m -664.97 4 1338.22 1.34 0.20 0.01 0.16 0.03 Pos. linear Elevation heterogeneity 1380 m -666.71 4 1341.69 4.80 0.04 0.09 0.13 0.01 Pos. linear
NDVI heterogeneity 450 m -664.31 4 1336.89 0.00 0.39 0.01 -0.02 0.06 Neg. linear
NDVI heterogeneity 1380 m -666.28 4 1340.83 3.94 0.06 0.06 0.02 0.02 Neg. linear
Neighborhood
Unconditional means -668.13 3 1342.42 9.19 0.01
Elevation heterogeneity 150 m -662.47 4 1333.22 0.00 0.58 < 0.001 -0.05 0.08 Pos. linear
Elevation heterogeneity 450 m -664.15 4 1336.57 3.35 0.11 0.01 0.11 0.05 Pos. linear Elevation heterogeneity 1380 m -663.12 4 1334.51 1.29 0.31 0.002 0.08 0.06 Pos. linear Regional
Unconditional means -668.13 3 1342.42 4.10 0.09
Elevation heterogeneity -664.72 4 1340.77 2.45 0.21 0.01 0.45 0.00 Pos. linear
Land cover heterogeneity -663.49 4 1338.32 0.00 0.70 0.003 0.57 0.00 Pos. linear
aNumber of parameters estimated in the model.
bP-values are from an extra sum-of-squares F-test comparing each univariate model to the unconditional means model.
40
Table 2.4: Percentage of longleaf versus non-longleaf vegetation plots that fall within each habitat type, according to NLCD land cover classification.
Type of plots N Herbaceous Evergreen Forest Wetlands Other Woody
Longleaf 31 19% 19% 39% 23%
41
Figures
42
(a) (b)
(c)
43
(a) (b)
(c)
44
(a) (b)
*
(c)
*
CHAPTER 3
LESSONS LEARNED IN COLLABORATIVE CONSERVATION: STRATEGIES USED BY PARTNERSHIPS IN THE LONGLEAF PINE ECOSYSTEM
Abstract
Collaborative partnerships among public and private entities are a popular way to accomplish ecosystem management and conservation objectives. Many strategies for effective collaboration have been suggested in the literature; however, those strategies have rarely been related to the stated conservation objectives for a particular
ecosystem. In this chapter, I asked: which strategies are being used by collaborative partnerships in the longleaf pine ecosystem of the US Southeast to accomplish
46
ecosystem. These strategies emphasize long-term sustainability of partnerships and resilience of the ecosystem; therefore, they will be useful for informing the efforts of other partnerships in the longleaf pine ecosystem and elsewhere.
Keywords
communication with local governments; conservation objectives; ecosystem resilience; long-term sustainability; public outreach
Introduction
With the decline of biodiversity and scientists’ increased awareness of the complexity of ecological processes, ecosystem management has become a dominant paradigm for accomplish conservation objectives over the last twenty years (Keough and Blahna 2006, Yaffee 1999). Rather than focusing on traditional single species or resource-based approaches, ecosystem management takes a holistic viewpoint, recognizing the complexity of ecological processes situated within a social context across broad extents (Christensen et al. 1996). One way to conduct ecosystem management is via collaborative partnerships among public agencies, private
organizations, and other stakeholders aimed at conservation (Wondolleck and Yaffee 2000). These partnerships are becoming increasingly important ways in which to address conservation goals across broad extents as the human population grows and habitat becomes more fragmented. Indeed, numerous successful collaborative