The Journal of Nutrition
Nutritional Epidemiology
Diet Quality and Its Association with
Cardiometabolic Risk Factors Vary by Hispanic
and Latino Ethnic Background in the Hispanic
Community Health Study/Study of Latinos
1–3
Josiemer Mattei,
4* Daniela Sotres-Alvarez,
6Martha L Daviglus,
9Linda C Gallo,
10Marc Gellman,
11Frank B Hu,
4,5Katherine L Tucker,
12Walter C Willett,
4,5Anna Maria Siega-Riz,
7,8Linda Van Horn,
13and Robert C Kaplan
14Departments of4Nutrition and5Epidemiology, Harvard T.H. Chan School of Public Health, Boston, MA;6Collaborative Studies
Coordinating Center, Department of Biostatistics, and Departments of7Epidemiology and8Nutrition, Gillings School of Global Public
Health, University of North Carolina, Chapel Hill, NC;9Institute for Minority Health Research, College of Medicine, University of
Illinois at Chicago, Chicago, IL;10Department of Psychology, San Diego State University, San Diego, CA;11Department of Psychology,
University of Miami, Miami, FL;12Department of Clinical Laboratory and Nutritional Sciences, University of Massachusetts, Lowell,
MA;13Department of Preventive Medicine, Northwestern University Feinberg School of Medicine, Chicago, IL; and14Department of
Epidemiology and Population Health, Albert Einstein College of Medicine, Bronx, NY
Abstract
Background:Healthful diet quality has been associated with a lower risk of metabolic syndrome (MetS) in several
populations, but reports on Hispanic and Latino cohorts, grouped or by ethnic background, have been limited and inconsistent.
Objective:We aimed to examine diet quality by using the 2010 Alternate Healthy Eating Index [(AHEI) range: 0–110,
lowest to highest quality] and its cross-sectional association with MetS and its cardiometabolic components across 6
Hispanic and Latino backgrounds.
Methods:We studied 12,406 US Hispanics and Latinos, aged 18–74 y and free of diabetes, from the multicenter,
population-based Hispanic Community Health Study/Study of Latinos cohort. Food and nutrients were assessed from two
24-h recalls. MetS was defined by using the 2009 harmonized guidelines. Complex survey procedures were used in
multivariable-adjusted linear regression models to test the association of the AHEI with continuous markers and in logistic
regression models with MetS as an outcome.
Results:The prevalence of MetS was 24.2%. Overall, Hispanics and Latinos had low scores for intakes of sugar-sweetened
beverages and fruit juices, whole grains, and fruit and favorable scores fortransfats and nuts and legumes, according to AHEI criteria. Adjusted mean AHEI and its individual components differed by ethnic background (P< 0.001), ranging from 43.0 for Puerto Ricans to 52.6 for Mexicans. Overall, adjusted odds (95% CIs) of having MetS were 22% (9%, 33%) lower for each 10-unit increase in AHEI.
This association was modified by ethnic background (P-interaction = 0.03), with significantly lower odds observed only for Mexicans (30%; 95% CIs: 13%, 44%) and Central Americans (42%; 95% CIs: 9%, 64%) for each 10-unit increase in AHEI. AHEI was inversely
associated with waist circumference, blood pressure, and glucose among Mexicans and Puerto Ricans and with triglycerides among
Mexicans only, and positively associated with HDL cholesterol among Puerto Ricans and Central Americans (allP< 0.05). Conclusions:Diet quality differed by Hispanic or Latino background. Although healthier diet quality was associated with
lower odds of MetS in the overall Hispanic and Latino cohort, the association of AHEI and cardiometabolic factors varied by
ethnic background. Nutrition-related research and interventions among ethnically diverse groups should consider
individual ethnic backgrounds to optimally address diet quality and cardiometabolic health. This trial was registered at
clinicaltrials.gov as NCT02060344. J Nutr2016;146:2035–44.
Keywords:
metabolic syndrome, diet quality, Hispanics, Latinos, cardiometabolic risk factors, HCHS/SOL,health disparities, race/ethnicity, minority health
Introduction
A disproportionate burden of type 2 diabetes and cardiovascular
disease (CVD)
15, as well as their intermediate biological risk
factors, has been noted among US Hispanic and Latino adults.
The prevalence of diabetes in this adult population has been
estimated to be between 11% (1) and 17% (2), and in 2015, 48%
of Hispanic and Latino men and 32% of women had CVD (3).
ã2016 American Society for Nutrition.
Metabolic syndrome (MetS) is a cluster of cardiometabolic risk
factors that has been associated with twice the risk of CVD and
nearly 5 times the risk of diabetes (4, 5). Consequently, a call to
recognize MetS in clinical and public health practice has been
put forth by multiple agencies (5).
Current reports show that the profile of cardiometabolic risk
factors differs significantly across US Hispanic and Latino
backgrounds (6–10). For example, adults aged 18–74 y of South
American or Dominican backgrounds tended to have the lowest
prevalence of MetS (27% and 31%, respectively), whereas
Puerto Rican women had the highest (41%) (10). It has been
posited that CVD-prevention strategies and clinical
manage-ment should focus on addressing the high rates of multiple risk
factors presented by Hispanics and Latinos as a group, as well as
by individual ethnic background (8, 10).
Following an overall healthy diet is a recognized strategy to
prevent cardiometabolic risk. Overall diet can be assessed by using
composite evidence-based scores that comprise multiple nutrients
and food groups, such as the Alternate Healthy Eating Index
(AHEI). There is strong evidence of associations between higher
AHEI (which reflects better diet quality, based on current evidence)
and lower risk of diabetes, CVD, and MetS (11–15). Some of these
studies reported stronger associations with chronic disease risk
with the AHEI than with other diet quality scores (12, 13, 15). This
is likely because the AHEI includes specific foods and nutrients,
such as legumes, sugar-sweetened beverages, and red or processed
meats, which have a role in the development of chronic disease but
are absent or incorporated within general food groups in other diet
scores (15). However, few studies, to our knowledge, have looked
at the association between diet quality and cardiometabolic risk
factors among Hispanics and Latinos, and the results have been
inconsistent. One study found a significantly lower risk of diabetes
for Hispanic and Latino women in the highest quintile of AHEI
(16), whereas other studies found null associations between diet
quality and obesity markers (17) or CVD mortality (18). Analysis
by Hispanic or Latino background was not conducted in these
studies. Moreover, although some variation in intakes of
individ-ual nutrients and foods by Hispanic or Latino background has
been reported (19, 20), systematic reports of diet quality by ethnic
background are scarce (6).
It remains unknown whether there are ethnic background–
specific differences in diet quality and whether these would
translate into observed differences in cardiometabolic risk profile.
Thus, we aimed to compare diet quality, as measured by the AHEI,
and to determine its association with MetS and its cardiometabolic
components across 6 Hispanic and Latino backgrounds, with
the use of a large, multiethnic US Hispanic and Latino cohort. The
hypothesis was that both diet quality and the strength of the
association between AHEI and MetS would vary by ethnic
background. Ethnicity-specific analyses may help clarify inconsistent
results of diet-disease associations that have been reported among
aggregated Hispanic and Latino populations. Moreover,
recommen-dations to improve diet quality for chronic disease prevention may
need to be tailored specifically to each Hispanic or Latino group.
Methods
Study population. The Hispanic Community Health Study/Study of Latinos (HCHS/SOL) is a community-based prospective cohort study in 16,415 individuals who self-identified as having Hispanic or Latino ethnicity (hereafter referred to by using their country of origin), aged 18–74 y, from randomly selected households in 4 US field centers (Chicago, Illinois; Miami, Florida; Bronx, New York; and San Diego, California) with baseline examinations (2008–2011) and yearly tele-phone follow-up assessments (21). Baseline data were used for this analysis.
Recruitment involved a stratified 2-stage area probability sample of household addresses in each field center (22). Individuals from identified households were contacted and screened for eligibility (living in the household, aged 18–74 y, ability to attend a clinic visit, and not planning to move within 6 mo). All participants signed an informed consent. The institutional review boards of each field center, coordinating center, reading centers, and the National Heart, Lung, and Blood Institute approved this study. The trial was registered at clinicaltrials.gov as NCT02060344.
Data collection.The detailed methodology was described previously (6, 21). Briefly, participants visited one of the centers where all clinical assessments and interviews were conducted by centrally trained person-nel, in the participantÕs preferred language. The interview included questions on demographic and socioeconomic characteristics, lifestyle behaviors, acculturation, and self-reported medical history and medica-tion use. Specifically, participants self-reported the total years of schooling completed and the highest grade or level of education achieved, the household income earned in 1 y, and the years living in the United States for those not born in the United States (equivalent to the age of the participant if born in the United States). Number of years living in the United States was used as a proxy measure of acculturation; other measures probed included being born in the United States, generational level (i.e., first, second, third, or fourth generation, based on place of birth of participant, parents, and grandparents), and language of preference. Physical activity was assessed by using the Global Physical Activity Questionnaire, and self-reported hours of activity and sedentary behavior were converted into metabolic equivalents and categorized as high, moderate, or low levels.
Waist circumference was measured at the horizontal line just above the uppermost lateral border of the right ilium by using an anthropo-metric tape. Blood pressure was measured in triplicate with an automatic sphygmomanometer after a quiet rest, and was averaged. Fasting blood samples were collected soon after arrival and shipped to the central laboratory for analysis. A Roche Modular P Chemistry Analyzer was used to analyze serum TGs, serum HDL cholesterol, and plasma glucose (Roche Diagnostics). All field center procedures and laboratory proto-cols are published online (23).
Dietary assessment and exposure definition.Methods for dietary data collection have been published (19, 24). Briefly, two 24-h recalls were administered, 1 in-person at the baseline visit and 1 via telephone or in-person within 5–90 d, usually after the baseline visit. More than 88% of the second recalls were unannounced and were scheduled by field center staff with the goal of distributing them throughout all days of the week. The rest of the second recalls were scheduled at the participantÕs
1
Supported by a Mentored Career Development Award to Promote Faculty Diversity in Biomedical Research (K01-HL120951) from the NIH, National Heart, Lung, and Blood Institute (NHLBI). The Hispanic Community Health Study/Study of Hispanics/Latinos/Latinos was carried out as a collaborative study supported by contracts from the NHLBI to the University of North Carolina (N01-HC65233), University of Miami (N01-HC65234), Albert Einstein College of Medicine (N01-HC65235), Northwestern University (N01-HC65236), and San Diego State University (N01-HC65237). The following institutes/centers/offices contribute to the Hispanic Community Health Study/Study of Latinos through a transfer of funds to the NHLBI: National Center on Minority Health and Health Disparities, the National Institute of Deafness and Other Communications Disorders, the National Institute of Dental and Craniofacial Research, the National Institute of Diabetes and Digestive and Kidney Diseases, the National Institute of Neurological Disorders and Stroke, and the Office of Dietary Supplements. 2
Author disclosures: J Mattei, D Sotres-Alvarez, ML Daviglus, LC Gallo, M Gellman, FB Hu, KL Tucker, WC Willett, AM Siega-Riz, L Van Horn, and RC Kaplan, no conflicts of interest.
3
Supplemental Tables 1–3 are available from the ‘‘Online Supporting Material’’ link in the online posting of the article and from the same link in the online table of contents at http://jn.nutrition.org.
*To whom correspondence should be addressed. E-mail: [email protected]. 15
convenience. Recalls with energy intakes below the sequence sex-specific first percentile or >99th percentile, or that were unreliable according to the interviewer, were excluded. Participants estimated portion sizes with the use of food models (in-person) and a food-amount booklet (for telephone interviews). Foods and nutrients were analyzed by using the multiple-pass methods of the Nutrition Data System for Research software version 11 from the Nutrition Coordinating Center at University of Minnesota, which includes Hispanic and Latino foods. Although underreporting of energy and protein intakes and overreporting of protein density have been shown in an ancillary study of this cohort (24), this is a common occurrence across nutritional studies that does not diminish the value of self-reported dietary data (25).
The 2010 AHEI comprised 11 dietary components with evidence of association with chronic diseases (11, 15). Four steps were followed to calculate the index. First, each component was created by adding the corresponding Nutrition Data System for Research food subgroups at the dietary recall level. The components, cutoffs, and portion sizes used to define the AHEI are described in Supplemental Table 1. Second, predicted usual-intake amounts for each AHEI component were estimated by using the National Cancer Institute method (26), which accounts for within- and between-person variance components and corrects for the high intraindividual variation intrinsic to 24-h recalls. Third, each component was scored from 0 to 10 as continuous (prorated intermediate values) from minimal to maximal observance of the recommended amount of each item. Last, individual component scores were summed. Possible scores for the AHEI range from 0 to 110 (unhealthiest to healthiest).
MetS definition. A dichotomous variable for MetS (yes or no) was defined following the harmonized guidelines from the 2009 Joint Scientific Statement (5). MetS was assigned to participants who met$3 of the following criteria: abdominal obesity by using thresholds corresponding to US populations for consistency and comparability (>102 cm in men, >88 cm in women), elevated blood pressure (>130/85 mm Hg) or the use of antihypertension medications, high TGs [$1.28 mmol/L (150 mg/dL)], low HDL cholesterol [<1.03 mmol/L (40 mg/dL) in men, <1.28 mmol/L (50 mg/dL) in women], and impaired fasting glucose [$5.8 mmol/L (100 mg/dL)] or the use of antidiabetic medications. Analyses were repeated by using the International Diabetes Federation definition of MetS, which defines abdominal obesity by using lower thresholds ($94 cm in men,$80 cm in women), as recommended for populations of European and sub-Sahara African heritages, plus 2 other components equivalent to the additional 4 markers included in the harmonized definition (27).
Statistical analysis.We excluded participants with diabetes based on self-report or laboratory values (2) (n= 3,383), who reported multiple or other Hispanic or Latino ethnic backgrounds (n= 436), or those with missing data on diabetes status (n= 23), AHEI (n= 145), or ethnic background (n= 22). Thus, 12,406 participants were included in this analysis. Participants with diabetes were excluded because MetS is a strong risk factor for diabetes (4, 5). In addition, those with diagnosed diabetes or prediabetes tend to have healthier dietary habits (28, 29), which may lead to reverse causation in cross-sectional analysis. Participants with multiple or other backgrounds were excluded to avoid heterogeneity in diet and MetS, on the basis of our hypothesis that these would differ by specific ethnic background.
Differences in characteristics by ethnic background and by tertile of AHEI were performed by using survey regression for continuous varia-bles and chi-square tests for categorical variavaria-bles. Age-adjusted means (prevalence estimate) were estimated by using the weighted average age of the sample (39 y). TheP-trend by tertile of AHEI was determined by assigning the median of each category to a participant in the respective tertile, then entering the resulting continuous variable into the model. Differences in nutrient and food-group composition by ethnic background were tested by using survey regression, adjusted for age, sex, household income, marital status, educational attainment, years living in the United States, physical activity, smoking status, center, and energy intake, with TukeyÕs adjustment for multiple comparisons. Age-adjusted probability density distribution of AHEI by ethnic background and center (to discern the influence of location singly and across backgrounds) was obtained by using the SAS SGPLOT procedure (SAS Institute).
Survey linear regression analysis was used to determine associations between each 10-unit increase in AHEI as a continuous exposure and each component of MetS as a continuous outcome. Standardized
b-coefficients were calculated for each model by dividing the original parameter estimate by the ratio of the sample SD of the dependent variable to the sample SD of the independent variable. Standardized coefficients were used to compare the magnitude of associations for exposures of different units. Values of TGs were log-transformed to attain normal distribution. Model covariates were selected a priori on the basis of previous reports and potential for confounding and included those described above as well as health insurance status, antihypertensive medication for blood pressure, and lipid-lowering medication for TGs and HDL cholesterol. Associations between each 10-unit increase in AHEI with MetS as a dichotomous outcome were tested with survey logistic regression models fitted to estimate ORs and 95% CIs, controlling for the same covariates except for medications. The interaction term between AHEI and ethnic background was tested in regression models. All analyses accounted for clustering and stratification and were weighted to adjust for sampling probability of selection and nonresponse with the use of complex survey procedures in SAS software version 9.4 (SAS Institute). A significance level ofP< 0.05 was used.
Results
Sociodemographic and health characteristics of HCHS/SOL
individuals by ethnic background are shown in
Table 1
and by
tertile of AHEI in
Supplemental Table 2
. Mexicans comprised
the majority of the sample and had higher incomes and physical
activity level but lower educational attainment than other
groups. Puerto Ricans were more likely to be single, smoke, have
health insurance, have been living in the mainland United States
for longer (as expected, given their US citizenship), and have
higher waist circumference and lower HDL cholesterol. Few
Dominicans were current smokers, and they had significantly
lower TGs and fasting glucose and higher HDL cholesterol than
did the other Hispanic and Latino groups. Nearly 1 in 4
individ-uals met the criteria for MetS, but the prevalence differed
signif-icantly by ethnic group, ranging from 17% in Dominicans to
nearly 30% in Cubans.
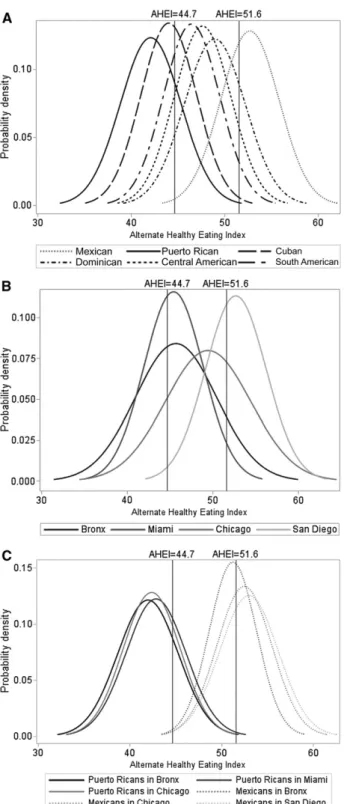
The age-adjusted probability density plots of AHEI showed
differences in the distribution of AHEI by ethnic background,
with the curve positioned to the right for Mexicans (higher
AHEI) and to the left for Puerto Ricans (lower AHEI) (
Figure
significantly by ethnic background. Among those excluded from
the main analysis, participants with multiple or other ethnicities
had a mean
6
SE AHEI of 49.4
6
0.34 and participants with
diabetes had a significantly higher mean AHEI than did those
without diabetes (48.9
6
0.2 compared with 48.4
6
0.3;
P
= 0.005) after adjusting for sociodemographic and lifestyle
behavioral factors (data not shown).
The
P-
interaction between AHEI and Hispanic or Latino
back-ground was significant (
P
= 0.03), suggesting variation in the
association of diet and MetS across ethnic backgrounds; thus,
stratified analyses were conducted. Each increase of 10 units in
AHEI was associated with 22% lower odds (95% CI: 9%, 33%;
P
= 0.001) of having MetS for all Hispanics and Latinos (
Table 3
),
after covariate adjustment. The strength of the association
varied by ethnic background and remained significant for
Mex-icans and Central AmerMex-icans but not for those of the other
backgrounds. Results that used the International Diabetes
Feder-ation definition of MetS were similar (data not shown). When we
analyzed the association between AHEI and MetS for participants
with diabetes, we observed nonsignificant (
P
= 0.18) odds of
having MetS (OR: 0.83; 95% CI: 0.63, 1.09; data not shown).
Overall, a higher AHEI was significantly associated with all
cardiometabolic risk factors except for systolic blood pressure
(Table 3). The AHEI was inversely associated with waist
circumference, blood pressure, and glucose for Mexicans and
Puerto Ricans and with TGs for Mexicans, and was positively
associated with HDL cholesterol for Puerto Ricans and Central
Americans. Standardized measures showed that associations
TABLE 1 Sociodemographic characteristics and cardiometabolic components of Hispanic and Latino adults without diabetes by ethnic background: HCHS/SOL 2008–20111Mexicans Puerto Ricans Cubans Dominicans Central Americans South Americans All
Participants,n(%) 5067 (40.8) 1944 (15.7) 1892 (15.3) 1175 (9.5) 1402 (11.3) 926 (7.5) 12,406 Age, y 36.6 (35.9, 37.3) 40.3 (39.2, 41.3) 43.8 (42.8, 44.8) 36.7 (35.5, 37.9) 37.5 (36.6, 38.3) 40.7 (39.3, 42.1) 39.0 (38.5, 39.5)
Females, % 53.3 48.0 47.1 61.0 51.1 54.1 48.2
Educational attainment
No high school or GED 33.6 34.2 19.5 33.6 36.0 20.6 30.3
High school or GED 31.3 28.5 31.1 25.0 27.4 26.8 29.6
Above high school or GED 35.0 37.3 49.4 41.4 36.6 52.6 40.1
Annual income, %
#$20,000 36.2 43.3 44.0 46.1 47.3 39.2 41.0
$20,001–$40,000 34.8 26.1 26.6 30.7 29.1 35.4 30.9
.$40,000 23.8 21.9 13.3 12.7 11.9 17.7 18.9
Not reported 5.2 8.7 16.1 10.5 11.6 7.7 9.2
Current smoker, % 18.1 34.7 27.4 11.3 15.6 12.6 21.5
Physical activity level,2%
High 16.7 15.7 9.1 13.6 15.3 12.5 14.3
Moderate 47.4 47.1 39.9 47.2 45.5 48.1 45.7
Low 35.6 36.7 50.5 38.1 38.5 39.0 39.5
Marital status, %
Single 30.5 50.4 28.0 49.5 41.2 31.8 36.1
Married or with partner 58.2 32.8 52.0 36.4 45.9 49.4 49.1
Separated, divorced, or widowed 11.3 16.8 19.8 14.1 12.5 18.7 14.7
Health insurance, % 41.0 74.9 38.1 65.1 28.9 38.1 47.2
Center, %
Bronx 8.8 71.7 1.7 94.5 19.5 23.6 28.1
Chicago 25.7 20.9 0.7 0.9 14.6 21.0 16.1
Miami 1.3 4.5 97.1 4.4 62.4 51.0 29.4
San Diego 64.2 2.8 0.5 0.2 3.6 4.4 26.4
Years living in mainland United States 19.9 (19.3, 20.6) 31.9 (30.9, 32.9) 11.5 (10.4, 12.5) 18.0 (17.0, 18.9) 14.7 (13.8, 15.6) 13.0 (12.1, 13.9) 19.1 (18.5, 19.8)
Waist circumference, cm 96.8 (96.2, 97.5) 97.7 (96.5, 98.8) 95.0 (94.1, 95.8) 95.0 (93.3, 96.6) 94.1 (93.2, 95.0) 92.4 (91.2, 93.5) 95.9 (95.5, 96.4) Systolic blood pressure, mm Hg 117 (116, 117) 119 (118, 120) 120 (119, 121) 121 (119, 122) 120 (119, 121) 116 (115, 117) 118 (118, 119)
Diastolic blood pressure, mm Hg 69.8 (69.3, 70.3) 72.8 (72.2, 73.5) 73.7 (73.0, 74.3) 73.9 (73.2, 74.7) 72.8 (72.0, 73.7) 69.5 (68.6, 70.4) 71.7 (71.4, 72.1) Serum TGs, mg/dL 130 (126, 134) 122 (115, 130) 129 (123, 135) 102 (97, 106) 140 (134, 146) 125 (119, 131) 126 (124, 129)
Serum HDL cholesterol, mg/dL 49.0 (48.4, 49.5) 47.8 (46.7, 48.8) 47.8 (47.1, 48.5) 51.1 (50.1, 52.1) 48.8 (47.8, 49.7) 49.7 (48.7, 50.8) 48.8 (48.4, 49.1) Fasting plasma glucose, mg/dL 93.7 (93.3, 94.0) 93.2 (92.5, 94.0) 93.9 (93.4, 94.4) 91.9 (91.2, 92.5) 93.9 (93.4, 94.4) 93.5 (92.8, 94.3) 93.5 (93.2, 93.7)
Metabolic syndrome3 22.7 26.9 29.6 17.3 23.7 20.3 24.2
1Values are age-adjusted means (39 y) (95% CIs), except for age, unless otherwise indicated. All analyses were weighted to adjust for sampling probability of selection and
nonresponse. To convert TGs to mmol/L, multiply values by 0.0113. To convert HDL cholesterol to mmol/L, multiply values by 0.0259. To convert fasting blood glucose to mmol/L,
multiply values by 0.0555. All variables differed significantly by ethnic background (overallP,0.001). GED, General Educational Development; HCHS/SOL, Hispanic Community
Health Study/Study on Latinos.
2Physical activity was assessed by using the Global Physical Activity Questionnaire. Self-reported hours of activity at work, travel, and leisure, as well as sedentary behavior, were
converted into metabolic equivalents and categorized as high, moderate, or low levels, on the basis of number of days spent doing physical activity at each designated intensity level.
3Metabolic syndrome was defined by using the harmonized guidelines from the 2009 Joint Scientific Statement, including use of medication (5). The use of medications relevant
between AHEI and waist circumference were stronger for Puerto
Ricans and with HDL cholesterol for Puerto Ricans and Central
Americans.
Discussion
We found that HCHS/SOL participants with varied US
Hispanic and Latino ethnic backgrounds differed in the quality
of their diets and the strength of association between diet quality
and MetS. Overall, each additional 10-unit increase in AHEI
(equivalent to 1 maximally scored component) was associated
with 22% lower odds of MetS. This estimates the potential
magnitude of benefit that could be obtained by modest
improvements in diet quality according to AHEI criteria. The
association between AHEI and MetS remained significant for
Mexicans and Central Americans but not for other
back-grounds, when examined separately. This suggests that the
dietary components included in the AHEI may be particularly
beneficial for MetS prevention for Mexicans and Central
Americans. The results agree with previous observations of
significant associations between diet quality constructs and
MetS in Mexicans (30) and Guatemalans (31). A study
conducted in Cubans showed an association between higher
AHEI and reduced 10-y predicted coronary heart disease risk,
but only in participants with diabetes (32); we excluded those
with diabetes in our study. Among individual cardiometabolic
risk factors, waist circumference for Puerto Ricans and HDL
cholesterol for Puerto Ricans and Central Americans were more
influenced by diet.
A healthy diet is generally effective in preventing
cardiome-tabolic conditions, so our results should not be interpreted as
diet being irrelevant for some Hispanic or Latino groups. Possible
explanations for the lack of associations in some groups could be
smaller sample sizes, misreporting of diet in some groups (24,
33), incomplete capture of specific traditional foods, or genetic
variations between ethnic backgrounds (34, 35) that may
translate into gene-diet interactions with differential
pheno-types. It is possible that other interactive or mediating factors are
operating. For example, we previously showed that the odds of
MetS were 31% lower for every 10-unit increase in diet quality
in men but not in women from a Puerto Rican middle-aged
cohort (36), which is similar in magnitude to the nonsignificant
results for Puerto Ricans in our study. The nonsignificant results
for Puerto Ricans were unexpected given the multiple
cardio-metabolic components strongly associated with AHEI in this
group, but effect modification by sex or age could be operating.
Finally, the use of a lower abdominal obesity criterion proposed
by the International Diabetes Federation did not alter the results
observed with higher thresholds recommended for US
popula-tions. There is no consensus on the most applicable thresholds
for waist circumference for Hispanics and Latinos, which are
likely influenced by their mixed racial/ethnic genetic profile.
Nonetheless, although different cutoffs may slightly alter
prev-alence estimates of abdominal obesity or MetS, associations
with cardiometabolic correlates tend to be unaffected (10).
Little information has been reported on differences in overall
diet quality across Hispanic and Latino background groups. Most
previous studies in the Hispanic and Latino population have either
reported on just one ethnicity or grouped them all together.
However, grouped reports should be interpreted with caution.
For example, NHANES studies that combined Hispanic and
Latino ethnicities concluded that the diet quality of all Hispanics
and Latinos is better than that of non-Hispanic whites (37, 38).
FIGURE 1 Age-adjusted probability density distributions of AHEI bySuch grouped-based conclusions may pertain to the predominant
background of the study population and not represent the
estimates and needs of distinct Hispanic and Latino ethnic
back-grounds with poorer dietary intakes. Indeed, the NHANES
Hispanic and Latino sample is predominantly composed of
Mexican Americans (39), who tend to have a higher diet quality
than other Hispanic and Latino groups, on the basis of the current
results and on another NHANES study that reported on Mexican
Americans exclusively (40). Moreover, grouped reports from
different source populations of Hispanics or Latinos may yield
disparate observations. For example, the Multi-Ethnic Study of
Atherosclerosis showed that, overall, Hispanics and Latinos had
the lowest AHEI among other major races/ethnicities (18, 41),
contrary to the findings mentioned above. Recruitment locations
and sociodemographic characteristics varied between the
afore-mentioned cohorts. Among other studies conducted for individual
Hispanic or Latino backgrounds, one study reported a mean
AHEI of 34 in Cubans, 10 points lower than in our sample (32).
Puerto Ricans have been shown to have poor diet quality with
the use of another index derived from evidence-based dietary
recommendations (36), similar to our findings.
Reports on individual foods and nutrients suggest differences
across US Hispanic and Latino ethnic backgrounds (19, 20);
thus, variations in diet quality components were to be expected.
Our results not only reflect shared traditional diet components
for all Hispanics and Latinos (e.g., legumes are a typical food
and ‘‘nuts and legumes’’ were rated fairly high) but also suggest
the need for ethnicity-specific dietary advice. Evidence-based
practices for successful, sustainable dietary interventions to
reduce the risk of CVD and related conditions among Hispanics
and Latinos focus mainly on the delivery strategies (e.g., use of
bicultural staff, appropriate settings, and social support) but also
recommend that the foods must be familiar and culturally
appropriate to the group (42, 43). Our study can help strengthen
these strategies by suggesting types of foods and nutrients to
be targeted for specific ethnic groups, for a deeper cultural
tailoring. Although we should reinforce overall healthy eating
habits for all Hispanics and Latinos (e.g., reducing
sugar-sweetened beverages and increasing whole grains and fruit),
additional emphasis could be placed on increasing intakes of
nuts and legumes and PUFAs among South Americans, reducing
sodium among Cubans, and increasing vegetable intake among
Puerto Ricans, for example. Taken together, our results support
a call from the American Heart Association (9) to avoid
generalizations on diet or cardiometabolic health for Hispanics
and Latinos as a whole, or as compared with other races and
ethnicities, on the basis of a singular background.
Our results also suggest that the geographical locations of
the field sites of this study have a role on diet quality. However,
Mexican diet quality remained generally higher, whereas
Puerto Rican diet quality remained poor in the 3 locations
analyzed. Although differences across sites are likely driven by
the ethnic majority of the site, other recognized factors such as
socioeconomic status, acculturation, regional differences in
food markets, and the built environment should be explored
further.
with diabetes remain poor (46). Given the critical role of diet on
glycemic control, clinicians caring for Hispanics and Latinos
should emphasize healthy dietary habits as part of diabetes
management. Finally, we observed null results for the analysis of
the association between AHEI and MetS for those with diabetes,
suggestive of reverse causation.
A limitation of this study is that its cross-sectional nature
cannot establish directionality between diet quality and
cardio-metabolic profile, although it is unlikely that diagnosis of MetS
conditions would lead to worse diet quality. Acquiring
longitu-dinal clinical and dietary data in this population is essential to
confirm the observed associations. The study collected only two
24-h recalls, and measurement error (24) may underestimate the
observed diet quality estimates and associations (25). We used
only 1 measure of diet quality, which was originally developed
from evidence gained from predominantly non-Hispanic white
cohorts. It is possible that other components of the traditional
Hispanic and Latino diet and important for their health are not
represented in the AHEI or that the predefined AHEI cutoffs and
weights for each component are less applicable to Hispanics
and Latinos. Thus, adapting or contrasting various indexes and
component weights by ethnic background may help to
deter-mine which ones have stronger associations with
cardiometa-bolic diseases.
Our study has several strengths. First, the HCHS/SOL is the
largest cohort of individuals of Hispanic and Latino origin in the
United States, and the study design and probability sampling
in urban areas with large ethnically diverse Hispanic and Latino
populations provide adequate representation. We expect that results
could be generalized to similar Hispanic and Latino communities,
TABLE 2 Mean AHEI and its components in HCHS/SOL individuals without diabetes, by ethnic background: 2008–20111Mexicans (n= 5067)
Puerto Ricans (n= 1944)
Cubans (n= 1892)
Dominicans (n= 1175)
Central Americans (n= 1402)
South Americans (n= 926)
Energy intake, kcal/d 2003617.2e 2077618.1d,e,f 2029618.9e 1956620.3b,e 1870617.3a,b,c,d,f 1973618.9b,e
Total AHEI score 52.660.2 43.060.2 45.060.3 51.060.2 49.060.2 47.060.3 Vegetables (without potatoes)
Score 4.460.04b,c,d,e,f 3.360.04a,c,d,f 3.960.05a,b,e 3.860.05a,b,e 3.560.05a,c,d,f 3.960.06a,b,e
Servings/d2 2.260.02b,c,d,e,f 1.660.02a,c,d,f 1.960.03a,b,e 1.960.03a,b,e 1.760.02a,c,d,f 1.960.03a,b,e Whole fruit (without fruit juice)
Score 3.060.05b,c,d 1.960.05a,d,e,f 2.060.08a,d,e,f 3.760.07a,b,c,e,f 2.860.06b,c,d,f 3.260.10b,c,d,e Servings/d2 1.260.02b,c,d 0.7560.02a,d,e,f 0.7960.03a,d,e,f 1.560.03a,b,c,e,f 1.160.03b,c,d,f 1.360.04b,c,d,e
Whole grains
Score 4.960.08b,c,d,e,f 1.560.06a,c,d,e 1.260.08a,b,d,e,f 1.860.07a,b,c,e 2.760.06a,b,c,d,f 1.860.07a,c,e
Servings/d2 2.760.04b,c,d,e,f 0.8460.04a,c,d,e 0.6560.05a,b,d,e,f 1.060.04a,b,c,e 1.560.04a,b,c,d,f 0.9860.04a,c,e Sugar-sweetened beverages, fruit juices
Score 0.9160.05b 0.6660.06a,c,d,e,f 0.9160.06b 1.160.07b 0.9160.06b 1.0160.07b
Servings/d2 1.860.04b,c,d 2.060.04a,c,d 1.560.05a,b,e,f 1.560.05a,b,e,f 1.860.04c,d 1.860.08c,d Nuts and legumes
Score 6.560.08b,f 5.060.08a,c,d,e,f 6.260.09b,d,e,f 6.760.10b,c,f 6.760.08b,c,f 4.060.08a,b,c,d,e Servings/d2 0.7060.01b,f 0.5160.01a,c,d,e,f 0.6860.01b,f 0.7160.01b,f 0.7460.01b,c,f 0.3960.01a,b,c,d,e
Red or processed meat
Score 3.860.05b,c 2.660.06a,d,e,f 2.560.07a,d,e,f 3.760.08b,c,e 4.060.05b,c,d 3.860.07b,c Servings/d2 0.9360.01b,c,d 1.260.01a,c,d,e,f 1.260.01a,b,d,e,f 0.9860.01a,b,c,e 0.9160.01b,c,d 0.9460.01b,c transFat
Score 8.060.02b,c,d,e 7.560.03a,c,d,e,f 8.260.03a,b,d,e,f 8.460.03a,b,c,e,f 7.960.02a,b,c,d 8.060.03b,c,d
% of energy 1.260.01b,c,d,e 1.460.01a,c,d,e,f 1.160.01a,b,d,e,f 1.160.01a,b,c,e,f 1.260.01a,b,c,d 1.260.01b,c,d Omega-3 FAs
Score 3.460.05b,d,f 3.260.05a,d,e,f 3.260.06d,e,f 4.360.06a,b,c,e,f 3.660.06b,c,d,f 4.660.08a,b,c,d,e mg/d 84.561.3b,d,f 80.061.2a,d,e,f 79.561.4d,e,f 10761.6a,b,c,e,f 89.061.4b,c,d,f 11661.9a,b,c,d,e
PUFAs
Score 5.560.03b,c,d,e 6.260.04a,d,e,f 6.160.04a,e,f 6.060.05a,b,e,f 5.760.03a,b,c,d,f 5.560.04b,c,d,e % of energy 6.460.03b,c,d,e 6.960.03a,d,e,f 6.960.04a,e,f 6.860.04a,b,e,f 6.660.03a,b,c,d,f 6.460.03b,c,d,e
Sodium
Score 6.760.06b,c,d,f 6.060.06a,c,d,e 5.460.08a,b,d,e,f 6.360.07a,b,c,e,f 6.560.07b,c,d,f 5.860.07a,c,d,e
g/d 3.1160.02b,c,d,f 3.3160.02a,c,e 3.4960.02a,b,d,e,f 3.2660.02a,c,e,f 3.1660.02b,c,d,f 3.3560.02a,c,d,e Alcohol
Score 5.560.08b,e 5.060.10a,f 5.460.09e 5.460.11e 4.860.08a,c,d,f 5.560.08b,e Drinks/d2 0.3560.02b 0.2660.02a,d,f 0.3460.02 0.3860.02b,e 0.3060.02d,f 0.3660.02b,e
1Values are means6SEs for the score of the overall AHEI and its individual components, with respective means6SEs of intakes below each food group or nutrient score.
Survey linear regressions were adjusted for age, sex, household income, marital status, educational attainment, years living in the United States, physical activity, smoking status, and center. In addition, nutrient and food group scores and intakes were adjusted for energy intake. AHEI score represents a range of 0–110 points; each individual score ranges
from 0 to 10 points. AHEI was significantly different by background,P,0.0001. Labeled means in a row with a common superscript letter differ by backgrounds (P,0.05), after
adjustment for TukeyÕs multiple pairwise comparisons:aMexican,bPuerto Rican,cCuban,dDominican,eCentral American,fSouth American. AHEI, Alternate Healthy Eating Index;
HCHS/SOL, Hispanic Community Health Study/Study of Latinos.
2Serving size equivalents are as follows: 0.5 cup of vegetables or whole fruit or legumes = 100 g; 0.5 cup of whole grains = 31 g; 8 ounces of sugar-sweetened beverages or fruit
but larger multiethnic studies across the United States should be
conducted to support this. Dietary assessment with 24-h recalls
has been deemed useful in providing details about foods
con-sumed, as well as culturally neutral data that can be compared
across cultural and population groups (25). In addition, the use
of an index that reflects the whole diet quality may convey
stronger associations with disease outcomes than individual
food or nutrient components (47). We adjusted for several
factors that may influence the studied associations, including a
proxy measure of acculturation (i.e., years of living in the
United States).
In conclusion, although healthier diet quality may protect
all Hispanics and Latinos against MetS, the strength of
association of AHEI and cardiometabolic factors varied by
ethnic background. The diverging results may explain why
some studies that group all Hispanics and Latinos when
analyzing associations between diet and disease outcomes can
have null or inconsistent results. Our study adds evidence that
can help shift the current paradigm of conducting
observa-tional and clinical studies on diet and lifestyles and disease in
Hispanics and Latinos together toward ethnicity-specific
analysis. A similar approach may be used for other
multieth-nic populations who tend to be grouped or to geographic
regions with diverse dietary habits. Successful dietary
inter-ventions for disease prevention are those that incorporate
culturally appropriate diet quality components (48). Our
study contributes to the understanding of ethnic differences in
diet and health and may therefore inform clinical and public
health strategies for each ethnicity to help improve diet
quality and to prevent eventual chronic conditions for the
growing population of US Hispanics and Latinos.
Acknowledgments
JM researched the literature, developed the study concept and
design, analyzed and interpreted the data, and organized and
wrote the manuscript; DS-A assisted with statistical analysis,
provided data verification and interpretation, and critically
revised and edited the manuscript; FBH, KLT, WCW, and RCK
contributed to the study design and concept, data
inter-pretation, and careful revision of the manuscript; and
MLD, LCG, MG, AMS-R, and LVH contributed to the
interpretation of data and critically reviewed and edited
the manuscript. All authors read and approved the final
manuscript.
References
1. Geiss LS, Wang J, Cheng YJ, Thompson TJ, Barker L, Li Y, Albright AL, Gregg EW. Prevalence and incidence trends for diagnosed diabetes among adults aged 20 to 79 years, United States, 1980–2012. JAMA 2014;312:1218–26.
2. Schneiderman N, Llabre M, Cowie CC, Barnhart J, Carnethon M, Gallo LC, Giachello AL, Heiss G, Kaplan RC, LaVange LM, et al. Prevalence of diabetes among Hispanics/Latinos from diverse backgrounds: the Hispanic Community Health Study/Study of Latinos (HCHS/SOL). Diabetes Care 2014;37:2233–9.
3. Statistical Fact Sheet. 2015 Update: Hispanics/Latinos & Cardiovascu-lar Diseases. American Heart Association. [Internet]; 2015. [cited 2015 Dec 21]. Available from: http://www.heart.org/idc/groups/heart-public/ @wcm/@sop/@smd/documents/downloadable/ucm_472912.pdf. 4. Lorenzo C, Williams K, Hunt KJ, Haffner SM. The National
Choles-terol Education Program–Adult Treatment Panel III, International Diabetes Federation, and World Health Organization definitions of the metabolic syndrome as predictors of incident cardiovascular disease and diabetes. Diabetes Care 2007;30:8–13.
TABLE 3 Associations between each 10-unit increase in AHEI and metabolic syndrome, and its cardiometabolic risk factors, among Hispanic and Latino adults without diabetes by ethnic background: HCHS/SOL 2008–20111
Mexicans (n= 5067)
Puerto Ricans (n= 1944)
Cubans (n= 1892)
Dominicans (n= 1175)
Central Americans (n= 1402)
South Americans (n= 926)
All (n= 12,406)
OR (95% CI) for metabolic syndrome2 0.70 (0.56, 0.87) 0.77 (0.51, 1.14) 1.07 (0.79, 1.46) 0.66 (0.43, 1.01) 0.58 (0.36, 0.91) 1.18 (0.72, 1.93) 0.78 (0.67, 0.91)
P 0.002 0.19 0.67 0.05 0.018 0.51 0.001
Waist circumference,2cm 21.7960.52 23.7661.23 0.8360.98 21.2061.20 21.0061.04 21.1161.01 21.5960.40
Standardizedb 20.087 20.134 0.031 20.051 20.044 20.058 20.083
P ,0.001 0.002 0.40 0.32 0.34 0.27 ,0.0001
Systolic blood pressure,3mm Hg 21.5860.54 20.8761.4 20.1061.0 21.2161.1 20.9661.0 21.6361.0 20.8860.46
Standardizedb 20.069 0.029 20.003 20.046 20.034 20.069 20.039
P 0.004 0.52 0.92 0.29 0.33 0.12 0.06
Diastolic blood pressure,3mm Hg 21.4760.43 21.8960.73 0.5860.70 0.0260.81 21.2960.84 21.7860.75 20.8860.28
Standardizedb 20.093 20.094 0.028 0.001 20.066 20.111 20.059
P ,0.001 0.01 0.41 0.98 0.12 0.02 0.002
Log serum TGs,4mg/dL 20.0560.02 20.0560.04 0.0160.04 20.0660.04 20.0360.04 0.0260.04 20.0460.01
Standardizedb 20.065 20.049 0.009 20.075 20.032 0.020 20.046
P 0.008 0.25 0.80 0.07 0.43 0.68 0.01
Serum HDL cholesterol,4mg/dL 1.0060.59 2.9561.1 1.4461.0 1.5761.1 3.7161.0 0.5860.94 1.3560.39
Standardizedb 0.052 0.123 0.058 0.078 0.160 0.029 0.076
P 0.09 0.007 0.13 0.15 ,0.001 0.54 0.001
Fasting plasma glucose, mg/dL 21.0760.27 21.2560.60 0.1860.45 20.3360.55 20.0160.54 0.9360.79 20.6360.20
Standardizedb 20.089 20.075 0.011 20.025 20.001 0.076 20.055
P ,0.001 0.04 0.69 0.55 0.99 0.23 0.002
1Values areb-coefficients6SEs (unless otherwise indicated), standardizedb-coefficients, andPvalues for individual cardiometabolic components. To convert TGs to mmol/L,
multiply values by 0.0113. To convert HDL cholesterol to mmol/L, multiply values by 0.0259. To convert fasting blood glucose to mmol/L, multiply values by 0.0555. AHEI, Alternate Healthy Eating Index; HCHS/SOL, Hispanic Community Health Study/Study on Latinos.
2Adjusted for age, sex, household income, marital status, educational attainment, years living in the United States, health insurance, physical activity, smoking status, energy
intake, and center. Metabolic syndrome was defined by using the harmonized guidelines from the 2009 Joint Scientific Statement, including use of medication (5).
3Blood pressure was additionally adjusted for use of antihypertensive medication.
5. Alberti KG, Eckel RH, Grundy SM, Zimmet PZ, Cleeman JI, Donato KA, Fruchart JC, James WP, Loria CM, Smith SC Jr. Harmonizing the metabolic syndrome: a joint interim statement of the International Diabetes Federation Task Force on Epidemiology and Prevention; National Heart, Lung, and Blood Institute; American Heart Association; World Heart Federation; International Atherosclerosis Society; and International Association for the Study of Obesity. Circulation 2009;120:1640–5. 6. Daviglus ML, Talavera GA, Aviles-Santa ML, Allison M, Cai J, Criqui
MH, Gellman M, Giachello AL, Gouskova N, Kaplan RC, et al. Prevalence of major cardiovascular risk factors and cardiovascular diseases among Hispanic/Latino individuals of diverse backgrounds in the United States. JAMA 2012;308:1775–84.
7. Derby CA, Wildman RP, McGinn AP, Green RR, Polotsky AJ, Ram KT, Barnhart J, Weiss G, Santoro N. Cardiovascular risk factor variation within a Hispanic cohort: SWAN, the Study of WomenÕs Health Across the Nation. Ethn Dis 2010;20:396–402.
8. Daviglus ML, Pirzada A, Talavera GA. Cardiovascular disease risk factors in the Hispanic/Latino population: lessons from the His-panic Community Health Study/Study of Latinos (HCHS/SOL). Prog Cardiovasc Dis 2014;57:230–6.
9. Rodriguez CJ, Allison M, Daviglus ML, Isasi CR, Keller C, Leira EC, Palaniappan L, Pina IL, Ramirez SM, Rodriguez B, et al. Status of cardiovascular disease and stroke in Hispanics/Latinos in the United States: a science advisory from the American Heart Association. Circulation 2014;130:593–625.
10. Heiss G, Snyder ML, Teng Y, Schneiderman N, Llabre MM, Cowie C, Carnethon M, Kaplan R, Giachello A, Gallo L, et al. Prevalence of metabolic syndrome among Hispanics/Latinos of diverse background: the Hispanic Community Health Study/Study of Latinos. Diabetes Care 2014;37:2391–9.
11. McCullough ML, Feskanich D, Stampfer MJ, Giovannucci EL, Rimm EB, Hu FB, Spiegelman D, Hunter DJ, Colditz GA, Willett WC. Diet quality and major chronic disease risk in men and women: moving toward improved dietary guidance. Am J Clin Nutr 2002;76:1261–71. 12. Fung TT, McCullough M, van Dam RM, Hu FB. A prospective study of overall diet quality and risk of type 2 diabetes in women. Diabetes Care 2007;30:1753–7.
13. Belin RJ, Greenland P, Allison M, Martin L, Shikany JM, Larson J, Tinker L, Howard BV, Lloyd-Jones D, Van Horn L. Diet quality and the risk of cardiovascular disease: the WomenÕs Health Initiative (WHI). Am J Clin Nutr 2011;94:49–57.
14. Akbaraly TN, Singh-Manoux A, Tabak AG, Jokela M, Virtanen M, Ferrie JE, Marmot MG, Shipley MJ, Kivimaki M. Overall diet history and reversibility of the metabolic syndrome over 5 years: the Whitehall II prospective cohort study. Diabetes Care 2010;33:2339–41. 15. Chiuve SE, Fung TT, Rimm EB, Hu FB, McCullough ML, Wang M,
Stampfer MJ, Willett WC. Alternative dietary indices both strongly predict risk of chronic disease. J Nutr 2012;142:1009–18.
16. Qiao Y, Tinker L, Olendzki BC, Hebert JR, Balasubramanian R, Rosal MC, Hingle M, Song Y, Schneider KL, Liu S, et al. Racial/ethnic disparities in association between dietary quality and incident diabetes in postmenopausal women in the United States: the WomenÕs Health Initiative 1993–2005. Ethn Health 2014;19:328–47.
17. Gao SK, Beresford SA, Frank LL, Schreiner PJ, Burke GL, Fitzpatrick AL. Modifications to the Healthy Eating Index and its ability to predict obesity: the Multi-Ethnic Study of Atherosclerosis. Am J Clin Nutr 2008;88:64–9.
18. Harmon BE, Boushey CJ, Shvetsov YB, Ettienne R, Reedy J, Wilkens LR, Le Marchand L, Henderson BE, Kolonel LN. Associations of key diet-quality indexes with mortality in the Multiethnic Cohort: the Dietary Patterns Methods Project. Am J Clin Nutr 2015;101:587–97. 19. Siega-Riz AM, Sotres-Alvarez D, Ayala GX, Ginsberg M, Himes JH, Liu
K, Loria CM, Mossavar-Rahmani Y, Rock CL, Rodriguez B, et al. Food-group and nutrient-density intakes by Hispanic and Latino backgrounds in the Hispanic Community Health Study/Study of Latinos. Am J Clin Nutr 2014;99:1487–98.
20. Gans KM, Burkholder GJ, Upegui DI, Risica PM, Lasater TM, Fortunet R. Comparison of baseline fat-related eating behaviors of Puerto Rican, Dominican, Colombian, and Guatemalan participants who joined a cholesterol education project. J Nutr Educ Behav 2002;34:202–10. 21. Sorlie PD, Aviles-Santa LM, Wassertheil-Smoller S, Kaplan RC,
Daviglus ML, Giachello AL, Schneiderman N, Raij L, Talavera G, Allison M, et al. Design and implementation of the Hispanic Commu-nity Health Study/Study of Latinos. Ann Epidemiol 2010;20:629–41.
22. Lavange LM, Kalsbeek WD, Sorlie PD, Aviles-Santa LM, Kaplan RC, Barnhart J, Liu K, Giachello A, Lee DJ, Ryan J, et al. Sample design and cohort selection in the Hispanic Community Health Study/Study of Latinos. Ann Epidemiol 2010;20:642–9.
23. Manuals and forms of the Hispanic Community Health Study/Study of Latinos [Internet]. c2008 [updated 2016; cited 2016 May 13]. Available from: http://www2.cscc.unc.edu/hchs/manuals-forms.
24. Mossavar-Rahmani Y, Shaw PA, Wong WW, Sotres-Alvarez D, Gellman MD, Van Horn L, Stoutenberg M, Daviglus ML, Wylie-Rosett J, Siega-Riz AM, et al. Applying recovery biomarkers to calibrate self-report measures of energy and protein in the His-panic Community Health Study/Study of Latinos. Am J Epidemiol 2015;181:996–1007.
25. Subar AF, Freedman LS, Tooze JA, Kirkpatrick SI, Boushey C, Neuhouser ML, Thompson FE, Potischman N, Guenther PM, Tarasuk V, et al. Addressing current criticism regarding the value of self-report dietary data. J Nutr 2015;145:2639–45.
26. Tooze JA, Kipnis V, Buckman DW, Carroll RJ, Freedman LS, Guenther PM, Krebs-Smith SM, Subar AF, Dodd KW. A mixed-effects model approach for estimating the distribution of usual intake of nutrients: the NCI method. Stat Med 2010;29:2857–68.
27. Alberti KG, Zimmet P, Shaw J. Metabolic syndrome—a new world-wide definition. A consensus statement from the International Diabetes Federation. Diabet Med 2006;23:469–80.
28. Ulrichsen SP, Mor A, Svensson E, Larsen FB, Thomsen RW. Lifestyle factors associated with type 2 diabetes and use of different glucose-lowering drugs: cross-sectional study. PLoS One 2014;9: e111849.
29. Geiss LS, James C, Gregg EW, Albright A, Williamson DF, Cowie CC. Diabetes risk reduction behaviors among U.S. adults with prediabetes. Am J Prev Med 2010;38:403–9.
30. Ram´ırez-Vargas E, Arnaud-Vinas Mdel R, Delisle H. Prevalence of the metabolic syndrome and associated lifestyles in adult males from Oaxaca, Mexico. Salud Publica Mex 2007;49:94–102.
31. Gregory CO, McCullough ML, Ramirez-Zea M, Stein AD. Diet scores and cardio-metabolic risk factors among Guatemalan young adults. Br J Nutr 2009;101:1805–11.
32. Huffman FG, Zarini GG, McNamara E, Nagarajan A. The Healthy Eating Index and the Alternate Healthy Eating Index as predictors of 10-year CHD risk in Cuban Americans with and without type 2 diabetes. Public Health Nutr 2011;14:2006–14.
33. Banna JC, Fialkowski MK, Townsend MS. Misreporting of dietary intake affects estimated nutrient intakes in low-income Spanish-speaking women. J Acad Nutr Diet 2015;115:1124–33.
34. Shtir CJ, Marjoram P, Azen S, Conti DV, Le Marchand L, Haiman CA, Varma R. Variation in genetic admixture and population structure among Latinos: the Los Angeles Latino Eye Study (LALES). BMC Genet 2009;10:71.
35. Choudhry S, Coyle NE, Tang H, Salari K, Lind D, Clark SL, Tsai HJ, Naqvi M, Phong A, Ung N, et al. Population stratification con-founds genetic association studies among Latinos. Hum Genet 2006; 118:652–64.
36. Mattei J, Bhupathiraju S, Tucker KL. Higher adherence to a diet score based on American Heart Association recommendations is associated with lower odds of allostatic load and metabolic syndrome in Puerto Rican adults. J Nutr 2013;143:1753–9.
37. Rehm CD, Monsivais P, Drewnowski A. The quality and monetary value of diets consumed by adults in the United States. Am J Clin Nutr 2011;94:1333–9.
38. Hiza HA, Casavale KO, Guenther PM, Davis CA. Diet quality of Americans differs by age, sex, race/ethnicity, income, and education level. J Acad Nutr Diet 2013;113:297–306.
39. CDC. National Health and Nutrition Examination Survey: note on 2007–2010 Sampling Methodology [Internet]; 2011 [updated 2015; cited 2015 Dec 21]. Available from: http://www.cdc.gov/nchs/nhanes/ nhanes2007–2008/sampling_0708.htm/.
40. Wang DD, Leung CW, Li Y, Ding EL, Chiuve SE, Hu FB, Willett WC. Trends in dietary quality among adults in the United States, 1999 through 2010. JAMA Intern Med 2014;174:1587–95.
42. Perez LG, Arredondo EM, Elder JP, Barquera S, Nagle B, Holub CK. Evidence-based obesity treatment interventions for Latino adults in the U.S.: a systematic review. Am J Prev Med 2013;44:550–60.
43. Mier N, Ory MG, Medina AA. Anatomy of culturally sensitive interventions promoting nutrition and exercise in Hispanics: a critical examination of existing literature. Health Promot Pract 2010;11:541–54. 44. Yang K, Lee YS, Chasens ER. Outcomes of health care providersÕ
recommendations for healthy lifestyle among U.S. adults with predia-betes. Metab Syndr Relat Disord 2011;9:231–7.
45. Dorsey R, Songer T. Lifestyle behaviors and physician advice for change among overweight and obese adults with prediabetes and diabetes in the United States, 2006. Prev Chronic Dis 2011;8:A132.
46. Wang X, Jung M, Mossavar-Rahmani Y, Sotres-Alvarez D, Espinoza Giacinto RA, Pirzada A, Reina SA, Casagrande SS, Wang T, Aviles-Santa ML, et al. Macronutrient intake, diagnosis status, and glycemic control among US Hispanics/Latinos with diabetes. J Clin Endocrinol Metab 2016;101:1856–64.
47. Wirt A, Collins CE. Diet quality—what is it and does it matter? Public Health Nutr 2009;12:2473–92.