AMBIENT OUTDOOR HEAT AND HEAT-RELATED ILLNESS IN FLORIDA
Laurel Harduar Morano
A dissertation submitted to the faculty at the University of North Carolina at Chapel Hill in partial fulfillment of the requirements for the degree of Doctor of Philosophy in the Department of
Epidemiology in the Gillings School of Global Public Health.
Chapel Hill 2016
© 2016
ABSTRACT
Laurel Harduar Morano: Ambient Outdoor Heat and Heat-related Illness in Florida (Under the direction of Steve Wing)
Environmental heat stress results in adverse health outcomes and lasting physiological damage. These outcomes are highly preventable via behavioral modification and community-level adaption. For prevention, a full understanding of the relationship between heat and heat-related outcomes is necessary. The study goals were to highlight the burden of heat-related illness (HRI) within Florida, model the relationship between outdoor heat and HRI morbidity/mortality, and to identify community-level factors which may increase a population’s vulnerability to increasing heat. The heat-HRI relationship was examined from three perspectives: daily outdoor heat, heat waves, and assessment of the additional impact of heat waves after accounting for daily outdoor heat. The study was conducted among all Florida residents for May-October, 2005–2012. The exposures of interest were maximum daily heat index and temperature from Florida weather stations. The outcome was work-related and non-work-related HRI emergency department visits, hospitalizations, and deaths. A generalized linear model (GLM) with an overdispersed Poisson distribution was used. GLMs were run for each sub-region within Florida and statewide estimates were obtained via random effects meta-regression. The results of the burden analysis indicated that the rates of HRI varied by geography, data source, and work-related status. The sub-groups with the highest relative rates were for males and rural residents. HRI rates increased with increasing heat index/temperature. The strongest effect was associated with the current day’s heat index/temperature. As heat
To all the pray warriors in my life whose prayers have protected me, sustained me, and guided my path. And to my grandmothers, Leceta Pryce, Octavia Richardson, and Muriel Carpenter; your
ACKNOWLEDGEMENTS
TABLE OF CONTENTS
LIST OF TABLES ... xiii
LIST OF FIGURES ... xv
LIST OF EQUATIONS ... xix
LIST OF ABBREVIATIONS ... xx
CHAPTER 1. INTRODUCTION ... 1
CHAPTER 2. REVIEW OF THE LITERATURE ... 3
Historical Background ... 3
Physiology ... 6
Mechanisms of Heat Dissipation ... 7
Body Temperature Regulation ... 9
Acclimatization ... 10
Biological Factors Affecting Thermoregulation ... 10
Disease: Heat-Related Illness ... 11
Pathophysiology ... 11
Diagnosis ... 12
Other Potential Heat-Outcomes ... 14
Diseases of the Circulatory System ... 16
Diseases of the Respiratory System ... 18
Other Diseases ... 18
Environmental Parameters ... 19
Proxies for Heat Exposure... 21
Collection of the Basic Environmental Parameters ... 25
Air Pollution ... 26
Epidemiology ... 27
Epidemiology of HRI in the General Population ... 29
Occupational HRI Epidemiology ... 32
Potential Susceptibility Factors ... 35
Age ... 35
Gender ... 36
Race/Ethnicity ... 37
Socio-economic Status ... 39
Medical Factors ... 40
Air-Conditioning ... 40
Other Factors ... 41
Urban Heat Island Effect ... 41
Rural areas ... 43
Key Aspects of Modeling the Heat-Health Relationship ... 44
Exposure-response Curve ... 44
Thresholds ... 45
Lagged Effects ... 46
Heat Waves ... 47
Selected Research Gaps ... 49
Heat Wave Effect Modification ... 53
Data Sources for Morbidity and Mortality ... 54
CHAPTER 3. SPECIFIC AIMS ... 56
CHAPTER 4. MATERIALS ... 58
Study Population ... 58
Outcome Assessment ... 59
Disclaimer ... 62
Exposure Assessment ... 62
CHAPTER 5. A COMPREHENSIVE EVALUATION OF THE BURDEN OF HEAT-RELATED ILLNESS WITHIN THE FLORIDA POPULATION ... 67
Introduction ... 67
Methods ... 68
Data Sources ... 68
Defining HRI ... 69
Variable Selection ... 70
Analysis ... 72
Results ... 73
HRI Seasonality ... 73
HRI Occurrence ... 73
Emergency Department Visits ... 73
Hospitalizations ... 75
Deaths ... 76
Discussion ... 77
Limitations... 82
CHAPTER 6. HEAT-RELATED MORBIDITY AND MORTALITY ASSOCIATED WITH AMBIENT OUTDOOR HEAT AND HEAT
WAVES ... 89
Introduction ... 89
Materials and Methods ... 91
Study Population ... 91
Outcome: Morbidity Data ... 92
Outcome: Mortality Data ... 92
Meteorological Data ... 93
Ambient Heat ... 94
Heat Waves ... 95
Statistical Analysis ... 96
Software... 97
Results ... 97
ambient Heat ... 99
Ambient Heat: Non-work-related ... 99
Ambient Heat: Work-related ... 100
Heat Waves ... 100
Heat Waves: Non-work-related ... 101
Heat Waves: Work-related ... 101
Ambient Heat and heat waves ... 102
Discussion ... 102
Ambient Heat ... 103
Heat Waves ... 105
Strength and Limitations ... 109
Conclusion ... 111
CHAPTER 7. COMMUNITY-LEVEL FACTORS AFFECTING THE RELATIONSHIP BETWEEN AMBIENT OUTDOOR HEAT AND HEAT-RELATED ILLNESS ... 120
Introduction ... 120
Materials and Methods ... 121
Modification Variables ... 122
Parameterization of modification variables ... 127
Statistical Analysis ... 128
Software... 129
Results ... 129
Discussion ... 132
Limitations... 136
Conclusion ... 138
CHAPTER 8. DISCUSSION ... 145
Aim 1 Discussion ... 145
Aim 2 Discussion ... 147
Strength and Limitations ... 149
Summary ... 154
APPENDIX A. SUPPLEMENTAL FIGURES AND TABLES ... 156
APPENDIX B. RESULTS OF ALL TEMPERATURE ANALYSES ... 163
Ambient Heat: Non-work-related HRI ... 163
Heat Waves: non-work-related ... 164
LIST OF TABLES
Table 2-1. Comparison of symptoms related to Heat Exhaustion and Heat
Stroke* [48, 55, 59] ... 13 Table 4-1. Selected characteristics of the Florida population from the
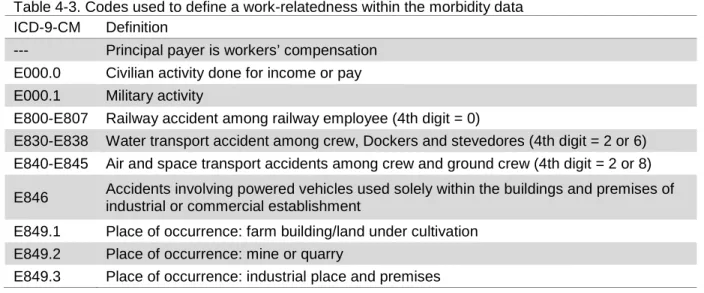
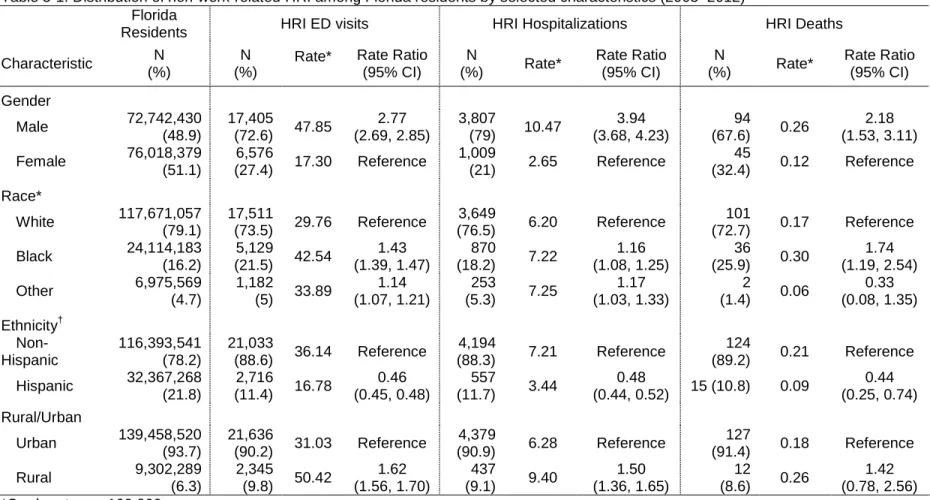
American Community Survey average 5-year estimate (2007–2011) ... 58 Table 4-2. Case definitions for HRI morbidity and mortality ... 61 Table 4-3. Codes used to define a work-relatedness within the morbidity data ... 62 Table 5-1. Distribution of non-work-related HRI among Florida residents by
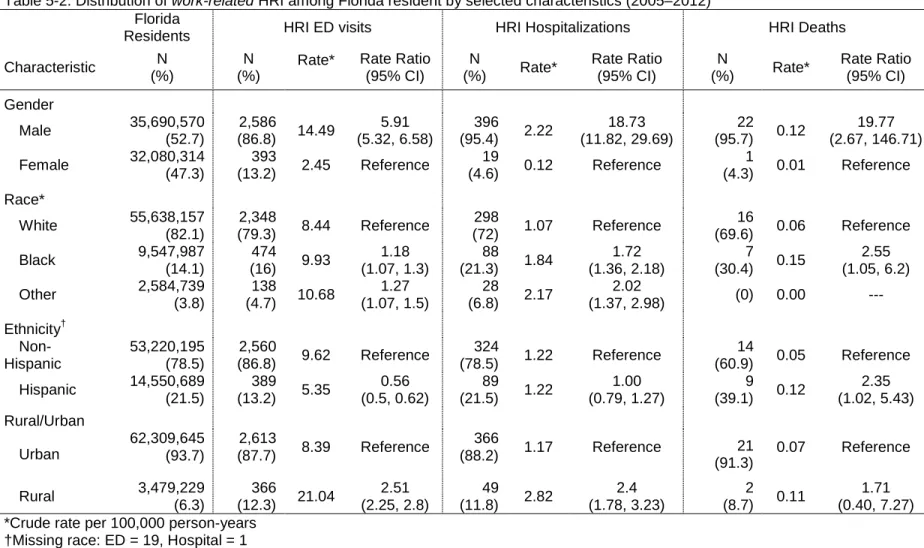
selected characteristics (2005–2012) ... 85 Table 5-2. Distribution of work-related HRI among Florida resident by
selected characteristics (2005–2012) ... 86 Table 6-1. Summary of heat related illness (HRI) morbidity and mortality
counts and rates among Florida residents by National Weather
Service (NWS) region and work-related status (2005–2012) ... 117 Table 6-2. Number of distinct heat waves with duration of two days or longer
in Florida stratified by National Weather Services (NWS) region and
maximum daily heat index intensity thresholds (2005–2012) ... 118 Table 6-3. Proportion of total heat-related illness (HRI) morbidity cases
occurring on a two-day or longer heat wave with data stratified by
intensity definition* and National Weather Service (NWS) region ... 118 Table 6-4. Assessment of an added heat-wave effect in Florida (2005–2012)
via comparison of the model of ambient heat index (i.e., no heat wave term) and models with an additional term for a two-day or longer heat wave stratified by heat wave definition and work-related
status . ... 119 Table 7-1. Summary statistics related to the distribution of each the
susceptibility factors ... 141 Table 7-2. Identification of population-level factors which modify the
heat-health slope via comparison of factor-specific meta-regression
models to an intercept only model ... 142 Table 7-3a. Comparison of the magnitude of modification for the heat–HRI
morbidity relationship within each susceptibility factor stratified by the
linear components of the exposure-response curve. ... 143 Table A-1. Comparison of Akaike information criterion (AIC) values for
different heat metric parametrization stratified by model specification
and National Weather Service (NWS) region.* ... 161 Table A-2. Assessment of an added heat-wave effect in Florida (2005–2012)
via comparison of the model of ambient heat index (i.e., no heat wave term) and models with an additional term for a four-day or longer heat wave stratified by heat wave definition and work-related
Table B-1. Number of distinct heat waves in Florida stratified by National Weather Service (NWS) region, duration, and maximum daily
temperature intensity thresholds (2005–2012) ... 171 Table B-2. Proportion of total non-work-related heat-related illness (HRI)
morbidity cases occurring on a heat wave day stratified by heat wave
definition* and National Weather Service (NWS) region (2005–2012) ... 171 Table B-3. Assessment of an added heat-wave effect in Florida (2005–2012)
via comparison of the model of ambient temperature (i.e., no heat wave term) and models with an additional term for a two-day or longer heat wave stratified by temperature definition and
work-related status. ... 172 Table C-1. Assessment of the number of lag days to be included when
modeling the relationship between non-work-related HRI and
maximum daily temperature (2005–2012) ... 174 Table C-2. Non-work-related HRI rate ratio and 95% confidence interval for a
1°F increase in maximum daily temperature on the current or on
each of the prior three days (2005–2012)* ... 174 Table C-3. Assessment of the number of lag days to be included when
modeling the relationship between work-related HRI and maximum
daily temperature (2005–2012) ... 175 Table C-4. Work-related HRI rate ratio and 95% confidence interval for a 1°F
increase in maximum daily temperature on the current or on each of
the prior three days (2005–2012)* ... 176 Table C-5. Assessment of the number of lag days to be included when
modeling the relationship between non-work-related HRI and
maximum daily heat index (2005–2012) ... 177 Table C-6. Non-work-related HRI rate ratio and 95% confidence interval for a
1°F increase in maximum daily heat index on the current or on each
of the prior three days (2005–2012)* ... 178 Table C-7. Assessment of the number of lag days to be included when
modeling the relationship between work-related HRI and maximum
daily heat index (2005–2012) ... 179 Table C-8. Work-related HRI rate ratio and 95% confidence interval for a 1°F
increase in maximum daily heat index on the current or on each of
the prior three days (2005–2012)* ... 179 Table D-1. Multi-variate meta-regression model results summarizing the
LIST OF FIGURES
Figure 2-1. Human body temperature maintenance conceptualized in two parts.For cold periods (a) the core is reduced in order to conserve body heat for crucial areas. For warm periods (b) the core is
increased to facilitate whole body cooling. (Reproduced from Wenger
2001[46]) ... 7 Figure 2-2. A simplified Directed Acyclic Graph depicting the effects of heat
on morbidity and mortality.The assumption of this DAG is that temperature is a proxy for heat exposure. The solid black line represents the direct effect while the dotted line represents the indirect effect. The total effect is represented by both the solid and
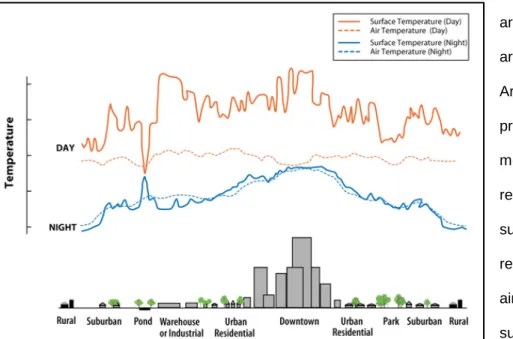
dotted line. ... 26 Figure 2-3. Example of variations of surface and atmospheric temperatures
in relation to various levels of urbanization(Reproducedfrom EPA
2008 [236])... 42
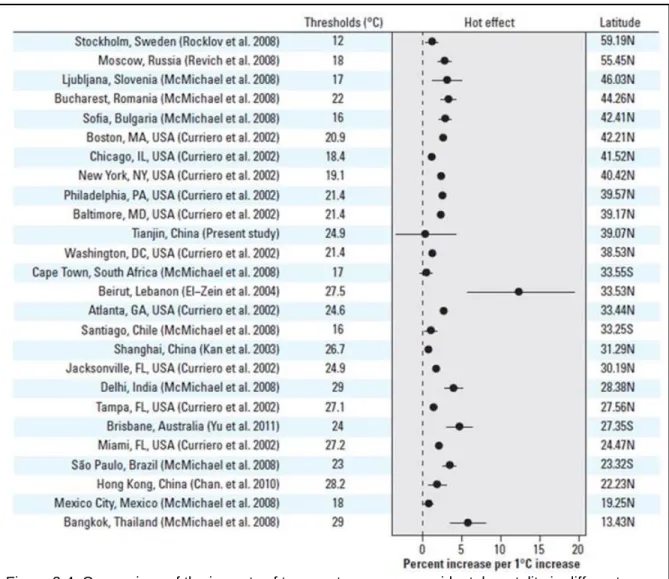
Figure 2-4. Comparison of the impacts of temperature on non-accidental mortality in different populations ordered by latitude. (Reproduced
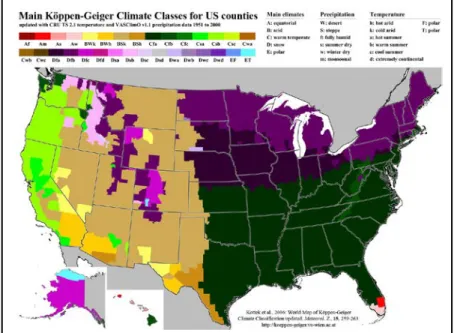
with permission from Environmental Health Perspectives [4]) ... 46 Figure 2-5. U.S. climate classifications:The majority of the southern U.S. is
classified as having a warm climate with fully humid precipitation and hot summers (Cfa), although, there is a swath with warm summers (Cfb). Note that a hot summer is defined as a maximum mean monthly temperature ≥22°C (71.6°F). (Reproduced from Kottek et al.
2006 [259])... 50 Figure 4-1. National Weather Service regions and weather station locations.
Florida is divided into seven National Weather Service regions with
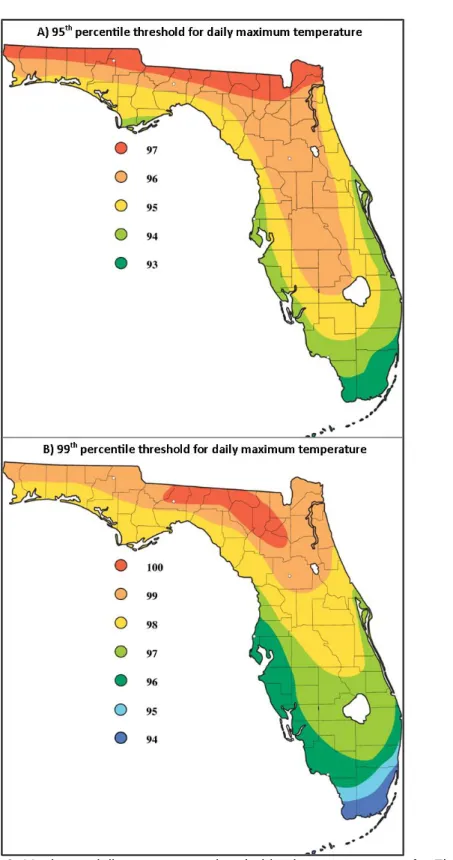
the Key West region only covering a small land area. ... 63 Figure 4-2. Maximum daily temperature threshold value contour maps for
Florida. The colors on the map represent the threshold temperature
in Fahrenheit within a contour area. ... 66 Figure 5-1. County-specific rates of HRI ED visits and hospitalizations
among Florida residents during the warm season (2005–2012): (A) Non-work-related HRI ED visits rates per 100,000 person-years; (B) work-related HRI ED visits rates per 100,000 worker-years; (C) Non-work-related HRI hospitalizations rates per 100,000 person-years;
(D) work-related HRI hospitalizations rates per 100,000 worker-years ... 87 Figure 5-2. Age-specific rates of non-work-related (A) and work-related (B)
HRI identified among Florida residents (2005–2012). All rates are per 100,000 person years. In panel (A), the non-work-related morbidity rates (left y-axis) are two orders of magnitude larger than the non-work-related mortality rates (right y-axis). In panel (B), the age distribution for work-related HRI starts at age 16 and the morbidity rates are approximately an order of magnitude larger than the
Figure 6-1. Box-and-whisker plot of maximum daily heat index between May-October (2005–2012) stratified by National Weather Service region. The vertical line represents the median heat index value for each region, and the asterisk represents the mean heat index value for each region. The median and mean heat index value for the state is
93.8°F and 94.1°F, respectively. ... 112 Figure 6-2. Modeled relationship between non-work-related HRI morbidity
rates and maximum daily heat index on the current day, lag 0, and the prior day, lag 1, for May-October, 2005–2012 (solid line). The hashed lines are the 95% confidence intervals. The grey dots are the region-specific rate ratios for every two degrees of heat index (e.g., 80-81, 82-83…). The histogram represents the observed number of cases occurring at each heat index degree. All heat index values had at least six cases during the study period except a heat index of
121°F and 122°F which had one and four cases, respectively. ... 113 Figure 6-3. Modeled relationship between non-work-related HRI death rates
and maximum daily heat index on the current day, lag 0, and prior day, lag 1, for May-October, 2005–2012 (solid line). The grey dots are the region-specific rate ratios for every two degrees of heat index (e.g., 80-81, 82-83…). The hashed lines are the 95% confidence intervals. The histogram represents the observed number of cases occurring at each heat index degree. Note, for instance, that there was one death cases where the current day’s heat index was a
115°F. ... 114 Figure 6-4. Modeled relationship between work-related HRI morbidity rates
and maximum daily heat index on the current day, lag 0, and the prior day, lag 1, for May-October, 2005–2012 (solid line). The
hashed lines are the 95% confidence intervals. The grey dots are the region-specific rate ratios for every two degrees of heat index (e.g., 80-81, 82-83…). The histogram represents the observed number of cases occurring at each heat index degree. There were zero HRI non-work-related cases at 120°F and 122°F. All other heat index
values had at least one case during the study period. ... 115 Figure 6-5. Forest plot of the rate ratio (RR) and 95% confidence intervals for
non-work-related (A) and work-related (B) HRI morbidity rates occurring during a two-day or longer heat wave compared to rates on non-heat wave days, stratified by varying heat wave definitions. The range of threshold values for the 95th percentile of maximum daily
heat index was 101-109°F and for the 99th percentile was 101-115°F. ... 116 Figure 7-1. Factor specific maps with each factor stratified by the analysis
categories where the geographic area is the zip code-station group: A) percent of the area population age 15-44 years, B) percent of the population who reported Black race alone, C) percent of houses which were renter occupied, D) percent of the population who
reported other race. ... 139 Figure 7-2. Factor specific maps with each factor stratified by the analysis
categories where the geographic area is the zip code-station group: A) percent impervious surfaces in the area, B) percent of the
population who speaks another language other than English at home
who also speak English less than ‘very well’. ... 140 Figure A-1. Non-work-related HRI morbidity and mortality rates for Florida
residents stratified by month and data source, 2005–2012 (Total cases: ED visits = 27,028; Hospitalizations = 5324; Deaths = 158). All rates are per 100,000 person-years. Note that the morbidity rates (left y-axis) are two orders of magnitude larger than the mortality
rates (right y-axis). ... 156 Figure A-2. Work-related HRI morbidity and mortality rates for Florida
residents stratified by month and data source, 2005–2012 (Total cases: ED visits = 3,234; Hospitalizations = 432; Deaths = 25). All rates are per 100,000 person-years. Note that the morbidity rates (left y-axis) are two orders of magnitude larger than the mortality
rates (right y-axis). ... 156 Figure A-3. Distribution of co-morbid outcomes among Florida residents
identified with HRI in the ED stratified by work-related status (2005–
2012) ... 157 Figure A-4.Distribution of co-morbid outcomes among Florida residents
identified with HRI in the hospital stratified by work-related status
(2005–2012) ... 157 Figure A-5. County-specific counts of HRI ED visits and hospitalizations
among Florida residents during the warm season (2005–2012): (A) non-work-related HRI ED visits; (B) work-related HRI ED visits; (C) Non-work-related HRI hospitalizations; (D) work-related HRI
hospitalizations ... 158 Figure A-6. Percent of missing data for daily temperature (top panel) and
daily heat index (bottom panel) over the entire study period,
May-October 2005–2012, by weather station. ... 159 Figure A-7. Forest plot of the rate ratio (RR) and 95% confidence intervals for
non-work-related (A) and work-related (B) HRI morbidity rates occurring during a four-day or longer heat wave compared to rates on non-heat wave days, stratified by varying heat wave definitions. The range of threshold values for the 95th percentile of maximum daily heat index was 101-109°F and for the 99th percentile was 101-115°F. Note that reference group, non-heat wave days, varied by
definition. ... 160 Figure B-1. Box-and-whisker plot of maximum daily temperature
May-October (2005–2012) stratified by National Weather Service region. The vertical line represents the median temperature value for each region, and the asterisk represents the mean temperature value for each region. The median and mean temperature value for the state
is 88°F. ... 166 Figure B-2. Modeled relationship between non-work-related HRI morbidity
cases occurring at each temperature degree. All other temperature values had at least four cases during the study period except a
temperature of 106°F which had one case. ... 167 Figure B-3. Modeled relationship between non-work-related HRI death rates
and maximum temperature on the current day, lag 0, and the prior day, lag 1, for May-October, 2005–2012 (solid line). The hashed lines are the 95% confidence intervals. The grey dots are the region-specific rate ratios for every two degrees of temperature (e.g., 80-81, 82-83…). The histogram represents the observed number of cases occurring at each temperature degree. Note that the majority of the region-specific rate ratios are unstable and considerably far outside
the y-axis range. ... 168 Figure B-4. Modeled relationship between work-related HRI morbidity rates
and maximum daily temperature on the current day, lag 0, and the prior day, lag 1, for May-October, 2005–2012 (solid line). The
hashed lines are the 95% confidence intervals. The grey dots are the region-specific rate ratios for every two degrees of temperature (e.g., 80-81, 82-83…). The histogram represents the observed number of cases occurring at each temperature degree. Above a temperature of 101°F there was only one case which occurred at a temperature of
105°F. ... 169 Figure B-5. Forest plot of the rate ratios (RR) and 95% confidence intervals
for non-work-related HRI morbidity rates on heat wave days versus non heat wave stratified by varying heat wave definitions. The range of threshold values for the 95th percentile was 93-97°F and for the 99th percentile was 94-100°F. Note that the comparison group for a four day or longer (4-day) heat wave includes two and three consecutive days above the threshold. There were zero 4-day heat waves with a threshold at the 99th percentile in the Key West Region during the study period. There were also zero heat waves,
regardless of duration, with a threshold of 98°F for the Miami and
LIST OF EQUATIONS
Equation 4-1. Water Vapor Content ... 64
Equation 4-2. Water Vapor Capacity ... 64
Equation 4-3. Relative Humidity ... 64
Equation 4-4. Heat Index ... 64
Equation 6-1. Algebraic representation of the outcome and general ambient exposure ... 96
Equation 6-2. Algebraic representation of model of the outcome and episodic exposure (heat waves) ... 96
LIST OF ABBREVIATIONS
ACS American Community Survey
AHCA Agency for Health Care Administration
AIC Akaike information criterion
AWOS Automated Weather Observation System
ASOS Automated Surface Observing System
BRFSS Behavioral Risk Factor Surveillance
C Celsius
Cal/OSHA California Occupational Safety and Health Administration
CDC Centers for Disease Control and Prevention
CFOI Census of Fatal Occupational Injuries
CI Confidence Interval
CO Carbon monoxide
COOP Cooperative Observer Program
CPS Current Population Survey
DF Degrees of freedom
Ecode External cause of injury code
ED Emergency department
FAWN Florida agricultural weather network
FDOH Florida Department of Health
FTE Full time equivalent
HRI Heat-related illness
HHWS Heat health warning systems
HVI Heat Vulnerability Index
HW Heat wave
ICD-9-CM International Classification of Diseases, Ninth Revision, Clinical Modification
ICD-10 International Classification of Diseases, Tenth Edition
IQR Interquartile range
IRR Incidence rate ratio
IPCC Intergovernmental Panel on Climate Change
L Liter
LRT Likelihood ratio test
mL Milliliter
MRLC Multi-Resolution Land Characteristics Consortium
NLCD National Land Cover Database
NO2 Nitrogen dioxide
NWS National Weather Service
OSHA Occupational safety and health administration
PM10 Particulate matter less than 10 micrometers
PM2.5 Particulate matter less than 2.5 micrometers
PM10 Particulate matter less than 10 micrometers
RHRC Rural Health Research Center
RR Rate ratio
SD Standard deviation
SE Standard error
SES Socio-economic status
SOC Standard Occupational Classification
SOII Survey of Occupational Injuries and Illnesses
SSC Spatial synoptic classification
U.S. United States
WBGT Wet bulb globe temperature
WFO Weather forecasting office
WWAMI Washington, Wyoming, Alaska, Montana, and Idaho
CHAPTER 1.
INTRODUCTION
Environmental heat stress is associated with increased morbidity and mortality among humans. The general physiological mechanism is clear; when exposed to prolonged heat the body loses the ability to maintain thermo-equilibrium resulting in illness and death. However, humans have an innate ability to adapt to their environment. As such, behavioral modifications, when implemented, have a direct impact on the prevention of heat-related outcomes. Regardless, heat can be a
hazardous to humans, even in tropical and sub-tropical climates where individuals and communities are adapted to their environment [1-4].
The National Weather Service (NWS) estimates that between 1986 and 2015 the average number of heat-related fatalities per year in the United States (U.S.) was higher than any other weather-related occurrence [5]. Over the last 30 years, numerous heat-waves across the globe have resulted in an awareness of environmental heat as a public health threat [2, 6-8]. This has led to increased surveillance of heat-related outcomes, identification of individual- and community-level risk-factors, and research into the relationship between heat and heat-related outcomes both during and outside a heat wave [2, 9-12].
population may vary, impacting the overall population’s ability to adapt to increasing heat [14, 16]. Additionally, studies of the relationship between heat and heat-related outcomes have resulted in the development of local strategies, triggered by weather forecasts, for mitigating the effects of heat and protecting the population.
However, much of this work globally, has been conducted in higher latitudes and the impact of heat on populations in sub-tropical and tropical climates has been assumed to be minimal [17-19]}. As a result there is a large gap in the literature about the burden of heat-related outcomes, the identification of risk factors, and the relationship between heat and heat-related outcomes in lower latitudes.
Environmental heat is increasing as a result of global climate change. The mean global temperatures between 1906 and 2005 increased by 0.7°Celsius (C) with the majority of the increase occurring in the latter time period – an increase of 0.13°C per decade between 1956 and 2006 [20]. The Intergovernmental Panel on Climate Change (IPCC) reports that since the 1950’s the annual number of extreme heat events (heat waves) as well as the annual number of warm nights have increased globally. To a lesser degree, the annual number of hot days has also increased [21]. The IPCC defined a warm night or day as a day where the minimum or maximum temperature,
respectively, exceeds the 90th percentile based on the historical distribution of daily temperature [21]. An extreme heat event is an episode of several consecutive warm days and nights [21].
CHAPTER 2.
REVIEW OF THE LITERATURE
HISTORICAL BACKGROUND
Throughout recorded history there has been an observable association between high temperatures (or hot days) and morbidity/mortality. Early records of heat-related illness (HRI) are mostly from military campaigns. Both the Bible1 and Homer’s Iliad spoke of HRI during military operations [3]. In 24 BCE, a roman military campaign to Arabia was unsuccessful due to HRI among the soldiers [22]. In 400 BCE, Herodotus recorded the relationship between work, heavy clothing, and heat stress in a battle between the Athenians and the Spartans [3]. According to Plutarch (50-120 CE), at the end of Alexander the Great’s campaign he lost approximately 75 percent of his soldiers and entourage to dehydration during the two month (September/October) march from the Hyphasis River2 to the Persian palace at Pura [3, 23]. During the crusades, King Edward’s heavily armor-clad soldiers lost the final battle with the Saracens, who wore light armor, in large part due to HRI [24]. Additionally, the English soldiers did preparations for battle during the heat of the day, whereas, the Saracens completed their preparations in the cool of the evenings; an early historical reference to a behavioral heat adaption strategy [24]. Further behavioral modification was reported in 1774 when De Meyserey, a French army surgeon, proposed the use of white leather helmets by soldiers to prevent the effects of the sun’s rays [25].
Among the civilian population, HRIs were also alluded to in the Bible3 [26]. In ancient Greece, heat stroke was referred to as siriasis after the dog-star Sirius [27]. In ancient times this star was
1
Joshua 10:12-13
2
Modern name = Beas River, in northern India
3
associated with the hottest months of summer. In 1902, in his treatise to the American Medical Journal of Sciences, Dr. Joseph Spellissy laments that there is very little information available between Antiquity and the writings of Domini Petri Foresti who spoke of an epidemic of apoplexy4 during hot and humid conditions in Italy in 1562 [30]. Until about 1850, HRI was usually confused with apoplexy [31]. The identification of historical instances of HRI is often due to the symptoms recorded and the time of year or temperature reported. For instance, Gjuro Baglivi observed an epidemic of apoplexy during the unusually hot summers of 1694 and 1695 in Rome [30, 31]. In 1789, Dr. Benjamin Rush described the symptoms of HRI but suggested the disorder was caused by drinking cold water in warm weather [30]. In 1818, citations were posted at water pumps in Philadelphia warning of sudden death from drinking cold water [31].
Within the 19th century, cases of suspected HRIs were medically observed, treated, and autopsied. At the beginning of the 19th century the common treatment for HRI was blood-letting. Towards the end of the 19th century, the medical community shifted their treatment methods to the more modern day treatment of cooling the individual [30]. This was in part spurred on by mid-19th century findings identifying HRI as a separate disease from apoplexy and the findings that the disorder caused by drinking cold water originated from the body overheating [30]. The idea that heat was responsible for the illnesses and not the sun alone was also observed by medical experts of the time, mainly from observations in an occupational setting such as deaths in the military, in sugar refineries, in laundries, and the illness of a Black preacher giving a sermon in a crowed and overheated church [25, 26, 30, 31]. At this time, the leading medical experts began to suspect that high humidity was also a factor in the afore mentioned occupational cases, as well as for cases seen in the humid climates of India and the West Indies (e.g., Barbados)5 [25, 26, 30].
4
Prior to the middle of the 19th century, apoplexy was used to describe conditions where an individual fell unconscious for no apparent reason [28]. Over the centuries it has also been associated with stroke and convulsions [28, 29].
5
In the early 20th century, the burden of heat-related disease started to be quantified including trends over time and geographical and demographic variations. Shattuck and Hilferty noted that in the United States Registration Area6, the “Heat and Sunstroke” death rate for 1901, a particularly warm year with a hot summer, was 12.8 per 100,000 population [33]. Comparatively, the 29 year (1900-1928) average “Heat and Sunstroke” death rate was 1.9 per 100,000 population. Shattuck and Hilferty also conducted a detailed analysis of Massachusetts and observed that during years with heat waves, urban districts had a higher mortality rate than rural districts [34]. In 1938, Grover presented an analysis of excess mortality associated with elevated temperatures in 86 U.S. cities from 1925-1937 [35]. She noted the magnitude of effect varied by latitude with the greatest effect seen in the northeast. Grover also noted in her 1938 analysis that the majority of excess deaths due to heat were not coded as heat-related deaths on the death certificate. Considering her findings, Grover suggested that all-cause mortality would be a better measure than heat-related deaths [35]. In his discussion of the 1966 heat wave in the U.S., Schuman noted that “…poverty, crowding, poor housing, and age are critical factors” in heat-related mortality [36]. He also commented that planning and preparation by city officials, urban planners, and medical personnel for heat events could reduce heat-related mortality.
During the first half of the 20th century both the British and U.S. military worked extensively to prevent adverse heat-related outcomes and to understand the susceptibility factors. For instance, by 1917 in Mesopotamia the British provided heat stroke stations which were supplied daily with ice. Where possible, troops did not work between 10am and 2pm and were provided education on how to mitigate the effects of heat. During their time in Mesopotamia, risks factors for heat exhaustion and heat stroke, such as increasing age and concurrent infections, were identified. A 1927 study of U.S. Navy casualties from 1861-1926 observed that acclimatization was a prevention factor for casualties due to heat [31]. During World War II, the U.S. Army observed that the majority of heat casualties
this study, the general belief till the latter half of the 19th century was that the sun’s rays alone cause heat illness [25].
6
were occurring during training, as such, guidelines for work-rest cycles based on wet bulb temperature were established [25]. These guidelines were based on military studies of the meteorological conditions at the time of a heat-related death [25, 37].
In the latter quarter of the 20th century, a clear association between high temperatures and heat-related morbidity and mortality became apparent. However, as was underscored by Klinenberg’s social autopsy of the 1995 Chicago heat wave, behavioral responses (individual and population level), community cohesion, and socio-economic factors are just as (or possibly more) important as the meteorological factors in understanding the heat-health relationship [7]. Note that within this paper the heat-health relationship refers to the relationship between heat and heat-related morbidity or morality. When individuals are not able to employ adaption strategies (e.g., change their behavior) they are more likely to succumb to heat-exposure regardless of the temperature. For instance, a low income senior without an air-conditioned home who feels safe leaving their home, frequenting businesses, and visiting neighbors will have a lower risk of a HRI than a similar senior who does not feel comfortable leaving their home. During the Chicago heat wave, seniors who left their home had access to individuals who could provide help if needed and access to cooling by way of commercial centers, all of which reduced their risk of heat illness [7]. Explicit assessments of many of the non-meteorological factors are not always practical. Still, a solid foundation for policy interventions and future work should be made by thoroughly characterizing the relationship between HRI,
environmental heat, and, where explicitly possible, non-metrological factors [2, 14, 38-40].
PHYSIOLOGY
Through physiological and behavioral modifications, the human body is able to maintain temperature equilibrium of 37°C ± 0.5 [41, 42]. Heat produced internally, through metabolic
The maintenance of temperature in the human body can be conceptualized in two parts, the core and the shell (Figure 2-1). The core maintains a temperature of 36.6-36.8°C7 (97.9-98.2°F) and roughly includes the brain, parts of the skeletal muscles, and vital organs [44-46]. The core can tolerate very little variation in temperature and over the course of the day varies by only 0.6°C (1.1°F) [47]. On the other hand, the shell, which is comprised of the outer tissues of the body (e.g., skin) varies as external environmental conditions change as well as with the thermoregulatory state of the body (i.e., core temperature lower or higher than normal) [45]. The mean temperature of the shell is approximately 33.7-34°C (92.7-93.2°F) [45]. The physical distinction between the two parts is not exact and varies dependent on the external temperature. In a warm or hot
environment the shell may comprise 10-20 percent of the human body mass while in cold conditions the shell may comprise 30-40 percent of the human body mass [41]. The temperature gradient between the core and the shell is important in passive thermoregulation and will be discussed later.
M
ECHANISMS OFH
EATD
ISSIPATIONInternally, heat is produced as a by-product of cellular metabolism and the mechanical work of the skeletal muscles [48]. These processes are highly inefficient. Only 27 percent of the energy obtained from food is used by the body’s functional systems, the rest becomes heat and must be removed from the body [47]. Heat is removed from the human body through any of the following heat
7
This temperature value is the oesophageal temperature and is an approximate value of core. The value of the core temperature depends on where the measurement is obtained (e.g., oral, tympanic, rectal, or oesophageal). For instance rectal temperature is usually about 0.6°C higher than oral temperature [43].
transfer mechanisms: radiation, conduction, convection, and evaporation [47, 48]. Radiation is the transfer of heat through infrared heat rays (wavelengths of 5-20 micrometers). All objects not at absolute zero temperatures radiate heat. When the external temperature is less than the body temperature then the body will radiate a greater amount of heat than it absorbs. Conduction is the transfer of heat from one object to another through kinetic energy. Molecules in the warmer object vibrate and move more than molecules in the cooler object. As the faster moving molecules collide with the slower moving molecules, energy is transferred. In this manner heat is transferred down a temperature gradient. The human body, especially the tissue and fat, is a poor conductor, limiting the amount of heat transferred from the core tissue to the shell through conduction. Convection is the transfer of heat though liquids or gas. The transfer of heat from the core to the shell through the blood is a very effective mechanism of heat transfer. Evaporation occurs when water is converted from liquid to gas. For homeotherms (i.e., organisms with a constant body temperature), water is continually lost through diffusion of water molecules to the skin and respiratory surfaces, leading to insensible evaporation [45, 47]. For humans, insensible water loss occurs at a rate of 450-600 mL/day of water [47]. Heat loss through insensible evaporation is not part of the mechanisms of heat dissipation, however, evaporation of sweat is.
When the skin temperature of the human body is greater than the external temperature, the resulting temperature gradient allows for heat transfer into the external environment through
conduction, convection, and radiation. For instance, a nude individual sitting in a room at normal temperature will lose approximately 60 percent of total heat loss though radiation, 3 percent through conduction to an object (i.e., the chair), 15 percent through convection to the air, and 22 percent of total heat loss to evaporation [47]. When the external temperature is greater than the skin
B
ODYT
EMPERATURER
EGULATIONRegulation of body temperature is controlled though the temperature-regulating centers in the preoptic area of the anterior hypothalamus. In addition to the brain, there are internal receptors located mainly in the spinal cord, the abdominal vicera, and in/around the great veins of the upper abdomen and thorax and peripheral receptors located in the skin [44, 47]. As the core body
temperature increases beyond a set point the heat sensitive neurons in the hypothalamus begin firing invoking heat loss mechanisms [41, 47, 50]. When the peripheral receptors sense an increase in the external temperature, heat loss mechanisms are invoked before the core temperature increases [41, 47, 50]. Additionally, the peripheral receptors allow for a localized heat loss response [51]. The main responses are reduction of the basal metabolic rate, peripheral venous vasodilation of the blood vessels, and sweating [47]. With vasodilation, heat is transferred in the blood through convection from the core to the periphery.
During peripheral venous vasodilation the rate of blood flow can increase from 250 mL/minute to 6-8 L/minute [48]. The increase in blood flow results in increased cardiac output. To compensate for the increase in blood flow to the skin there is a corresponding reduction of blood flow to the renal and splanchnic bed [41, 52]. Additionally, sweating secretion results in loss of water and sodium which leads to decreased blood volume further taxing the cardiovascular system. During exercise or work, the body is also prioritizing blood flow to the muscles to support metabolism [41, 52].
A
CCLIMATIZATIONAcclimatization is the combined physiological changes that occur in the body to more efficiently maintain the thermo-equilibrium in a hot environment while at the same time decreasing strain on the body’s systems. The following physiological changes occur with acclimatization: increased cardiac performance, expanded plasma volume, sodium-conservation in the sweat glands and the kidneys, increased ability of the sweat glands to secrete sweat, increased efficiency in the shunting of blood away from non-critical circulatory systems (e.g., splanchnic bed), increased filtration rate of the kidney, and increased resistance to exertional rhabdomyolysis [41, 48, 52]. Finally, with acclimatization the thermoregulatory set point is lowered allowing the initiation of vasodilation and sweating to occur at a lower temperature [41, 48]. This process of complete acclimatization takes approximately 2–3 weeks but starts occurring within days of exposure to heat [41, 49].
B
IOLOGICALF
ACTORSA
FFECTINGT
HERMOREGULATIONThere are clinical and biological factors that may limit the body’s ability to thermoregulate properly. Individuals with chronic medical conditions may be less able to cope with the biological strain of the heat loss mechanisms especially those with circulatory or renal problems. As individuals age there is a decreased circulatory response to heat, impairing heat loss through convection [53]. Also the peripheral sensors become less sensitive meaning that individuals are not able to react as well physiologically or behaviorally to the warming external environment [53]. On the reverse side, children are at a special disadvantage when regulating their body temperature [41, 54, 55]. They have a higher metabolic rate, lower blood volume, and a lower cardiac rate than adults. This means that children produce more internal heat than adults and may have a harder time dispersing that heat though peripheral blood flow. Further, the sweat glands in children produce sweat at a lower rate per gland than adults resulting in less sweat. The reduction in sweat is compensated by a larger surface area-to-mass ratio which allows for greater heat dispersion through radiation as opposed to
As previously mentioned, peripheral warmth sensors are located in the skin. Damage to the skin (e.g., sunburn or burns) can prevent these sensors from detecting increases in external
temperature. Skin damage may also occlude the sweat glands preventing sweat from being delivered to the skin surface. Sweat glands can also be destroyed when skin is injured and will not regenerate when scar tissue is present [53]. Individuals with spinal injuries have varying degrees of
thermoregulation impairment dependent on the level and location of injury. In these individuals the peripheral warm sensors are not able to transmit information to the brain, delaying activation of heat loss mechanisms [41]. Additionally, below the lesion, the body may not have the ability to dilate the peripheral blood vessels and the sweating response is severely compromised [41].
Finally, medication usage can modify an individual’s ability to tolerate heat [56, 57]. Certain medications can increase internal production of heat by increasing the metabolic rate (e.g.,
stimulants) or by producing muscle hyperactivity (e.g., typical antipsychotics). Medications may disrupt the signaling mechanisms for sweat activation by blocking neurotransmitters required for sweat activation (e.g., anticholinergic medications such as tricyclic antidepressants and
antihistamines) [56-58]. Cardiovascular medications that lower blood pressure (e.g.,
antihypertensives) and medications that increase removal of water from the body (e.g., diuretics) may also inhibit the body’s heat response [58].
DISEASE: HEAT-RELATED ILLNESS
P
ATHOPHYSIOLOGYreduction of tissue oxygenation leading to hypoxia which in turn causes the generation of highly reactive oxygen and nitrogen species that damage tissue. During the initial failure of the
thermoregulatory system there is an immune response which protects the cells from heat damage. However, as the core continues to heat, this response overwhelms the body leading to inflammation associated injury including injury to the brain and neurons. Elevated temperatures also result in vessel damage resulting in activation of the coagulation pathway which may cause small clots in the blood vessels disrupting blood flow to the organs. If left untreated, the above physiological changes will result in renal failure, coagulopathy, hepatic dysfunction, and finally multi-organ failure [41, 48, 52].
D
IAGNOSISAs the thermoregulatory system fails, the resulting medical problems associated with failure are classified by medical practitioners as a continuum of disorders under the heading of heat-related illness (HRI) [48, 49, 59]. Timely medical intervention can prevent mild cases of HRI from becoming severe, potentially preventing death. A summary of the disorders associated with heat-related illness are listed below including the characteristics and pathophysiology.
Heat Edema (ICD-9-CM 992.7): The mildest form of HRI is heat edema which is
characterized by swelling in the hands and feet due to accumulation of interstitial fluid. It is caused by the pooling of blood in the skin and lower extremities during peripheral venous vasodilation and venous stasis (i.e., slow blood flow). Heat edema usually occurs in individuals who are not
acclimatized to the heat and individuals who have been sitting for long periods of time, particularly the elderly.
Heat cramps (ICD-9-CM 992.2): Heat cramps are characterized by painful muscle spasms in the arms, legs or abdomen. Heat cramps usually occur after vigorous exertion (e.g., work or
around the cells). The decrease in water in the interstitial fluid causes deformation of the matrix around the cells leading to mechanical deformation causing the skeletal muscle cells to contract resulting in muscle cramps. Acclimatization reduces the risk of heat cramps by decreasing the amount of electrolytes (e.g., sodium or potassium) lost in sweat.
Heat Syncope (ICD-9-CM 992.1): Reduced blood flow to the central nervous system due to increased blood flow to the periphery as well as reduced central venous return results in heat syncope [55]. The reduction in central venous return is caused by depletion of extracellular fluid volume, peripheral vasodilation, and poor vasomotor tone [55]. Vasomotor tone is required for modulation of vasodilation and vasoconstriction of blood vessels [55]. Heat syncope usually occurs in the elderly or non-acclimatized individuals. It is characterized by fainting or dizziness.
Heat Exhaustion (ICD-9-CM 992.3 and 992.4) and Heat Stroke (ICD-9-CM 992.0): Heat stroke, a medical emergency, is the most severe form of heat-related illness. Heat exhaustion is often
considered a warning of impending heat stroke and untreated heat exhaustion will result in heat stroke [55]. There is a great deal of variation in the symptoms between mild heat exhaustion and heat stroke. The medical recommendation is that if there are any doubts regarding the diagnosis, it is prudent to treat the patient for heat stroke [48]. A comparison of the symptoms of heat exhaustion and heat stroke can be found in Table 2-1. Heat exhaustion is due to volume depletion from sweating and occurs in individuals working/exercising in hot conditions. It can be generally classified as either heat exhaustion due to water depletion or heat exhaustion due to salt depletion [48, 55]. Heat exhaustion due to water depletion occurs with inadequate fluid intake. Heat exhaustion due to salt Table 2-1. Comparison of symptoms related to Heat Exhaustion and
Heat Stroke* [48, 55, 59]
Heat Exhaustion Heat Stroke
Seizures/coma
Irritability Delirium/hallucinations
Fatigue/weakness Respiratory alkalosis
Light-headedness Cerebellar dysfunction (e.g., Ataxia)
Sweating Maybe sweating, but hot skin
Headache Headache
Nausea/vomiting Nausea/vomiting
Orthostatic hypotension Hypotension
Tachycardia Tachycardia
Increased thirst (dehydration) Diarrhea
Muscle cramps Muscle spasm
depletion is similar, however, water replenishment occurs but with inadequate sodium intake [48, 55]. The latter condition takes longer to develop.
The main difference between heat stroke and heat exhaustion is that with heat stroke there is a core body temperature of 40°C (104°F) or higher and it includes dysfunction of the central nervous system. In the aforementioned forms of heat illness, the thermoregulatory mechanisms continued to function however, with heat stroke these mechanisms no longer function. Heat stroke can be divided into two categories; classical and exertional. Classical heat stroke occurs in hot environments and usually affects those whose thermoregulatory system is compromised due to medication usage, injury, chronic illness, underdevelopment (i.e., children) or individuals who are not able to employ behavioral modifications such as the very young or very old [48, 55, 59]. Exertional heat stroke occurs in young healthy individuals under conditions of strenuous activity, usually in hot humid weather [48, 59]. In exertional heat stroke, the body’s endogenous heat production overwhelms the thermoregulatory system. Profuse sweating is common in exertional heat stroke whereas in classical heat stroke patients show signs of anhidrosis (inability to sweat) [48, 55]. As heat stroke progresses it is common to see moderate hyperurcemia in classical heat stroke and severe hyperurcemia in exertional heat stroke [56, 60]. Acute renal failure, lactic acidosis, hypokalemia, disseminated intravascular coagulation, and rhabdomyolysis are all common in exertional heat stroke but not classical heat stroke [48, 52, 55, 59]. In the most severe cases of heat stroke, multi-organ dysfunction syndrome occurs [52].
OTHER POTENTIAL HEAT-OUTCOMES
In practice, the continuum of disorders known as HRI is difficult to diagnose and the diagnostic definition varies by geographic location and medical facility [2, 13, 61]. Additionally,
Recording of the signs and symptoms of HRI without a corresponding HRI diagnosis leads to an underestimation of HRI in the administrative records [13]. Further, as heat exposure may not be critical to the treatment needs of the patient, heat exposure may not be acknowledged at all in the record. Some systematic bias in diagnosis of HRI may also exist. For example, if a doctor or medical examiner is aware of high ambient temperatures they may be more likely to code the illness or death as heat-related leading to differential information bias [2, 65]. In order to avoid the potential biases incurred when only HRI-specific codes in the medical/death records are considered, researchers will often use other physiologically plausible endpoints when examining the heat-health relationship.
As the thermoregulatory system fails it affects multiple organs and systems throughout the body. As such, all cause morbidity and mortality is a common endpoint used to capture all potential cases of HRI when analyzing the heat–morbidity/mortality relationship [1, 2, 66]. Often this endpoint is adjusted and excludes injuries/poisonings and external causes of injuries8 as these causes of
morbidity and mortality are not direct biological symptoms of the failure of the thermoregulatory process but may occur as body systems start to fail (e.g., neurological impairment such as dizziness may cause a worker to fall from scaffolding) [1, 18]. A limitation of all-cause morbidity and mortality for analyses is the potentially low specificity of this outcome in identifying HRI. As such, cause-specific endpoints are also used. Many studies have used very broad groupings when studying HRI, such as, total diseases of the circulatory system or total respiratory disease [1, 66-68]. However, these broad groupings contain many different subtypes of diseases (e.g., broad group = cardiovascular disease; sub-groups = ischemic heart disease, hypertension, cardiac dysrhythmia, and heart failure) which may have different causal associations with heat exposure [66]. As such, researchers have also examined subtypes of diseases in association with heat [1, 66].
The observed magnitude of the heat-health relationship for each cause-specific endpoint (e.g., cardiovascular or renal outcome) is different dependent on the data source (i.e., mortality versus morbidity data) [69, 70]. The reasons for the differences in magnitude are unclear but may be
8
due to the rapid onset of the diseases such as cardiovascular event where the individual die before reaching the hospital and therefore would not be counted in the morbidity data [69, 71, 72].
Additionally, the majority of cause-specific morbidity studies only use the primary diagnosis code when using administrative data while mortality studies may only use the underlying cause of death. This may result in an underestimation of the cause-specific endpoint and a small (or no) heat-health association [66, 73, 74]. For instance, an excess in cardiovascular9 mortality has been observed during heat-waves [2] but not as consistently for cardiovascular morbidity [66]. However, during the 1995 Chicago heat wave, Semenza et al. observed an excess of 89 primary diagnosed
cardiovascular hospitalizations (p = 0.2) and an excess of 461 cardiovascular hospitalizations (p = 0.02) when all diagnosis codes were used [75]. For the remainder of this document heat-related outcomes will be defined as all HRI outcomes and any heat-related endpoints associated with thermoregulatory system failure.
Endpoints that have been shown to have an association with outdoor heat in multiple studies are summarized below.
DISEASES OF THE CIRCULATORY SYSTEM9
In order to regulate body temperature, excess heat is removed through increased blood flow to the skin. Individuals with pre-existing conditions may not be able to meet the requirements placed on the circulatory system for maintaining thermo-equilibrium (e.g., increased cardiac output). Even healthy individuals may succumb to the stress of thermoregulation placed on the circulatory system. For instance in healthy individuals, haemoconcentration (an increase in the concentration of red blood cells), caused by salt and water loss in sweat, can lead to coronary and cerebral thrombosis [76]. Prior work has demonstrated that mortality related to the circulatory system increases with increasing ambient heat [1, 2, 77]. This relationship is not as clear with circulatory morbidity [66] where the
9
majority of the literature has observed a non-statistically significant increase [69, 70, 78-81], although a few studies have observed a decrease in admissions with increasing temperature [71, 79, 82]10.
When examining the cause-specific endpoints within the circulatory system, there does appear to be a positive relationship between ambient heat and ischemic heart disease for both morbidity [75, 78, 81-83] and mortality [67, 83-86]. For example, for every 1°C increase in maximum temperature, a 1.7 percent (95% CI = 1.2, 2.2) increase in mortality for ischemic heart disease was seen during the summer months in England and Wales (1993–2006) [85]. For morbidity, between 1991 and 2004 in New York City a 2.54 percent (95% CI = 1, 411) increase in ischemic heart disease hospitalizations was observed for every 1°C increase in mean apparent temperature [81]. A California study of all ED visits for the summer months of 2005–2008 observed a 1.7 percent (95% CI = 0.2 to 3.3) increase in ischemic heart disease for every 5.5°C (10°F) increase in mean apparent
temperature [78].
For myocardial infarction the magnitude of the positive association is weaker but still generally present for both morbidity [75, 78, 80, 82, 87-89] and mortality [67, 85, 90, 91]. During the summer months in England and Wales (1993–2006), Gasparrini et al. observed a 1.1 percent (95% CI = 0.7, 1.5) increase in myocardial infarction mortality for every 1°C increase in maximum
temperature [85]. The California study of all ED visits for the summer months of 2005–2008 observed a 1.7 percent (95% CI = −0.5 to 4.0) increase in myocardial infractions risk for every 5.5°C (10°F) increase in mean apparent temperature [78]. Studies have also shown increased hospital admissions related to cardiac dysrhythmia [75, 78, 81, 89]. However, the results have been inconsistent when examining the relationship between ambient heat and heart failure [75, 78, 81, 82, 84, 88, 89] or hypertension [75, 78, 81, 88]. Positive associations have been seen for outdoor heat and death due to heart failure [84, 85] and hypertension [84].
10
For a summary of the results for the referenced studies please see within this document sub-section titled Epidemiology of HRI in the General Population within the Epidemiology section.
11
Cerebrovascular endpoints have been examined in relation to ambient heat and a negative relationship has been seen for morbidity [69, 81-83, 87], while a potentially positive relationship is seen for mortality [83-85]. However, when examining the more specific cerebrovascular sub-types, a strong negative association has been observed with hemorrhagic stroke morbidity [78, 82] and a modest increase has been observed for ischemic stroke morbidity [70, 75, 78, 82]. One study examined ambient heat in relation to ischemic stroke mortality but found no association [92].
D
ISEASES OF THER
ESPIRATORYS
YSTEMNumerous studies have been conducted which indicate that respiratory morbidity [66, 70, 86] and mortality [1, 2, 84] increase with increasing ambient heat10. The mechanisms for this association are unclear. It may be due to poor air quality that is often associated with increased outdoor
temperatures and exacerbation of pre-existing conditions due to the stress of the thermoregulatory process [93]. Additionally, respiratory alkalosis and adult respiratory distress are both symptoms of HRI [52, 94]. An increase in pneumonia morbidity [75, 78, 82, 88] and mortality [84, 90] has been observed. The literature suggests a decrease in asthma morbidity [75, 78, 82] and an increase in asthma mortality [85] with increasing heat exposure. There is also the suggestion of an increase in chronic bronchitis and emphysema morbidity [75, 78, 81, 82] and mortality [84, 85, 90] with increasing ambient heat.
O
THERD
ISEASESDehydration is a common symptom of HRI as the body loses water and electrolytes through sweat. This symptom has also been used as an endpoint for heat-related morbidity and shows a strong positive association with increasing ambient heat [75, 78, 82, 87].
Both type I and type II diabetes are chronic conditions which impair an individual’s ability to properly thermoregulate [93, 97]. The ability of the blood vessels in the skin to dilate may be impaired in individuals with diabetes [93, 97]. Further, with type II diabetes, vasodilation occurs at a higher temperature than individuals without diabetes [51]. Additionally, individuals with type II diabetes have decreased sweating response [93]. When used as an endpoint, diabetes mortality [67, 84, 85] and morbidity [70, 75, 78, 82, 87] increase with increasing ambient heat.
It is important to note that while a number of cause-specific endpoints have demonstrated biological plausibility in relation to failure of the thermoregulatory system and appear to be associated with increasing heat [38, 62, 98] there is no information in the literature on the sensitivity and
specificity of these endpoints for identifying outcomes associated with failure of the thermoregulatory system in administrative datasets. It is unclear which outcome, all-cause, cause-specific, or
diagnosed HRI provides the least biased approximation of HRI (i.e., failure of the thermoregulatory system). Further research in this area is required.
ENVIRONMENTAL PARAMETERS
P
ARAMETERSA
FFECTINGR
ESPONSE TOH
EATindividual. The other four factors are environmental: ambient air temperature, wind velocity, mean radiant temperature, and humidity.
• Ambient air temperature is the temperature of the air surrounding the body. It is usually measured in Celsius or Fahrenheit.
• Air velocity describes the speed of air moving across an individual. Moving air increases heat loss; heat is dissipated from the body through the air, the now warm air is replaced with cool air, and the process starts over.
• Mean radiant temperature is the average of the combined heat emitted from all heat sources in the environment. All objects in an environment radiate some heat with heat sources (e.g., sun, fire, ovens, dryers, lights, etc.) radiating a greater proportion of the heat.
• Humidity is the amount of water vapor in the air. It is often measured as absolute humidity, relative humidity, or dew point. Absolute humidity is the actual amount of water in the air (conveyed as grams of water vapor per cubic meter volume of air) while relative humidity is the amount of water in the air relative to the amount of water that the air can hold at the current air temperature (conveyed as a percentage). The lower the temperature the less water vapor the air can hold. Dew point is the temperature to which the air must be cooled to reach 100 percent relative humidity and is measured in Celsius, Fahrenheit, or Kelvin. The higher the dew point the greater the amount of water vapor.
P
ROXIES FORH
EATE
XPOSUREThe perception of what constitutes a hot thermal environment, and in turn the resulting behavioral response varies from person to person but we can approximate the exposure a person receives using the six basic parameters mentioned above (i.e., clothing insulation, metabolic health production, ambient air temperature, wind velocity, mean radiant temperature, and humidity). Ideally, the best proxy will incorporate all six of the basic parameters; however, realistically this is not possible in large populations. There are a number of different measurements and metrics which have been used as proxies when characterizing the heat-health relationship. These proxies have also been used to alert populations to dangerous heat situations in order to prevent heat-related morbidity and mortality.
The wet bulb globe temperature12 (WBGT) incorporates all four of the environmental
parameters into the measurement. Predetermined WBGT limits have been used in small populations (e.g., a work-site or sporting event) to effectively induce behavioral response which prevent heat-related morbidity and mortality [44, 96]. Heat exposure limits for work and rest schedules have also been determined based on the WBGT in combination with calculations which incorporate the other two basic parameters13 [100, 101]. Exertional heat-related morbidity/mortality has been prevented (and reduced) by use of this combined method [44, 100]. While the WBGT measurement system is effective in eliciting behavioral responses to prevent HRI in real time application for local
environments, it is labor intensive, requires precise setup/monitoring and is not applicable for monitoring large geographical areas. Additionally, the incorporation of the individual parameters with WBGT requires complicated calculations. Previously created tables specific to work-sites/situations
12
The wet bulb globe temperature (WBGT) is a measurement of heat that incorporates air temperature, humidity, air velocity, and solar radiation. The WBGT requires three separate thermometers to obtain the reading; a black globe thermometer (solar radiation), a wet-globe thermometer (humidity), and a dry bulb thermometer (air temperature).
13
allow for real time application in local work environments; however, the use of these tables is not practical when working with large populations where information about the work situation and amount/type of clothing for the individuals is not available.
The spatial synoptic classification (SSC) system is an exposure metric which combines measurements of all four of the environmental parameters. It is sometimes used when examining the heat-health relationship in populations [102-105] and is often used in the development of city-specific heat health warning systems (HHWS) [106-108]. The system classifies weather conditions and patterns for each day into six main types and two subtypes: dry polar (associated with lowest temperatures in a region with clear dry conditions), dry moderate (mild and dry air), dry tropical (hottest and driest conditions at any location), moist polar (typically cloudy, humid, and cool), moist moderate (warmer and more humid than moist polar), moist tropical (warm and very humid) , moist tropical plus (the hottest and most humid days within the moist tropical classification) and transitional (occurs when one weather type yields to another) [109]. To calculate daily SSC for use in
characterizing the heat-health relationship the following measurements obtained four times daily are required: temperature, dew point, wind direction, cloud cover, and sea-level pressure [109]. After the heat-health relationship has been described, forecasting data is used to calculate SSC for the HHWS [106]. The SSC has not been used very frequently in the heat-health literature and results using this metric as an exposure will not be comparable to the majority of prior work. Further, a comparison of the predictive capacity of the heat exposure metric used in HHWS across the globe found that
synoptic classification was not more effective at predicting days with the highest excess mortality than other methods and the effectiveness (compared to the other methods) varied by locale [110].
One of the most consistently collected and widely available parameter is dry bulb
they were allowed to sleep at night in air-conditioned rooms [94]. Minimum temperature may capture the impact of night time cooling [112, 113]. Some studies have also included the difference between average temperature and minimum temperature to try and capture minimal night time cooling [115, 116]. Brief periods of intense heat will also increase the likelihood of HRI which would be captured by using maximum temperature. It is very rare that studies have information regarding the time of day that the exposure or event occurred and average temperature may provide a more reliable exposure measure than the other two measures, especially since it includes multiple readings during the day, potentially reducing measurement error.
Dew point or relative humidity is often used as a separate variable in conjunction with air temperature when modeling the relationship between heat and heat-related morbidity and mortality [1, 2, 113]. This is because the temperature feels warmer to an individual as the water content of the air increases and the ability to cool by evaporation decreases [50]. As previously mentioned, how an individual perceives their environment may determine their behavioral modifications, in turn, providing a more accurate assessment of the relationship between heat and heat-related morbidity and
mortality. The literature has used a number of different indexes in environmental research which incorporate both humidity and air temperature; three examples are the humidex, the heat index, and apparent temperature14 [120]. These indexes provide a general idea of how hot it feels and are used widely in the literature when describing the heat-health relationship. Additionally, the heat index (U.S. NWS) and the humidex (Environment Canada) are used, both actual and forecasted values, when communicating summer weather information to the public including heat warnings and advisories. Each of the three metrics uses air temperature but humidity is incorporated differently; heat index uses relative humidity, humidex is calculated using dew point (which is used to calculate vapor pressure), and the apparent temperature uses dew point [118, 119, 121]. The heat index assumes a
14
wind speed of 5 knots (~6 miles/hour) while apparent temperature assumes a wind speed of zero [98, 118, 119]. Both heat index and apparent temperature assume that the measurements were taken in the shade [119]. For instance, exposure to direct sun light can increase the heat index by up to 15°F. The humidex only incorporates temperature and humidity, without any further assumptions [121]. The equation for calculating the heat index was based on R.G. Steadman’s 1979 work relating dry bulb temperature (at various humidity levels) and the skin's resistance to heat and moisture transfer while accounting for a number of biometeorological parameters [118]. As a result, a limitation of the heat index is that it produces results that deviate from Steadman’s original tables when the air temperature is <26.67°C (80°F) or the relative humidity is <40 percent [122, 123]. The U.S. NWS has created (and uses) an algorithm to account for the limitations of the heat index calculation [120, 124].
In practice, because of its availability, temperature (e.g., minimum, maximum, or average) or a measure that combines both temperature and humidity (e.g., heat index, humidex, apparent temperature) is often used as a proxy for heat exposure. It is unclear which measure best represents heat exposure in population studies [112, 113, 123]. When examining the heat-mortality relationship among 107 U.S. cities (1987-2000), Barent et al. concluded that the best measure of ambient outdoor heat15 varied by location and region under study [113]. In the north-east, maximum temperature fit the heat-health model best while in the south-east and north-west the best exposure measure/metric was the humidex. However, the authors mention that there was temporal, within city variability in relation to which exposure measure/metric provided the best fit [113]. Hajat et al. also noted, in a study that looked at data from three European cites, that the effectiveness of apparent temperature as a predictor of mortality depended on the location with apparent temperature being a good predictor for Budapest but not in London or Milan [112]. They also found that mean temperature was a better predictor of the heat-mortality relationship than minimum or maximum temperature [112]. A study in
15