CHEMICAL CHARACTERIZATION AND REACTIVE OXIDANT POTENTIAL OF INDONESIAN BIOMASS BURNING EMISSIONS
Michael Matthew Williams
A thesis submitted to the faculty at the University of North Carolina at Chapel Hill in partial fulfillment of the requirements for the degree of Master of Science in the Department of Environmental Sciences and Engineering in the Gillings School of Global Public Health.
Chapel Hill 2017
© 2017
ABSTRACT
Michael Matthew Williams: Chemical Characterization and Reactive Oxidant Potential of Indonesian Biomass Burning Emissions
(Under the direction of Jason D. Surratt)
Atmosphericfine particulate matter (PM2.5) has adverse impacts on air quality, climate,
and human health. Primary emissions from biomass burning (BB) in Indonesia can substantially contribute to PM2.5 concentrations; however, its chemical composition remains unresolved. In
this study, we examined the chemical composition of PM2.5 primarily emitted from laboratory
burns of Indonesian biomass fuels and ambient PM2.5 collected from Singapore when it was
influenced by air masses originating from Indonesian peatland fires. We also applied the dithiothreitol (DTT) assay to assess if these samples have oxidative stress potential. We found that laboratory samples generated greater DTT activity compared to previous studies examining diesel particles. Ambient samples generated smaller DTT activity, suggesting that fresh BB-derived PM2.5 likely has greater oxidative stress potential than aged BB-derived PM2.5.
ACKNOWLEDGMENTS
First and foremost, I want to thank my wife, Shelley Williams, for her incredible support and dedication to our family while I have been working on this research.
This work would not be possible without the guidance and mentorship of Dr. Jason Surratt. While serving as my advisor, his constant support has been greatly appreciated and I thank him for giving me the opportunity to conduct this work.
TABLE OF CONTENTS
LIST OF TABLES ... vii
LIST OF FIGURES ... viii
CHAPTER 1: INTRODUCTION ... 1
CHAPTER 2: MATERIALS AND METHODS ... 5
Section 2.1. Laboratory Burn Experiments ... 5
Section 2.2. Ambient Field Sampling ... .6
Section 2.3. Filter Extraction Procedures ... 8
Section 2.4. Chemical Characterization of BB Aerosol by Gas Chromatography ... Interfaced to Electron Ionization-Mass Spectrometry ... 9
Section 2.5. Complementary Chemical Data ... .10
Section 2.6. Dithiothreitol (DTT) Analysis ... ..12
CHAPTER 3: CALCULATION APPROACHES ... 14
Section 3.1. Levoglucosan Quantification Methods ... 14
Section 3.2. DTT Assay Calculations ... 15
Section 3.3. Quality Control Methods ... 17
Section 4.1. Chemical Characterization and Tracer Results from ...
Laboratory Burns and Field Samples ... 19
Section 4.2. DTT Assay Results ... 26
Section 4.3. Comparison of Chemical Tracers with DTT Activity ... 28
CHAPTER 5: CONCLUSIONS ... 29
APPENDIX A: FIELD AND LABORATORY BLANK ANALYSIS ... 30
APPENDIX B: ORIGINPRO ANALYSIS ... 31
APPENDIX C: LOCATION OF GC/EI-MS AND DTT ASSAY RAW DATA ... 32
APPENDIX D: BROWN CARBON SUPPLEMENTAL DATA ... 34
LIST OF TABLES
Table
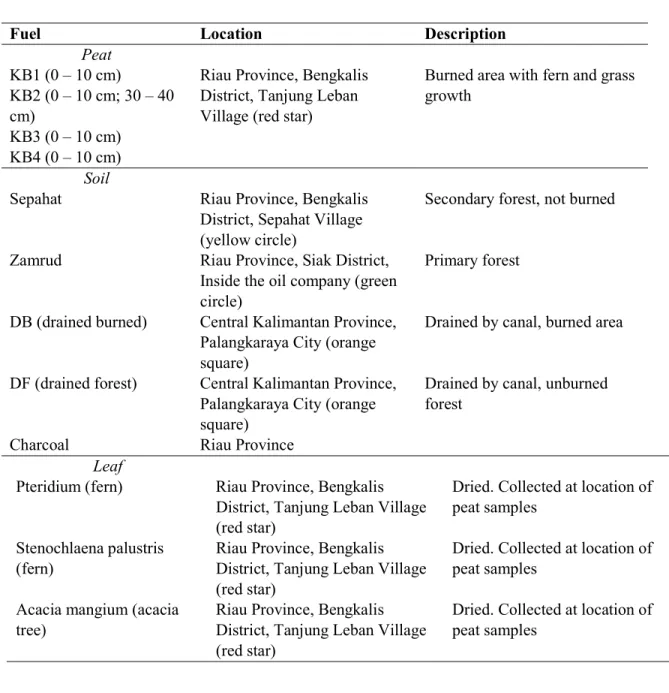
1. Types of Fuel Used in Laboratory Burns ... 8
LIST OF FIGURES
Figure
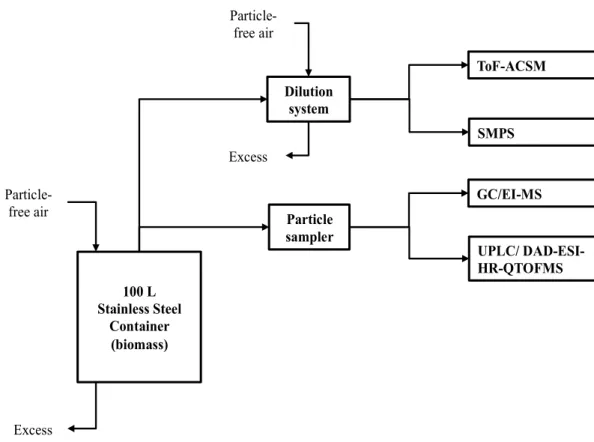
1. Schematic for biomass burning laboratory experiments ... 7
2. GC/EI-MS calibration curve ... 14
3. Calibration curve of the 1,4-NQ standard analyzed by the DTT assay ... 17
4. GC/EI-MS TIC measured from PM2.5 collected ... from laboratory burning of Acacia Mangium ... 20
5. Aerosol mass concentrations of levoglucosan ... measured from the laboratory burns ... 21
6. GC/EI-MS TIC of a PM2.5 sample collected during the ... daytime from Singapore on October 18th, 2015 ... 22
7. Levoglucosan concentrations from October 16-27, 2015... 23
8. Levoglucosan concentrations measured during 23 h-integrated sampling times ... 24
9. Ambient organic aerosol mass compared to levoglucosan concentrations ... 25
10.DTT activity for primary PM2.5 samples collected from the laboratory burns ... 27
11.NIOG values for primary PM2.5 samples collected from the laboratory burns ... 27
CHAPTER 1: INTRODUCTION
Airbornefine particulate matter (PM2.5, aerosols with aerodynamic diameters ≤ 2.5 m)
is of growing concern to governments worldwide due to its adverse impacts on local air quality, climate, and human health (Hallquist et al., 2009; Pope and Dockery, 2006). PM2.5 can be
directly emitted (known as primary aerosol) from anthropogenic activities (e.g., combustion) or natural processes (e.g., volcanic eruptions or wave breaking over oceans). PM2.5 can also be
indirectly formed through atmospheric chemical oxidation processes; this is known as secondary aerosol. PM2.5 is of concern due to the small particle size and its abilities to travel deep into the
respiratory system of humans (Xing et al., 2016). The World Health Organization has published warnings and recommendations for concentrations of PM2.5 (WHO 2005) and epidemiological
studies continue to stress the relevance of exposure to PM and the resulting adverse health effects associated with this exposure (Bell, 2012; Wilhelm et al., 2012). Although understanding the sources and fates of all PM2.5 types in the atmosphere is important, anthropogenic sources,
such as those through biomass burning activities, are of most concern as the global population continues to grow dramatically, increasing demands on land use for agriculture and urban development. This concern is extremely important to us because of our ability to control these changes by way of regulation and changes in activity levels.
world continue to clear land through burning techniques, resulting in 20 to 60 million hectares of land being burned (Crutzen and Andreae, 1990). As climate change continues, warmer and drier conditions are forecasted for many locations (Karl et al., 2009). Primary emissions from BB contributes a large amount of PM2.5 into the atmosphere (Crutzen and Andreae, 1990; Bond et
al., 2004, 2013). The impacts of BB on local and global climate scales are vast. Trace gases and aerosol emitted by BB increases the global tropospheric ozone burden and decreases global mean OH (Mao et al. 2013). Emissions from fires can also increase warming throughout the globe, and some models have shown that these effects are even greater over the Arctic, decreasing sea ice depth to even further change global weather and climate (Jacobson 2014). Particles emitted by BB also affect the scattering and absorption of solar radiation in the atmosphere (Hobbs et al. 1997).
The numerous chemical compounds emitted during BB events are not well resolved or characterized (Akagi et al., 2011), leading to uncertainties in how primarily emitted particulate and gaseous compounds adversely affect human health and participate in the formation of secondary organic aerosol (SOA). Since BB is the second largest source of non-methane organic compounds emitted into the atmosphere (Bond et al., 2004; Andreae and Merlet, 2001; Forster et al., 2007; Guenther et al., 2006) these compounds have the potential to influence atmospheric chemistry, radiative forcing, and health. For example, they could form low-volatility organic compounds that can nucleate, condense onto pre-existing aerosol, or undergo multiphase
chemical reactions to yield SOA. To exhibit the complexity of BB emissions, Hatch et al. (2015) used two-dimensional gas chromatography – time of flight mass spectrometry to analyze
compounds. Various fuel types were also analyzed by Stockwell et al. (2015) and they found widely varying amounts of compounds in different fuel types. The complexity of BB emissions raises many questions about the short- and long-term effects on the global climate and human health.
Many studies have examined the link between ambient particulate matter and negative health impacts (Tao et al., 2003, Li et al. 2003a/b, 2008, Bernstein et al., 2004, Lighty et al., 2011). Some of these same studies have observed positive associations between adverse health and oxidative potential, suggesting a causal relationship (Li et al., 2003a/b, 2008). Due to this possible linkage, studies have set forth goals to determine the oxidative potential of particles, especially ambient particles using the DTT assay (Cho et al., 2005, Li et al., 2009, Verma et al., 2014, 2015, Rattanavaraha et al., 2011, Kramer et al., 2016). The DTT assay is a common method used to attempt to quantify the redox activity of PM2.5 samples. It also measures the
potential of those samples to generate reactive oxygen species (ROS) (Li et al., 2009). The DTT assay has been used to provide a measure of the redox activity of particles by determining superoxide radical formation (Cho et al., 2005). Additionally, it has been suggested that the consumption rate of DTT by PM samples is related to the particles’ ability to induce stress protein formation in cells (Li et al., 2003a).
In this study, we will systematically examine the chemical composition of primary PM2.5
derived from laboratory burns of various Indonesian fuel types. We will also examine the chemical composition of PM2.5 collected from ambient air in Singapore during haze events that
burns and the ambient PM2.5 from Singapore influenced by Indonesian peatland fires have
CHAPTER 2: MATERIALS AND METHODS
2.1. Laboratory Burn Experiments. Biomass burning experiments were conducted at the Earth Observatory of Singapore, at the Nanyang Technological University in Singapore. Thirteen types of biomass were burned in a laboratory combustion chamber experiment. The types of biomass fuel included peats, ferns, leaves, and charcoal from burned peatland in
Indonesia. The biomass was burned in a 100 L stainless steel container at room temperature and atmospheric pressure. Additional details regarding the combustion chamber experiments have been recently described by Budisulistiorini et al. (2017) and are also shown in Figure 1. The fuel was not pre-dried and was burned at 350 ºC using a thermocouple and proportional–integral– derivative (PID) controller for 50-60 min in order to replicate Indonesian peatland fires (Usup et al., 2004, Tropics). The fuel was not weighed before combustion was started. Once burning initiated, the fuel would glow for a period of 1-2 minutes and then smolder for the remainder of the experiment. Particle-free mixing air was added to ensure proper mixing of the smoke from both the glowing and smoldering phases of the burn inside the chamber. The air inside the chamber was then collected 1-2 minutes after combustion was complete. Particle-free air was continuously added to the combustion chamber to main atmospheric pressure during particle sampling. The burns conducted were mostly oxygen starved due to the lack of flames at the time sampling began.
mm in diameter, 0.2-μm pore size, FluoroporeTM) in order to minimize the uptake of gases. The
sampling flow rate was 0.5 L min-1 for 30–35 min. The filters were wrapped in pre-baked
aluminum foil and stored under dark conditions at -20 ºC until analysis. These filters were shipped under frozen and dark conditions to UNC for chemical analyses. The stainless-steel container was wiped clean with Milli-Q water and 2-propanol (industrial grade, Katno Chemical Co., Inc.) at least three times with each solvent after completion of each experiment in order to ensure particles were removed from the inner combustion chamber walls. Due to this cleaning method, there were likely some particles that were not removed in between each burning experiment, and this is a possible limitation in this study.
2.2. Ambient Field Sampling. During the course of a haze episode in Singapore that occurred from October 14-30, 2015, and was heavily influenced by air masses that originated from major peatland fires in Indonesia (see Fig. S1 from Budisulistiorini et al., 2017), ambient aerosol samples were collected through a PM2.5 cyclone interfaced to a low-volume particle filter
sampler. The PM2.5 low-volume filter sampler was operated at 4.2 L min-1. The filter sampling
was conducted at two different times using local PM2.5 concentrations measured by the National
Environment Agency (NEA) in Singapore; one during 23 hours of low ambient PM2.5
concentrations (≤ 50 g m-3) and one during ~ 12 h periods (daytime and nighttime sampling was
08:00-19:45 and 20:00-07:45, respectively, local time) at times of higher ambient PM2.5
concentrations (> 50 g m-3). The ambient PM
2.5 samples were collected onto pre-baked 47 mm
These ambient PM2.5 filter samples were also shipped under frozen and dark conditions to UNC
for further chemical analysis.
Figure 1. Schematic for BB laboratory experiments.
100 L Stainless Steel
Container (biomass)
Particle-free air
Excess
SMPS Dilution
system
ToF-ACSM
Particle-free air
Excess
Particle sampler
Table 1. Types of fuel used in laboratory BB experiments.
Fuel Location Description
Peat
KB1 (0 – 10 cm)
KB2 (0 – 10 cm; 30 – 40 cm)
KB3 (0 – 10 cm) KB4 (0 – 10 cm)
Riau Province, Bengkalis District, Tanjung Leban Village (red star)
Burned area with fern and grass growth
Soil
Sepahat Riau Province, Bengkalis
District, Sepahat Village (yellow circle)
Secondary forest, not burned
Zamrud Riau Province, Siak District, Inside the oil company (green circle)
Primary forest
DB (drained burned) Central Kalimantan Province, Palangkaraya City (orange square)
Drained by canal, burned area
DF (drained forest) Central Kalimantan Province, Palangkaraya City (orange square)
Drained by canal, unburned forest
Charcoal Riau Province
Leaf
Pteridium (fern) Riau Province, Bengkalis District, Tanjung Leban Village (red star)
Dried. Collected at location of peat samples
Stenochlaena palustris (fern)
Riau Province, Bengkalis District, Tanjung Leban Village (red star)
Dried. Collected at location of peat samples
Acacia mangium (acacia tree)
Riau Province, Bengkalis District, Tanjung Leban Village (red star)
Dried. Collected at location of peat samples
2.3. Filter Extraction Procedures. Laboratory experiments produced high amounts of organic aerosol mass on filters (5-90 mg m-3) (Budisulistiorini et al., 2017); therefore, laboratory
prevent evaporation. Sealed scintillation vials were sonicated for 45 min. Steps were taken to ensure the samples would not become overheated; specifically, after 25 min of sonication, water inside the sonicator was drained and replaced with fresh, cool water. Sample vials were then sonicated for an additional 20 min. This process was applied to filters obtained from both laboratory burns and Singapore air. After sonication was complete, the methanol containing extracted filter material was transferred to clean 20 mL scintillation vials. The laboratory samples contained insoluble particles, therefore, these extracts were filtered through PTFE syringe filters (Pall Life Science, Acrodisc®, 0.2-μm pore size) in order to remove these free-floating particles. However, syringe filtering was not applied when laboratory filter samples were extracted for analysis by the dithiothreitol (DTT) assay, which is described in more detail in subsequent sections. Due to the presence of quartz fibers, ambient filter extracts were also filtered through PTFE syringe filters to remove any quartz filter fiber residues. After syringe filtering all sample extracts, methanol extracts were blown dry under a gentle N2 (g) stream at
room temperature. For sample extracts analyzed by the DTT assay, they were only dried to 1 mL rather than being completely dried.
2.4. Chemical Characterization of BB Aerosol by Gas Chromatography Interfaced to Electron Ionization-Quadrupole Mass Spectrometry (GC/EI-MS). Dried filter extracts were immediately trimethylsilylated by addition of 100 μL of
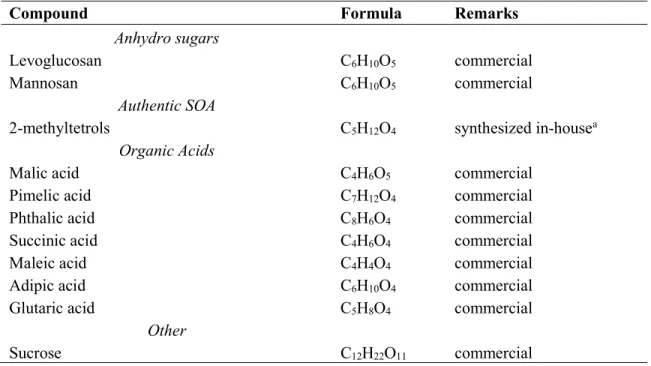
operating conditions and temperature program are described elsewhere (Surratt et al., 2010; Lin et al., 2012). Resultant GC/EI-MS total ion chromatograms (TICs) were analyzed in detail for known BB-derived organic molecular tracers. GC/EI-MS TICs of known pure standards, such as levoglucosan which is a well-known BB molecular tracer (Simoneit et al. 1999), were compared to the sample TICs. Table 2 shows all pure compounds used to calibrate and quantify known BB organic tracers characterized in PM2.5 samples collectedfrom the laboratory burns and from
Singapore.
Table 2. Standard compounds used for calibration and quantification by GC/EI-MS.
Compound Formula Remarks
Anhydro sugars
Levoglucosan C6H10O5 commercial
Mannosan C6H10O5 commercial
Authentic SOA
2-methyltetrols C5H12O4 synthesized in-housea
Organic Acids
Malic acid C4H6O5 commercial
Pimelic acid C7H12O4 commercial
Phthalic acid C8H6O4 commercial
Succinic acid C4H6O4 commercial
Maleic acid C4H4O4 commercial
Adipic acid C6H10O4 commercial
Glutaric acid C5H8O4 commercial
Other
Sucrose C12H22O11 commercial
aDetails of organic synthesis can be found in Budisulistiorini et al. (2015).
2.5. Complementary Chemical Data. The time-of-flight aerosol chemical speciation monitor (ToF-ACSM) was used to quantitatively measure the real-time compositions of non-refractory PM1 (NR-PM1) during each of the burning experiments (Fröhlich et al., 2013). In
overlapped with the ambient PM2.5 filter sampling described above. The NR-PM1 components
measured included organic, sulfate, nitrate, ammonium, and chloride. Details of the operating conditions, calibration procedures, and quantification methods were fully described in our recently published work (Budisulistiorini et al., 2017). ToF-ACSM measurements were used to help determine actual organic aerosol (OA) mass loadings on filters. This calculation was done by using the concentration of OA mass in μg m-3 multiplied by the sample volume (m3) for each
individual sample.
In addition to ToF-ACSM measurements, PM2.5 samples collected from laboratory burns
and from Singapore were also analyzed by ultra-performance liquid chromatography interfaced to a diode array detector and a high-resolution quadrupole time-of-flight mass spectrometer equipped with electrospray ionization (UPLC/DAD-ESI-HR-TOFMS) operated in the negative ion mode. Detailed operating procedures for the UPLC/DAD-ESI-HR-TOFMS are described elsewhere (Budisulistiorini et al., 2017; Zhang et al. 2011). The UPLC/DAD-ESI-HR-TOFMS was used to chemically characterize brown carbon (BrC) aerosol constituents, which included nitro-aromatics, oxygenated-conjugated compounds, and sulfur-containing organics, in the PM2.5
samples collected from both the laboratory burns and from Singapore, as recently described by Budisulistiorini et al. (2017). This data is found in Appendix D. For UPLC/DAD-ESI-HR-TOFMS quantification, the following authentic standards were used: 2-nitrophenol (Sigma-Aldrich, 98%), 4-nitro-o-cresol (TCI America, > 98%0, 4-nitro-1-naphthol (TCI America, >98%), sinapic acid (Sigma-Aldrich, >98%), sodium octyl sulfate (Sigma-Aldrich, > 95%), and 2-methyltetrol sulfates synthesized in-house using previously published procedures
in order to determine if DTT activity (or oxidative stress potential) was associated with these important aerosol components that have climatic effects (Laskin et al., 2015).
2.6. Dithiothreitol (DTT) Analysis. The DTT assay was used to determine the potential redox activity of an aerosol sample (Li et al., 2009; Rattanavarha et al., 2011; Verma et al., 2012; Verma et al., 2015; Kramer et al., 2016). The DTT assay was monitored using a U-3300 Hitachi spectrophotometer. The DTT standard (powder form, Sigma-Aldrich) was added to a buffer, as described below, to prepare a fresh 5 mM DDT stock solution daily. After all samples were dried down to 1 mL of methanol filter extract, they were sealed and placed into a -20 ºC freezer to prevent loss due to evaporation. It is noted here that filters were extracted in methanol for the DTT assay since prior work has reported methanol is more effective in extracting redox-active organic components from PM samples than in water (Rattanavaraha et et al., 2011; Verma et al., 2012; McWhinney et al., 2013; Yang et al., 2014). The assay was conducted by first calibrating the system with DTT and 0.01 mg ml-1 1,4-naphthoquinone (1,4-NQ, Sigma-Aldrich). A buffer
solution containing 99 mL of 0.05 mol L-1 potassium dihydrogen phosphate (KH
2PO4, pH 7.4,
NQ was used as an external standard to determine the reactivity of DTT. For all standards, buffer solutions were varied to ensure that final volume of 1350 L was made, including for DTNB, 1,4-NQ, and DTT. Filter sample vials were created by using 1000 μL of buffer solution, 200 μL of the sample, and 50 μL of DTT. These were also placed in a 37 ºC dry bath for 30 min. After the reaction time was reached, 100 μL of DTNB was placed in each vial. All standards and samples were analyzed within 1 h. Two solvent blanks, one of the buffer solutions only, and another blank of the buffer solutions containing methanol only, were also analyzed. In sample analysis, it was determined that BrC constituents in the samples were contributing an
interference in the measurements of DTT activity. This was corrected for by measuring the absorbance at 412 nm of the sample only in the solutions of buffer and DTNB (without any DTT added). This absorbance was then compared to the baseline of the buffer alone, and then
CHAPTER 3: CALCULATION APPROACHES
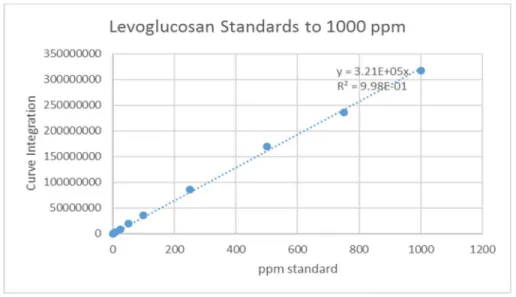
3.1. Levoglucosan quantification methods. Levoglucosan was quantified in all samples using multiple data sets. Calibration factors for levoglucosan were determined by creating a standard calibration curve using commercially-available levoglucosan (99% pure,
Sigma-Aldrich). Varying solutions of levoglucosan were created and analyzed via GC/EI-MS. Extracted ion chromatograms (EICs) at m/z 204, which is a major fragment ion for levoglucosan, were integrated for each calibrant solution, laboratory burn sample, and ambient samples collected from Singapore.
Figure 2. GC/EI-MS calibration curve demonstrating a linear-dynamic range up to 1000 ppmv for levoglucosan quantification.
Solvent density was assumed to be 1 g mL-1. The sampling volume was calculated using the
sampling time and the flowrate of the air being sampled onto the filters. Extraction efficiency (EEfrac) was calculated by using lab blank filters spiked with levoglucosan and empty vials spiked
with the same concentration of levoglucosan, then calculating a fraction of levoglucosan obtained from the filters when applying the full extraction process. For the purposes of this experiment, the EEfrac was determined to be 98% for levoglucosan. The filter fraction (Filt. Frac.) is the fraction of
the original filter size used during the extraction process. In these experiment, one half of the laboratory filter samples were extracted, whereas one quarter of the field filter samples were extracted. This decision was made due to the availability of filter material and estimated mass from ToF-ACSM measurements, allowing for repeat procedures if needed.
3.2. DTT Assay calculations. Oxidative stress potentials were calculated and expressed as DTT activity (nmol of DTT consumed/min/g sample) and as the normalized index of oxidant generation (NIOG) for comparison with previously published studies. DTT consumed is
calculated using the slope and intercept of the DTT calibration curve and the absorbance of the =
10
( ) =1 ℎ 0.15
=
10 (0.15 )
10
= 0.15
sample. DTT activity is then calculated using the DTT consumed over 30 min of reaction time per microgram of sample analyzed. Furthermore, Li et al. (2009) calculates and describes the use of NIOG as the percentage of absorption decrease min-1 g-1 of sample, normalized by the index
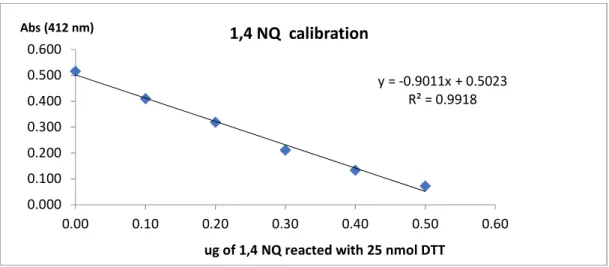
of oxidation generation (IOG) for the 1,4-NQ standard. This was calculated using the following equation:
Abs0 is the absorbance detected in the UV Spectrophotometer at 412 nm for a standard
only containing 50 μL of DTT; this is both the 50 μL DTT standard and the 0 μL 1,4-NQ standard, and as a result, the absorbance should be similar. Abs’ is the absorbance detected at 412 nm of the sample being measured. T is the reaction time with DTT. During this experiment, the samples would react with DTT for 30 min. M is the mass of aerosol used for this assay and was estimated using the OA mass concentration measured by the ToF-ACSM multiplied by the filter sampling volume. This mass was then divided by the fraction size of the filter extracted. M varied for each filter sample during the DTT assay experiments, especially since some filters had much greater mass than others. The IOG of 1,4-NQ was determined from the standard calibration curve of 1,4- NQ, using a value that matched the slope of the curve.
Figure 3. Calibration curve of the 1,4-NQ standard analyzed by the DTT assay.
3.3. Quality Control Methods. Blank filters were also collected for laboratory burn experiments and during the ambient sampling period. Air was not pulled through these blank filters; however, all blank filters were prepared, handled and analyzed in the same manner as the experimental samples. Blank filter analysis results using GC/EI-MS are shown in Appendix A, Figures A1-A2. All blank filters analyzed showed no abundance of levoglucosan with mass to charge (m/z) of 204 in the EIC. The detection limit of levoglucosan found in this analysis was 0.1 ppmv. Continuous analysis of standards of levoglucosan was conducted throughout the
timeframe of analysis for all filter samples to ensure similar calibration factors were used in all calculations. Levoglucosan calibration coefficient response factors were found to be 3.21 x 10⁻⁵
± 1.14 x 10⁻⁵. Solvent blanks were utilized to flush the GC column in between samples to prevent
remnants of previous samples appearing on each experiment. Error bars in graphs were estimated based on multiple experiments conducted with levoglucosan standards during the analysis. Standards from 0.5 ppm to 1000 ppm were run each time before analysis, and standard deviations were derived from these standards.
Additionally, blank filter analysis was conducted using the DTT assay. The blank filters
y = -0.9011x + 0.5023 R² = 0.9918
0.000 0.100 0.200 0.300 0.400 0.500 0.600
0.00 0.10 0.20 0.30 0.40 0.50 0.60
Abs (412 nm)
ug of 1,4 NQ reacted with 25 nmol DTT
CHAPTER 4: RESULTS AND DISCUSSION
4.1. Chemical Characterization and Tracer Results from Laboratory Burns and Field Samples. The laboratory burns of Indonesian biomass fuels yielded very complex total ion chromatograms (TICs). Figure 4 shows a TIC for the broadleaf sample (acacia mangium). This TIC has a similar level of complexity as compared to previous two-dimensional (2-D)-GC/ToF-MS results obtained by Hatch et al. (2015). TICs obtained from PM2.5 collected from all
laboratory burns had similar complexity. The most abundant compound found using this extraction method in all burns was levoglucosan, explaining 2-75 % of the total OA mass measured by the ToF-ACSM. Utilizing more traditional extraction methods may produce different results, as different compounds may be extracted from the filter materials. Filters extracted using dicholoromethane or hexane may provide greater insight into polar compounds released in primary emissions (Simoneit et al., 1999). Previous studies (Schauer et al., 2001) have found levoglucosan fractions as high as 46% in pine wood burned during fireplace combustions. The different fuel types analyzed by this method contribute a greater fraction of levoglucosan. Due to its high abundance in PM2.5 obtained from laboratory burning of
Figure 4. GC/EI-MS TIC measured from PM2.5 collected from laboratory burning of Acacia
Mangium. Levoglucosan is labeled as L at 37.45 min retention time. The * indicate peaks that are filter artifacts and are not a part of the analysis.
The quantity of levoglucosan measured from each sample varied greatly between different fuel types. The KB1 (peat with fern and grass) and the Narrowleaf (Stenochlaena palustris or fern) had the least amount of levoglucosan (0.51 and 4.37 mg m-3, respectively, or 2
and 14 %, respectively, of total OA mass measured by the ToF-ACSM), while the Broadleaf (Acacia Mangium) had the highest fraction (12.63 mg m-3 or 75 % of total OA mass measured by
the ToF-ACSM). Figure 5 shows the exact aerosol mass concentrations of levoglucosan
Figure 5. Aerosol mass concentrations of levoglucosan measured from the laboratory burns of the various types of Indonesian biomass fuels examined in this study. Blanks were found to have no levoglucosan present and were not subtracted for this analysis.
Levoglucosan was also quantified in the ambient PM2.5 filters samples. Levoglucosan was
the most abundant compound during most sampling days in Singapore, supporting that BB had a direct impact on air quality in this region. Figure 6 shows a GC/EI-MS TIC measured from the daytime sample taken on October 18th, 2015. Levoglucosan is the most abundant compound
(1.81 g m-3 or 3 % of the total OA mass measured by the ToF-ACSM) found in this sample.
The group of chromatographic peaks on this TIC starting around 52 min are derived from filter artifacts. Blank filter TICs can be seen in the appendix section (Appendix A).
0 5 10 15 20 25 30
Co
nc
en
tr
at
io
n
(m
g/
m
3)
Fuel Type
Figure 6. GC/EI-MS TIC of a PM2.5 sample collected during the daytime from Singapore on
October 18th, 2015. Chromatographic peaks are labelled as follows: levoglucosan (L, R.T. =
37.44 min), maleic Acid (Me, 21.1 min), succinic Acid (Su, 22.01 min), malic Acid (Ma, 27.8 min). (*) indicate species measured on blank filters that are not due to ambient aerosol
constituents.
Other major chromatographic peaks in the TICs of ambient field samples are associated with maleic, succinic, and malic acids. These compounds are known to be derived from aromatic oxidations (Kleindienst et al., 2004), and thus, likely are derived from local urban emissions in Singapore or formed from atmospheric chemical aging of aromatics emitted from BB. The summed abundances of these compounds were low or a low fraction of OA mass (~ 0.01 – 1.80
g m-3, or 0 – 0.5 % of the total OA mass measured by the ToF-ACSM) throughout the sampling
period in Singapore. Figure 7 shows the daytime versus nighttime trends of levoglucosan
concentration in PM2.5 collected from Singapore. The ambient haze was sampled for 11 h during
the day and night; 1 h was needed to clean and prepare the sampler for the next sampling period. The three most abundant levoglucosan concentrations were measured on October 18 (1.81 g m -3), 23 (1.83 g m-3), and 26 (2.76 g m-3). Comparing these levels to ambient data taken from
al. (2008) studied ambient levoglucosan concentrations in PM2.5 in Beijing and found much
lower concentrations compared to this study (0.108 g m-3 to 0.806 g m-3). Another study
conducted on a small island in the North Pacific by Mochida et al. (2010) found ambient levoglucosan concentrations that were still quite low compared to this study (0.45 ng m-3 to 15
ng m-3).
Figure 7. Levoglucosan concentrations measured during the day (11 h-integrated sample) and the night (11 h-integrated sample) from October 16-27, 2015. Blanks were found to have no levoglucosan present and were not subtracted for this analysis.
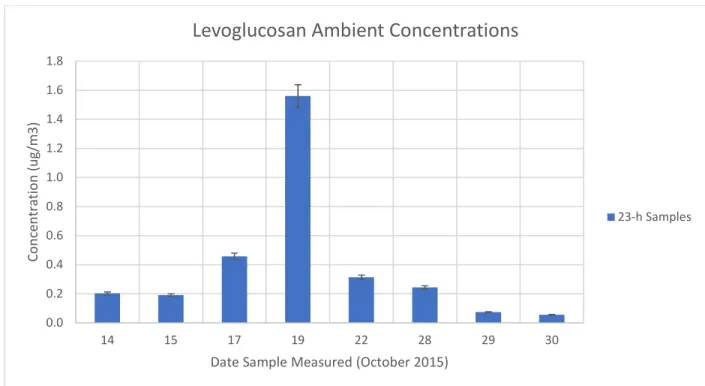
Additional samples were measured during 23 h-integrated sampling periods in between the day and night rotations. The levoglucosan aerosol mass concentrations from these samples are shown in Figure 8. Levoglucosan concentration peaked on October 19, 2015. In all ambient samples, levoglucosan concentrations were much lower than the primary emissions from the laboratory burn samples. Hennigan et al. (2010) studied the stability of levoglucosan in the
0.0 0.5 1.0 1.5 2.0 2.5 3.0 3.5 4.0 4.5
16 18 20 21 23 24 25 26 27
Co nc en tr at io n (u g/ m 3)
Date Sample Measured (October 2015)
Levoglucosan Ambient Concentrations
atmosphere, specifically when exposed to hydroxyl radicals. This study observed decay in levoglucosan in particles exposed to OH. The decay ranged from 20% to 90%, and they
determined an atmospheric lifetime of 0.7 to 2.2 days when exposed to 1.0 x 10⁶ molecules cm-3
of OH, which was typical during the summertime when they conducted this analysis. This atmospheric aging process of levoglucosan could partly explain smaller concentrations of levoglucosan typically measured downwind of BB events.
Figure 8. Levoglucosan concentrations measured during 23 h-integrated sampling times. Blanks were found to have no levoglucosan present and were not subtracted for this analysis.
Additionally, levoglucosan concentrations shown in Figure 8 were compared with 23-h integrated OA mass measured by the ToF-ACSM at the same sampling site. The ambient OA mass measured by ToF-ACSM was compared to the levoglucosan measurements from the samples analyzed by GC/EI-MS in Figure 9. Ambient haze pollution events in the area are likely
0.0 0.2 0.4 0.6 0.8 1.0 1.2 1.4 1.6 1.8
14 15 17 19 22 28 29 30
Co nc en tr at io n (u g/ m 3)
Date Sample Measured (October 2015)
Levoglucosan Ambient Concentrations
influenced by BB emissions arriving from peatland fires in nearby Indonesia since levogluosan and OA mass concentrations are well correlated (r2 ~ 0.71).
Figure 9. ToF-ACSM measurements of ambient organic aerosol mass during the sampling timeframe compared to levoglucosan concentrations measured by GC/EI-MS.
In addition to the GC/EI-MS results discussed above, we identified 41 individual BrC compounds, such as oxygenated-conjugated compounds, nitro-aromatics, and S-containing compounds, in laboratory-generated PM2.5 that can potentially absorb at near-UV and visible
wavelengths by using UPLC/DAD-ESI-HR-QTOFMS. The sum of BrC constituents in peat, fern/leaf, and charcoal burning aerosols are 16%, 35%, and 28% of the OA mass, respectively, giving an average OA mass contribution of 24%. Combining the mass of the BrC constituents with the levoglucosan concentrations in the laboratory burns in this study, this accounts for 12 – 100% of the OA mass, with an average of 54%. On average, the BrC constituents account for 0.4% of the ambient OA mass; however, large uncertainties in mass closure remain due to the lack of authentic standards. Details of these measurements have been recently summarized by
y = 23.508x + 24.592 R² = 0.706
0.00 20.00 40.00 60.00 80.00 100.00
0.00 0.50 1.00 1.50 2.00 2.50 3.00
O A M as s Co nc en tr at io ns (u g/ m 3)
Levoglucosan Concentrations (ug/m3)
Levoglucosan vs. OA Concentrations
Budisulistiorini et al. (2017). Although this recent study highlights the potential of
light-absorbing BrC OA constituents from peat, fern/leaf, and charcoal burning, and their importance in the atmosphere, we use this data here to examine their potential association with DTT activity (or oxidative stress potential) measured from PM2.5 filter samples collected from laboratory burns
and from Singapore.
4.2. DTT Assay Results. NIOG values were calculated for all laboratory and ambient field samples. PM2.5 samples collected from the laboratory burns showed considerable amounts
of DTT activity (3.74 x 10⁻³ nmol DTT/min/g sample to 1.94 x 10⁻² nmol DTT/min/g sample)
as seen in Figure 10, and, thus, NIOG values (4.48 x 10⁻³ to 2.36 x 10⁻²) as seen in Figure 11.
Rattanavaraha et al. (2011) used a similar method to determine NIOG values for fresh and aged diesel exhaust particles. Comparing our NIOG values to this previous study reveals that NIOG values of the primary PM2.5 collected from laboratory burns of Indonesian fuels are higher than
those measured for fresh and aged diesel exhaust primary particles. NIOG values obtained from PM2.5 collected from the laboratory burns are shown in Figure 10 and are compared with those
values previously reported by Rattanavaraha et al. (2011) and from isoprene SOA (Kramer et al., 2016). Isoprene-derived SOA had NIOG values (1.79 x 10⁻³ to 3.13 x 10⁻³) smaller than those
reported here for the laboratory burns of Indonesian biomass. Fresh and aged diesel particles as described in Rattanavaraha et al. (2011) had NIOG values that were smaller as well (1.0 x 10⁻³ to
4.0 x 10⁻³). This suggests that the chemical compositional differences may explain this trend and
pmol/min/gOC) in their analysis were comparable or slightly higher to the results found in this
study (4.47 to 19.43 pmol/min/g sampled).
Figure 10. DTT activity (nmol/min/g sampled) values for primary PM2.5 samples collected
from the laboratory burns of various Indonesian biomass fuel types.
Figure 11. NIOG values for primary PM2.5 samples collected from the laboratory burns of
Figure 12. NIOG values for ambient PM2.5 samples collected from the haze events affecting
Singapore from Indonesian peatland fires.
Figure 12 shows the NIOG values for the ambient samples. These values are lower (from 2.06 x 10⁻⁵ to 2.40 x 10⁻³) than previous studies conducted on ambient PM data (Verma et al.
2015). Additionally, during DTT analysis of the ambient field samples, no difference was noted between days of high levoglucosan concentration and days with low concentrations.
Levoglucosan concentration did not appear to have a relationship to DTT activity or NIOG.
4.3. Comparison of Chemical Tracers with DTT Activity. There was no significant relationship found between the levels of DTT activity in any sample and the levoglucosan concentration found in those samples. This is expected as levoglucosan is not very reactive with DTT and is quite stable (with a lifetime on the order of days) in the atmosphere (Verma et al., 2009). Additionally, DTT activity was compared with BrC constituents from Budisulistiorini et al. (2017) and no significant relationship was found.
CHAPTER 5: CONCLUSIONS
GC/EI-MS is a proven method for analyzing chemical composition of primary BB emissions (Lauraguais et al. 2014, Poster et al. 2006). The single most abundant compound found in the primary PM2.5 collected for the laboratory burns was levoglucosan using this filter
extraction method, which has been described in previous studies as a fresh BB tracer (Simoneit et al., 1999). Alternative methods of extraction may produce other results when examining the abundance of compounds in these emissions. In ambient PM2.5 samples collected during periods
in Singapore that were affected by air masses arriving from peatland fires in nearby Indonesia, levoglucosan was also the most abundant compound detected. As a result, measurement of this primary BB tracer in ambient haze in Singapore indicated the influence of BB events.
APPENDIX A
FIELD AND LABORATORY BLANK ANALYSIS
Figure A-1. Total Ion Chromatogram (TIC) of field blanks taken using the ambient air sampling equipment. Asterisks (*) represent filter artifacts.
APPENDIX B
ORIGINPRO ANOVA AND LSD ANALYSIS
APPENDIX C
LOCATION OF GC/EI-MS AND DTT ASSAY RAW DATA
Files are stored on multiple devices in the Surratt Lab for future work and analysis. The GC/EI-MS computer that operates the system has one copy of all data for that specific analysis. On the DESKTOP, the folder titled “MW” contains all experiments run during this timeframe. The second set of data is backed up on the IBM computer in the back left of the Surratt lab at UNC. The figures below show how to access the files:
Figure C-2. Location of all GC/EI-MS data. Arranged in dates and PowerPoint slides.
APPENDIX D
BROWN CARBON SUPPLEMENTAL DATA
Figure D-1. BrC Constituents at 365 nm 7.5 to 9.5 min retention time.
Figure D-2. BrC Constituents at 365 nm with 11.5 to 12.0 min retention time. ug/m3
EXP# C10H9O4- C9H5O3- C8H7O3- C6H11O4S- C10H7O4- C9H7O3- C9H9O4- C11H11O5-
C6H5O3-1 756.43336 220.4C6H5O3-155559 C6H5O3-1474.327924 0 118.0622672 316.8939321 370.2997448 14.93068109 4.391759694
2 1524.2644 350.1704218 3981.418246 13.14555975 0 648.5031217 1155.139978 34.8447039 18.48557213
3 451.39642 210.6463585 1037.451196 0 132.653436 199.8103271 443.8317383 17.1904661 0
4 1617.6608 320.7458916 3399.510492 4.993814212 255.3228898 651.0404229 1599.343792 55.7254641 16.36583313 5 1870.9723 452.1435635 4906.969802 11.51118114 1577.763551 734.4331791 1768.420092 48.65662157 28.15621421 6 654.3306 171.6360074 3236.015883 3.785490983 142.0270265 815.1491503 545.3983607 4.724124423 48.27495438
7 272.29396 118.2812006 1771.341345 0 0 438.3613502 1069.756718 4.513641197 37.200495
8 541.43699 1124.186306 2718.532706 0 0 791.4360456 1108.213853 3.514072687 48.4214781
9 632.25119 117.7138657 1373.453169 0 0 252.4076389 435.1092746 21.86583058 15.14278643
10 661.42391 121.8631878 1461.287757 0 0 259.1776375 331.0899458 20.80060845 26.99350133
11 536.76037 145.9734901 1296.675562 0 0 203.5926179 330.5800987 17.97035482 10.48484521
12 1142.7101 167.7771144 2584.843595 0 0 291.4502881 746.3260097 48.21990774 17.58468577
13 1367.8347 188.467758 3581.985864 0 0 489.7917262 814.1195196 61.35043828 23.40797974
365 nm RT 7.5 - 9.5 min
C13H15O4- C13H13O6S- C12H13O7S- C18H19O5S- C23H21O7- C15H7O5- C6H4NO3- C7H6NO3- C6H4NO4- C7H6NO4- Sum_365nm_ug/m3
0 0 0 0 38.80271557 0 0 0 0 0 3.31E+03
116.375883 18.8468665 7.815820464 4.568919678 0 32.19780714 0 0.02622837 0 0 7.91E+03 38.732738 11.30364506 3.584077524 0 0 114.3538011 0 0.003093176 0 0 2.66E+03
0 0 0 14.18663276 0 0 0 0 0.164845802 0 7.94E+03
0 15.64981874 0 0 0 0 0 0 0 0 1.14E+04
0 0 0 0 0 0 0 0 0.207584088 0.012793907 5.62E+03
0 0 0 0 0 0 0 0 0.137709523 0 3.71E+03
0 0 0 0 0 0 0 0 0.508766305 0 6.34E+03
0 0 0 0 0 0 0.037821212 0 0 0 2.85E+03
0 0 0.530034046 0 0 0 0.037084469 0 0 0 2.88E+03
0 0 0 2.57718602 0 0 0.032344302 0 0 0 2.54E+03
0 0 0 0 0 0 0.099295854 0 0 0 5.00E+03
0 0 0 0 0 0 0.043228992 0 0.145642686 0 6.53E+03
Figure D-3. BrC Constituents at 400 nm with 5.0 to 7.5 min retention time.
Figure D-4. BrC Constituents at 500 nm with 10.0 to 11.0 min retention time.
C5H7O4- C7H7O3- C14H17O2S- Sum_400nm_ug/m3
0 0 0.00
0 0 0.00
0 0 0.00
0 0 0.00
381.0980753 0 381.10
388.865715 1.778535718 390.64
538.0153295 0 538.02
808.5482143 0 808.55
74.88355924 0 74.88
73.8192248 0 73.82
73.11534359 0 73.12
166.043522 0 166.04
229.2876904 0 229.29
400 nm RT 5.0 - 7.5 min
C9H11O2- C11H9O3- C10H9O3- C8H9O3S- C12H17O4S- C12H17O5S- C17H17O5- C10H11O3- C12H9O2- Sum_500nm_ug/m3
0 0 0 0 0 0 0 46.49240409 128.7809863 175.27
0 0 0 2.894751012 0 5.866832869 0 83.85907235 212.8173887 305.44
0 0 0 0 0 3.1972347 0 0 63.32556185 66.52
558.4511583 0 419.3491381 3.420048192 0 0 0 90.59825504 228.3930726 1300.21
610.0868143 0 0 0 0 0 0 85.902637 0 695.99
720.8406717 172.4406624 411.1424992 6.881686441 9.89438669 8.9946716 7.420648212 122.9520959 65.9029733 1526.47 506.0440335 164.6410082 336.2047763 0 0 0 0 282.4716597 72.14532631 1361.51 1619.170968 428.701145 332.7442849 0 0 0 0 402.9671995 81.84467671 2865.43
0 0 0 0 0 0 0 45.8931967 78.97347955 124.87
0 0 0 0 0 0 0 59.73191836 70.55865438 130.29
0 120.0182182 139.6625491 0 0 0 0 36.42389163 54.33107543 350.44
0 0 0 0 0 0 0 41.1054588 84.51299351 125.62
0 0 0 0 0 6.419566136 0 102.8892315 0 109.31
Figure D-5. BrC Constituents at 580 nm with 10.0 to 12.0 min retention time, sum of all constituents is the final column.
C11H13O5S- C15H19O6S- C11H13O6S- C14H17O4- C14H13O4- C10H17O4S- C10H13O2- C16H15O4- C15H22N3O2- Sum_580nm_ug/m3BB_sumBrC_ug_m3
18.69569088 0 0 0 0 0 0 0 0 18.70 3508.53
46.49120219 39.20573128 34.70273339 35.32927408 0 26.22837011 0 0 0 181.96 8393.20
0 15.67202277 10.28826962 7.077756868 0 3.093175678 0 0 0 36.13 2763.61
0 25.38474345 18.2033524 54.43759826 0 0 164.8458016 0 0 262.87 9498.14
0 17.95966215 0 29.26801915 0 0 0 0 0 47.23 12538.99
0 0 0 0 0 0 207.5840879 12.79390679 3.656773698 224.03 7762.71
0 0 0 0 0 0 137.7095234 0 11.35376147 149.06 5760.47
0 0 0 0 0 0 508.7663046 0 0 508.77 10518.99
0 0 0 0 37.82121166 0 0 0 0 37.82 3085.55
4.443422817 0 1.24357683 0 37.08446872 0 0 0 0 42.77 3130.08
0 0 0 0 32.34430218 0 0 0 0 32.34 3000.54
0 0 0 0 99.29585376 0 0 0 0 99.30 5389.97
0 0 0 24.0355681 43.22899196 0 145.6426864 0 0 212.91 7078.65
REFERENCES
Akagi, S.K.; Yokelson, R.J.; Wiedinmyer, C.; Alvarado, M.J.; Reid, J.S.; Karl, T.; Crounse J.D.; Wennberg, P.O.; (2011). Emission Factors for open and domestic biomass burning for use in atmospheric models. Atmos. Chem. Phys., 11, 4039-4072.
Andreae, M. O.; Merlet, P., (2001). Emission of trace gases and aerosols from biomass burning. Global Biogeochem. Cycles, 15(4), 955–966.
Bell, M.L., (2012). Assessment of the Health Impacts of Particulate Matter Characteristics. Research Report 161. Health Effects Institute, Boston, MA.
Bernstein, J.A.; Alexis, N.; Barnes, C.; Bernstein, I.L.; Nel, A.; Peden, D.; Diaz-Sanchez, D.; Tarlo, S.M.; Williams, P.B.; (2004). Health effects of air pollution. American Academy of Allergy, Asthma, and Immunology, 1116-1123.
Bond, T. C.; Streets, D.G.; Yarber, K.F.; Nelson, S.M.; Woo, J.H.; Klimont, Z., (2004). A technology-based global inventory of black and organic carbon emissions from combustion, J. Geophys. Res., 109, D14203.
Bond, T. C., et al. (2013). Bounding the role of black carbon in the climate system: A scientific assessment. J. Geophys. Res. Atmos., 118, 5380–5552.
Budisulistiorini, S.H.; Li, X.; Bairai, S.T.; Renfro, J.; Liu, Y.; Liu, Y.J.; McKinney, K.A.;
Martin, S.T; McNeill, V.F.; Pye, H.O.T.; Nenes, A.; Neff, M.E.; Stone, E.A.; Mueller, S.; Knote, C.; Shaw, S.L.; Zhang, Z.; Gold, A.; Surratt, J.D., (2015). Examining the effects of anthropogenic emissions on isoprene-derived secondary organic aerosol formation during the 2013 Southern Oxidant and Aerosol Study (SOAS) at the Look Rock, Tennessee ground site. Atmos. Chem. Phys., 15, 8871-8888.
Budisulistiorini, S.H.; Riva, M.; Williams, M.; Chen, J.; Itoh, M.; Surratt, J.D.; Kuwata, M., (2017). Light-absorbing brown carbon aerosol constituents from combustion of Indonesian peat and biomass. Environ. Sci. Technol., #, pp.
Cho, A. K., Sioutas, C., Miguel, A. H., Kumagai, Y., Schmitz, D. A., Singh, M., et al. (2005). Redox activity of airborne particulate matter at different sites in the Los Angeles Basin. Environmental Research, 99(1), 40-47.
Forster, P., V. Ramaswamy, P. Artaxo, T. Berntsen, R. Betts, D.W. Fahey, J. Haywood, J. Lean, D.C. Lowe, G. Myhre, J. Nganga, R. Prinn, G. Raga, M. Schulz and R. Van Dorland, 2007: Changes in Atmospheric Constituents and in Radiative Forcing. In: Climate Change 2007: The Physical Science Basis. Contribution of Working Group I to the Fourth Assessment Report of the Intergovernmental Panel on Climate Change [Solomon, S., D. Qin, M. Manning, Z. Chen, M. Marquis, K.B. Averyt, M.Tignor and H.L. Miller (eds.)]. Cambridge University Press, Cambridge, United Kingdom and New York, NY, USA.
Fröhlich, R.; Cubison, M. J.; Slowik, J. G.; Bukowiecki, N.; Prévôt, A. S. H.; Baltensperger, U.; Schneider, J.; Kimmel, J. R.; Gonin, M.; Rohner, U.; Worsnop, D. R.; Jayne, J. T. (2013). The ToF-ACSM: a portable aerosol chemical speciation monitor with TOFMS detection. Atmos. Meas. Tech., 6, 3225-3241.
Guenther, A.; Karl, T.; Harley, P.; Wiedinmyer, C.; Palmer, P. I.; Geron, C., (2006). Estimates of global terrestrial isoprene emissions using MEGAN (Model of Emissions of Gases and Aerosols from Nature). Atmos. Chem. Phys., 6, 3181-3210.
Hallquist, M.; Wenger, J. C.; Baltensperger, U.; Rudich, Y.; Simpson, D.; Claeys, M.; Dommen, J., Donahue, N. M.; George, C.; Goldstein, A. H.; Hamilton, J. F.; Herrmann, H.;
Hoffmann, T.; Iinuma, Y.; Jang, M.; Jenkin, M. E.; Jimenez, J. L.; Kiendler-Scharr, A.; Maenhaut, W.; McFiggans, G.; Mentel, Th. F.; Monod, A.; Prévôt, A. S. H.; Seinfeld, J. H.; Surratt, J. D.; Szmigielski, R.; Wildt, J., (2009). The formation, properties and impact of secondary organic aerosol: current and emerging issues. Atmos. Chem. Phys., 9, 5155-5236.
Hatch, L.E.; Luo, W.; Pankow, J.F.; Yokelson, R.J.; Stockwell, C.E.; Barsanti, K.C. (2015). Identification and quantification of gaseous organic compounds emitted from biomass burning using two-dimensional gas chromatography-time-of-flight mass spectrometry. Atmos. Chem. Phys., 15, 1865-1899.
Hennigan, C.J.; Sullivan, A.P.; Collett Jr., J.L.; Robinson, A.L., (2010).Levoglucosan stability in biomass burning particles exposed to hydroxyl radicals. Geophys. Res. Letters, 37, 1-4. Hobbs, P.V.; Reid, J.S.; Kotchenruther, R.A.; Ferek, R.J.; Weiss, R., (1997). Direct Radiative
Forcing by Smoke from Biomass Burning. Science, 275 (5307), 1777-1778.
Hu, Q-H.; Xie, Z-Q.; Wang, X-M.; Kang, H.; Zhang, P., (2013). Levoglucosan indicates high levels of biomass burning aerosols over oceans from the Arctic to Antarctic. Sci. Rep., 3 (3119), 1-7.
Karl, T.R.; Melillo, J.M.; Peterson, T.C., (2009). Global Climate Change Impacts in the United States. Cambridge University Press.
Kleindienst T.E.; Conver, T.S.; McIver, C.D.; Edney, E.O. (2004). Determination of Secondary Organic Aerosol Products from the Photooxidation of Toluene and their Implications in Ambient PM2.5. Journal of Atmospheric Chemistry 47, 79-100.
Kramer, A. J.; Rattanavaraha, W.; Zhang, Z.; Gold, A.; Surratt, J. D.; Lin, Y.-H. (2016) Assessing the oxidative potential of isoprene-derived epoxides and secondary organic aerosol. Atmospheric Environment 130, 211-218.
Laskin, A.; Laskin, J.; Nizkorodov, S., (2015). Chemistry of Atmospheric Brown Carbon. Chemical Reviews, 115 (10), 4335-4382.
Lauraguais, A.; Coeur-Tourneur, C.; Cassez, A.; Deboudt, K.; Formentin, M.; Choel, M.; (2014). Atmospheric reactivity of hydroxyl radicals with guaiacol (2-methoxyphenol), a biomass burning emitted compound: Secondary organic aerosol formation and gas-phase
oxidation products. Atmos. Environ., 86, 155-163.
Li, N., Sioutas, C., Cho, A., Schmitz, D., Misra, C., Sempf, J., Wang, M., Oberley, T., Froines, J., Nel , A. (2003a). Ultrafine particulate pollutants induce oxidative stress and
mitochondrial damage. Environ. Health Perspect. 111 (4), 455-460.
Li, N., Hao, M., Phalen, R.F., Hinds, W.C., Nel, A.E. (2003b). Particulate air pollutants and asthma, a paradigm for the role of oxidative stress in PM-induced adverse health effects. Clin. Immunol. 109, 250-265.
Li, N., Xia, T., Nel, A. E., (2008). The role of oxidative stress in ambient particulate matter- induced lung diseases and its implications in the toxicity of engineered nanoparticles. Free Radical Biology and Medicine, 44 (9), 1689-1699.
Li, Q., Wyatt, A., Kamens, R.M., (2009). Oxidant generation and toxicity enhancement of aged- diesel exhaust. Atmos. Environ., 43 (5), 1037-1042.
Lighty, J.S.; Veranth, J.M.; Sarofim, A.F., (2000). Combustion Aerosols: Factors Governing Their Size and Composition and Implications to Human Health, Journal of the Air & Waste Management Association, 50 (9), 1565-1618.
Lin, G.; Penner, J. E.; Sillman, S.; Taraborrelli, D.; and Lelieveld, J., (2012). Global modeling of SOA formation from dicarbonyls, epoxides, organic nitrates and peroxides. Atmos. Chem. Phys., 12, 4743-4774.
Mao, J.; Horowitz, L.W.; Vaishali, N.; Fan, S.; Liu, J.; Fiore, A., (2013). Sensitivity of
McWhinney, R.D., Badali, K., Liggio, J., Li, S.-M., Abbatt, J.P.D., (2013). Filterable redox cycling activity: a comparison between diesel exhaust particles and secondary organic aerosol constituents. Environ. Sci. Technol., 47, 3362-3369.
Mochida, M.; Kawamura, K.; Fu, P.; Takemura, T.; (2010). Seasonal variation of levoglucosan in aerosols over the western North Pacific and its assessment as a biomass-burning tracer. Atmos. Environ., 44 (29), 3511-3518.
Pope, C.A.; Dockery, D.W., (2006). Health Effects of Fine Particulate Air Pollution: Lines that Connect. J. Air & Waste Manage. Assoc., 56, 709-742.
Poster, D.L.; Schantz, M.M.; Sander, L.C.; Wise, S.A., (2006). Analysis of polycyclic aromatic hydrocarbons (PAHs) in environmental samples: a critical review of gas chromatographic (GC) methods. Anal. Bioanal. Chem., 386 (4), 859-881.
Rattanavaraha, W.; Rosen, E.; Zhang, H.; Li, Q.; Pantong, K.; Kamens, R.M., (2011). The reactive oxidant potential of different types of aged atmospheric particles: an outdoor chamber study. Atmos. Environ., 45, 3848-3855.
Schauer, J.J.; Kleeman, M.J.; Cass, G.R.; Simoneit, B.R.T., (2001). Measurement of Emissions from Air Pollution Sources. 3. C1−C29 Organic Compounds from Fireplace Combustion
of Wood. Environ. Sci. Technol., 35 (9), 1716-1728.
Simoneit, B.R.T.; Schauer, J.J.; Nolte, C.G.; Oros, D.R.; Elias, V.O.; Fraser, M.P.; Rogge, W.F.; Cass, G.R., (1999). Levoglucosan, a tracer for cellulose in biomass burning and
atmospheric particles. Atmos. Environ., 33 (2), 173-182.
Stockwell, C.E.; Veres, P.R., Williams, J.; Yokelson, R.J., (2015). Characterization of biomass burning emissions from cooking, peat, crop residue, and other fuels with high-resolution proton-transfer-reaction time-of-flight mass spectrometry. Atmos. Chem. Phys., 15, 845- 865.
Surratt, J.D.; Chan, A.W.H.; Eddingsaas, N.C.; Chan, M.; Loza, C.L.; Kwan, A.J.; Hersey, S.P.; Flagan, R.C.; Wennberg, P.O.; Seinfeld, J.H., (2010). Reactive intermediates revealed in secondary organic aerosol formation from isoprene. PNAS, 107 (15), 6640-6645.
Tao, F.; Gonzalez-Flecha, B.; Kobzik, L., (2003). Reactive oxygen species in pulmonary inflammation by ambient particles. Free Radical Biology & Medicine, 35 (4), 327-340. Usup, A.; Hashimoto, Y.; Takahashi, H.; Hayasaka, H., (2004). Combustion and Thermal
Characteristics of peat fire in tropical peatland in Central Kalimantan, Indonesia. Tropics, 14 (1), 1-19.
Verma, V., Rico-Martinez, R., Kotra, N., King, L., Liu, J., Snell, T.W., Weber, R.J., (2012). Contribution of water-soluble and insoluble components and their hydrophobic/ hydrophilic subfractions to the reactive oxygen species-generating potential of fine ambient aerosols. Environ. Sci. Technol., 46, 11384-11392.
Verma, V.; Fang, T.; Xu, L.; Peltier, R.E.; Russell, A.G.; Ng, N.L.; Weber, R.J., (2015). Organic aerosols associated with the generation of reactive oxygen species (ROS) by water- soluble PM2.5. Environ. Sci. Technol., 49, 4646-4656.
Vreeland, H.; Schauer, J.J.; Russell, A.G.; Marshall, J.D.; Fushimi, A.; Jain, G.; Sethuraman, K.; Verma, V.; Tripathi, S.N.; Bergin, M.H., (2016). Chemical characterization and toxicity of particulate matter emissions from roadside trash combustion in urban India. Atmos. Environ., 147, 22-30.
World Health Organization (WHO). WHO Air quality guidelines for particulate matter, ozone, nitrogen dioxide and sulfur dioxide. Global update 2005, Summary of Risk Assessment. Wilhelm, M.; Ghosh, J.; Su, J.; Cockburn, M.; Jerrett, M.; Ritz, B., (2012). Traffic-related air
toxics and term low birth weight in Los Angeles County, California. Environ Health Perspect.,120, 132–138.
Xing, Y.; Xu, Y.; Shi, M.; Lian, Y., (2016). The impact of PM2.5 on the human respiratory system. Journal of Thoracic Disease, 8 (1), E69-E74.
Yang, A., Jedynska, A., Hellack, B., Kooter, I., Hoek, G., Brunekreef, B., Kuhlbusch, T.A.J., Cassee, F.R., Janssen, N.A.H., (2014). Measurement of the oxidative potential of PM2.5 and its constituents: the effect of extraction solvent and filter type. Atmos. Environ., 83, 35-42.
Zhang, H.; Surratt, J. D.; Lin, Y. H.; Bapat, J.; Kamens, R. M., (2011). Effect of relative humidity on SOA formation from isoprene/NO photooxidation: enhancement of 2-
methylglyceric acid and its corresponding oligoesters under dry conditions. Atmos. Chem. Phys., 11, 6411-6424.
Zhang, T.; Claeys, M.; Cachier, H.; Dong, S.; Wang, W.; Maenhaut, W.; Liu, X., (2008).