TRANSCRIPTOME DYNAMICS DURING THE MAMMALIAN CELL CYCLE.
Daniel I. Dominguez
A dissertation submitted to the faculty of the University of North Carolina at Chapel Hill in partial fulfillment of the requirements for the degree of Doctor of Philosophy in the
Department of Pharmacology
Chapel Hill 2014
ii © 2014
iii ABSTRACT
DANIEL I. DOMINGUEZ: Transcriptome Dynamics during the Mammalian Cell Cycle. (Under the Direction of Zefeng Wang, Ph.D.)
In recent years, technologies capable of simultaneously deciphering the nucleotide sequence and expression level of most RNAs in the cell have challenged the simplistic view of one gene-one protein. It is now well-appreciated that the cell has a tremendous level of flexibility during RNA processing (i.e. alternative splicing) to produce multiple coding mRNAs from single gene unit. Another surprising find is that most of the genome is transcribed, which leads to the production of a large proportion of RNAs without coding potential (i.e. lncRNAs). Global transcriptome rearrangements have been shown to occur during and regulate key biological processes like development and differentiation.
iv
v
ACKNOWLEDGEMENTS
I would like to thank my advisor, Zefeng Wang, for his continued support over the last five years. When I came to UNC, Zefeng was new at running a lab and I was new at being a graduate student. I think we have done awesome together. Zefeng is a brilliant scientist with a ton of foresight, so I really appreciate that he let me see some of my ideas through, even when they seemed likely to fail. Altogether, I couldn’t be happier with the relationship that we have developed.
I am also thankful for the members of the Wang lab, past and present: Yang Wang, Rajarshi Choudhury, Shannon Tsai, Meng Ma, Shuyun Dong, Wenjing Zhang and Russell Maxwell. Yang and Raj were especially helpful in the early days, when the lab was still acquiring momentum. Russell worked alongside with me for a few years to ensure all work gets done. I am also grateful for my thesis committee members: Gary Johnson, Lee Graves, Bill Marzluff and Henrik Dohlman. I thank you for being extremely helpful in both science and career advice.
vi
TABLE OF CONTENTS
LIST OF TABLES ... ix
LIST OF FIGURES ... x
LIST OF ABBREVIATIONS ... xii
CHAPTERS I. Introduction ... 1
The mitotic cell cycle ... 1
Regulation of cell cycle progression ... 2
RNA dynamics during the cell cycle ... 4
The cycle-dependent gene expression program ... 4
The G1/S wave ... 6
The G2/M wave ... 9
The M/G1 wave ... 9
Quality control checkpoints ... 9
The DNA-damage checkpoint ... 10
The spindle assembly checkpoint ... 11
RNA processing ... 12
Transcription, RNA splicing and alternative splicing ... 12
SR proteins ... 13
CLK kinases ... 15
Cellular regulation of CLK kinases ... 18
vii
CLK homologs... 19
Global gene expression by CLKs ... 20
Connections between cell cycle and splicing ... 20
Thesis objectives ... 23
II. Materials and methods ... 24
Chapter III ... 24
Chapter IV ... 30
Chapter V ... 33
III. Transcriptome dynamics during the mitotic cell cycle ... 35
Introduction ... 35
Results ... 37
Sequencing the cell cycle-dependent transcriptome ... 37
Identification, function and regulation of periodic genes ... 38
Consistency across datasets ... 40
Identification of periodic alternative splicing ... 42
Putative cis-elements and trans-factors that regulate periodic AS ... 44
Discussion ... 45
IV. CLK1 kinase controls cell cycle processes via an alternative splicing network ... 57
Introduction ... 58
Results ... 58
CLK1 is cell cycle regulated ... 58
viii
CLK1 a kinase is engaged in negative ... 60
CLK1-mediated transcriptome regulation ... 62
CLK1 control CENPE alternative splicing ... 63
CLK1 and SFRS1 regulate CHEK2 splice ... 64
CHEK2 variants have different biochemical properties ... 65
CLK1 is required for normal cell cycle progression and proliferation ... 67
Discussion ... 69
IV. Mitotic trait: A computational method for inferring cell-cycle stage ... 89
Introduction ... 89
Results ... 91
Mitotic trait of cells based on transcriptome profile ... 91
Mitotic trait of single cells from the human embryo ... 92
Mitotic trait of human breast cancers and correlation with molecular subtypes ... 93
Pan-cancer mitotic trait analysis... 94
Discussion ... 94
VI. Concluding remarks ... 102
Summary ... 102
Outstanding questions ... 102
ix
LIST OF TABLES TABLE
x
LIST OF FIGURES FIGURE
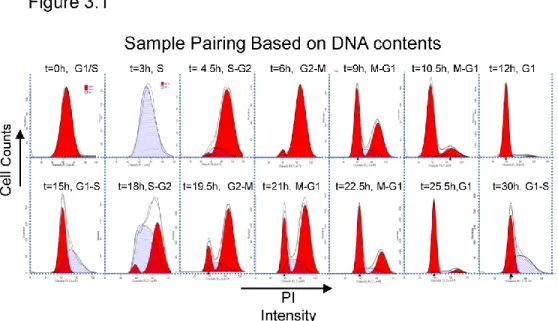
3.1: Cell cycle analysis of synchronized HeLa cells ... 48
3.2: Periodic mRNA expression during cell cycle ... 49
3.3: Periodic mRNA regulation and function ... 51
3.4: Pervasive cell cycle-dependent alternative splicing ... 53
3.5: Cell cycle-dependent alternative splicing alters protein coding potential ... 55
4.1: Cell cycle-dependent expression of CLK1 ... 71
4.2: CLK1 protein auto-regulation during cell cycle ... 73
4.3: CLK1-regulated AS network ... 75
4.4: Validation of CLK1-regulated AS network ... 76
4.5: Regulation of CENPE by CLK1 during cell cycle ... 78
4.6: Regulation of CHEK2 by CLK1 and SRSF1 ... 79
4.7: Functional differences between CHEK2 splice variants ... 81
4.8: CLK1-regulated gene and cell cycle control ... 83
4.9: CLK1 is required for normal cell progression ... 85
4.10: CLK1 is required for mitosis and cytokinesis ... 86
4.11: CLK1 is required for cellular proliferation ... 88
5.1: Pairwise sample correlations ... 97
5.2: Mitotic trait of single cells from the human embryo ... 98
5.3: Mitotic trait of breast tumors according to molecular subtype. ... 99
xi
xii
LIST OF ABBREVIATIONS
DD and ZW: unpublished observation from Daniel Dominguez and Zefeng Wang G1: Gap 1
G2: Gap2
S: DNA synthesis phase M: Mitosis
CDKs: cyclin dependent kinases
RB: the tumor suppressor retinoblastoma
p53: the tumor suppressor protein of 53 kilodaltons HaCaT: Immortal human keratinocyte
U2OS: Human osteosarcoma cell line E2F: Transcription factor E2F
FOXM1: Forkhead box protein M1 CHEK1: Checkpoint kinase-1 CHEK2: Checkpoint kinase-2 ATM: Ataxia telangiectasia mutated
ATR: Ataxia telangiectasia-mutated and Rad3-related homolog AURKB: Aurora kinase B
xiii MCC: mitotic checkpoint complex
CLK: Cdc2-like kinase
DOA: Darkener of apricot (CLK homolog in fly)
KIC1: Kinase that interacts with CDC31 (CLK homolog in yeast) HDAC: Histone deacetylase
CHIP: Chromatin immunoprecipitation SRPKs: Serine arginine protein kinases CLK1 KD: CLK1 kinase dead mutant CLK1 WT: CLK1 kinase wild type
CHEK∆9: CHEK2 lacking exon 9 sequence RBP: RNA binding protein
KHCB-619: inhibitor CLK1 MG132: Inhibitor of proteasome DNA: Deoxyribonucleic acid mRNA: messenger RNA
pre-mRNA: pre-messenger RNA
HNRNPs: Heterogeneous nuclear ribonucleoproteins snRNAs: Small nuclear ribonucleic acid
SRSFs: Serine/arginine-rich splicing factor (refers to SR proteins) RS domain: Arginine serine rich domain
TXN: Transcription factor motif
xiv RNA: Ribonucleic acid
FBS: Fetal bovine serum
PBS: Phosphate buffered saline RNA-seq: RNA-sequencing Hrs: hours
Min: minutes mM: millimolar μM: micromolar
dNTP: deoxynucleotide triphosphate PVDF: Polyvinylidene difluoride DMSO: Dimethyl sulfoxide CMV: Cytomegalovirus nt: nucleotides
lincRNA: long intergenic non-coding RNA
Cy5-dCTP: Cyanine 5-conjugate cytosine triphosphate GO: Gene ontology
TG003: inhibitor of CLK1
RT-PCR: Reverse transcription polymerase chain reaction PCR: Polymerase chain reaction
SDS-PAGE: Sodium dodecyl sulfate polyacrylamide gel electrophoresis RNAi: RNA interference
xv ss: splice site
AS: alternative splicing PSI: percent spliced in MISO: mixture of isoforms
FPKM: fragments per kilobase per million ED: Euclidean distance
SE: skipped exon RI: retained intron
A5E: alternative 5’ splice site A3E: alternative 3’ splice site
TUTR: tandem untranslated regions MXE: mutually exclusive exons
FLAG: Polypeptide tag consisting of DYKDDDDK HA: Hemagglutinin tag consisting of YPYDVPDYA GFP: Green fluorescent protein
1
I. Introduction
The mitotic cell cycle
The cell division cycle is an indispensable biological process that affords living organisms the ability to replicate, divide and evolve. Across eukaryotes, there are differences in cell division but the general set of factors and order of events in cell cycle control are conserved (Norbury and Nurse 1992). Here I provide an overview of our current understanding of the mitotic cell cycle and raise some of the central questions pertinent to the research presented below.
2
spindle microtubules. These attachments are made at the center plane of the cell known as the metaphase plate. Once all chromosomes are aligned at the metaphase plate, sister chromatids are pulled away from each other towards opposite ends of the cell during anaphase and telophase. If the genetic material has been distributed equally without errors, cells undergo cytokinesis and separate into two daughter cells. The fidelity of molecular events that occur, especially during genome duplication and chromosome segregation, is tightly regulated and frequently altered in disease (as discussed below).
Regulation of cell cycle progression
Cell cycle regulation is largely achieved through waves of periodic gene function that are under the control of a small family of protein kinases known as the cyclin-dependent kinases (CDKs). CDKs are the master regulators that orchestrate cell cycle transitions (Morgan 1997; Satyanarayana and Kaldis 2009). In humans, there are four major CDKs (CDK1, CDK2, CDK4 and CDK6) with well-defined roles in cell cycle control (Malumbres and Barbacid 2009). CDK activity requires the binding of regulatory cyclin subunits of which there are four different classes (A-, B-, D-, and E- type) (Malumbres and Barbacid 2005). The synthesis, ability complex with CDKs and the destruction of regulatory cyclin subunits is a function of cell cycle stage. Therefore, CDK activity is also a function of cell cycle stage.
3
4
this degradation promotes sister chromatid segregation (Acquaviva and Pines 2006). Successful chromosome segregation initiates a complex set of events involving motor proteins, major cytoskeletal rearrangements and DNA de-condensation factors that drive the separation of daughter cells.
RNA dynamics during the cell cycle
Periodic gene function can be achieved by mechanisms that control transcription, translation, mRNA stability, protein modification and protein stability. Importantly, these mechanisms synergize to fine tune gene function during cell division. Here I focus primarily on the production, processing and maintenance of RNAs during cell cycle. Periodic genes can be clustered into three major waves based on their peak expression at G1/S, G2/M and M/G1 (Bahler 2005). These expression waves are largely under the control of CDK activity. A large body of work has focused on determining the set of transcripts that oscillate during cell cycle and the underlying regulatory mechanisms that control these gene expression behaviors. First, I review the results of large-scale data sets that have aimed at defining the cell cycle-dependent transcriptome, and subsequently I discuss the major regulatory mechanisms underlying these dynamics.
The cycle-dependent gene expression program
5
cancer HeLa cell line (Whitfield, Sherlock et al. 2002). The authors applied various chemical-based synchrony techniques and tracked changes in mRNA levels using microarray assays. Chemical cell synchrony has advantages over serum starvation/stimulation because serum stimulation activates more than a cell cycle-dependent transcriptional program and confounds the interpretation of the data (Iyer, Eisen et al. 1999). Furthermore, serum starvation promotes entry into G0, which is different from G1 phase (Coller, Sang et al. 2006).
To identify periodic genes, the authors applied a Fourier transform method capable of identifying expression patterns with sinusoidal shapes. This method was sensitive enough to capture most of the previously known periodically expressed genes. In total, about 600 periodic mRNAs (if only microarray probes that correspond to current transcript annotations are counted) were identified. These data also demonstrated that periodic peak expression can occur at any point during cell cycle, however most transcripts tend to cluster into the three waves discussed above (G1/S, G2/M and M/G1). An important feature gleaned from this work is that genes with similar functions during cell cycle have near-identical expression patterns. For example, the DNA-synthesis machinery is expressed in two waves, an early and a late phase. Early S-phase genes encode components of the pre-replicative machinery while the late S-phase genes include factors required for continued DNA synthesis and factors involved in DNA repair. Similar observations were made in early and late G2 phases.
6
and Rb) (Scheffner, Munger et al. 1991). Subsequent genome-wide studies followed the Whitfield et al. (2002) study and have helped shed some light on the general features of the cell cycle-dependent transcriptome. Four additional studies using normal foreskin fibroblast (Bar-Joseph, Siegfried et al. 2008), the U2OS osteosarcoma (Grant, Brooks et al. 2013), the HaCaT keratinocyte cell line (Pena-Diaz, Hegre et al. 2013) and I include the data that will be presented below from synchronized HeLa cells. Interestingly the overlap between any two studies appears to be between 40%-70% with the HaCaT cell line have the least overlap with any other cell lines. As it turns out, the overlap between the two HeLa studies performed, is not particularly greater that the overlap across different cell lines. These data likely reflect the inherent differences across lab lines of the same cell line. Cell cycle-dependent transcription programs across all cell types analyzed thus far share a core set of genes. However, this gene set is very small with only 97 genes across 4 studies and as few as 67 across 5. These 67 core genes tend to have high periodic scores (meaning their expression pattern is robustly sinusoidal) indicating that this modest overlap might be a consequence of the constraints imposed by the methodologies used. Our analysis of these 67 genes indicates that they are predominantly involved in mitotic control. This may reflect an absolute requirement for oscillations in mitotic RNAs. As one would expect there are deleterious consequences if condensation of the genome or breakdown of the nucleus occurs at inappropriate stages.
The G1/S wave
7
underlying regulatory mechanisms that control cell cycle-dependent gene expression are best understood in the context of transcriptional regulation by the combined actions of repressors and activators.
8
Examination of the epigenetic modifications of the G1/S cluster revealed targeting by polycomb repressor complex (PRC) which binds DNA via the histone H3 lysine 27 tri-methylation mark to silence transcription (Pena-Diaz, Hegre et al. 2013). More generally, histone deacetylase (HDACs) inhibitors induce G1/S arrest in various cell lines by increasing the transcription of CDK inhibitors (Newbold, Salmon et al. 2013). Drugs that target the epigenetic landscape of actively dividing cells are emerging as potent inhibitors of cell cycle progression. Although the details regarding the specific mechanisms remain unclear, these small molecules have been shown to disrupt the cell cycle-dependent expression programs (McLaughlin, Finn et al. 2003; Li, Li et al. 2013)
9
The G2/M wave
Another striking feature of the G1/S wave is its ability to promote the expression of factors that will directly or indirectly initiate the subsequent G2/M expression wave. G2/M transcriptional regulation is less well defined than G1/S. A key factor involved in the G2/M transition is FOXM1 (although there are also roles for this transcription factor in DNA synthesis) (Grant, Brooks et al. 2013) (Wierstra and Alves 2007; Wierstra 2013; Wierstra 2013). Early studies demonstrated that FOXM1 activates the expression of Cyclin B, Cyclin A and Cdc25B (a key cell cycle phosphatase) in G2 and M, both of which are required for progression through mitosis. Later it was found that the vast majority of the G2/M wave genes are bound by FOXM1 as measure by CHIP assays (Grant, Brooks et al. 2013). Grant et al., demonstrated that placing the DNA-binding motif corresponding to FOXM1 protein in a synthetic reporter construct led to periodic expression of the reporter, disrupting FOXM1 levels in these cells abrogated the periodic expression behavior of the reporter (Grant, Gamsby et al. 2012). Consistent with all the findings described, loss of FOXM1 leads to mitotic arrest, chromosome instability and inhibition of proliferation (Laoukili, Kooistra et al. 2005).
The M/G1 wave
10
including FOXA1, PITX2, and PAX6A. As will be shown below, the genes that belong to this cluster do not have major cell cycle functions. It’s also worth noting, that during mitosis transcription is mostly inactive which likely explains the lack of a clear G2/M expression wave.
Despite our current global and mechanistic understanding of cell cycle progression many questions remain. Do the observed changes in mRNA correlate with a change in protein level? Of the periodic genes identified, how many of them are required for cell cycle progression?
Quality control checkpoints in cell cycle The DNA-damage checkpoint
11
induction of CDK inhibitors, DNA repair factors and apoptotic proteins. In this way, the cell can arrest and repair the damage, enter a state of cellular senescence or undergo apoptosis. Cell fate is governed by the severity/repairability of the damage and the oncogenic state of the cell in question.
The spindle assembly checkpoint
12
damage from aberrant segregation involves mechanisms that activate p53 (Hayashi, Cesare et al. 2012); (Orth, Loewer et al. 2012).
RNA processing
Transcription, RNA splicing and alternative splicing
13
In higher eukaryotes, AS enables most single gene units to produce multiple coding mRNAs and therefore potently magnifies proteomic diversity. The impact of AS in producing a wealth of transcript diversity is exemplified by the DSCAM gene in flies. Over 30,000 different splice variants can be produced from this single gene unit and most have been observed. The number of possible splice from DSCAM alone is about two times the total number of genes in the D. melanogaster genome (Park and Graveley 2007; Sun, You et al. 2013). High-throughput sequencing technologies have enabled the assessment of splicing patterns of most transcripts in cells. The application of these assays to dynamic processes has made it clear that, much like transcriptional programs, AS programs control biological events. These include cellular differentiation (Xue, Ouyang et al. 2013), development (Cooper 2005), the circadian rhythm (Hughes, Grant et al. 2012), oncogenesis (reviewed in (Venables 2004; Kalnina, Zayakin et al. 2005; Gardina, Clark et al. 2006; Skotheim and Nees 2007), the epithelial to mesenchymal transition (Shapiro, Cheng et al. 2011), the stem cell state (Gabut, Samavarchi-Tehrani et al. 2011; Han, Irimia et al. 2013) and even speciation (Su, Wang et al. 2006; Chen, Wu et al. 2011).
Regulation of alternative splicing primarily comes from cis-sequence elements near ss. These short sequences of RNA (6-10 bp) typically recruit trans-acting splicing factors that promote or inhibit the use of adjacent splice sites (Wang and Burge 2008).
SR proteins
14
that specifically recognizes RNA and a functional arginine-serine (RS) repeat module that alters splicing outcomes. The modes by which splicing regulation occurs once a trans-factor occupies a cis-RNA element are diverse and still being actively investigated. It is generally accepted that trans factors alter early to intermediate assembly steps of the spliceosome at nearby exons to promote or inhibit the use of adjacent splice sites.
SR proteins are regulated by post-translational modifications (i.e. phosphorylation, acetylation and ubiquitnation) that alter their localization, stability or activity in response to various signaling cues. These dynamic modifications have been shown to stimulate rapid signal-dependent changes in AS that control phenotypic outputs such as apoptosis (Edmond, Moysan et al. 2011; Shi, Nishida et al. 2011). SR protein phosphorylation has also been shown to depend on cell cycle stage with a general increase in canonical SR protein phosphorylation during mitosis (Gui, Lane et al. 1994), however the functional consequences of such increases or responsible kinase(s) are not known. Signaling pathways, including the mammalian target of rapamycin (MTOR) pathway (DD and ZW), the PI3kinase/Akt (Zhou, Qiu et al. 2012) pathway and oncogenic transformation by Ras have been shown to induce widespread changes in AS. Importantly, the mechanisms driving these changes appear to be via SR protein phosphorylation.
It is worth noting that alternative splicing regulation is very complex. In addition to
15
functions (activators/repressors) have been shown to have a high-degree of overlapping RNA sequence specificity, making it difficult to predict outcomes (Wang, Xiao et al. 2013). Additionally, because most splicing occurs co-transcriptionally it is also affected by promoter choice and transcription rate (Cramer, Caceres et al. 1999; Kornblihtt 2007; Schor, Gomez Acuna et al. 2013) as well as local chromatin structure, nucleosome positioning and histone modifications (reviewed by (Luco, Allo et al. 2011). These diverse mechanisms of AS regulation have made it nearly impossible to decipher the so-called “splicing code.”
Cdc2-like kinases
CLK kinases were originally discovered due to their similarity to the cell division
cycle 2 proteins (CDC2/CDK1) but, in contrast to CDKs, CLKs do not require the binding of cyclin subunits (Ben-David, Letwin et al. 1991). To date, no cell cycle-dependent functions for these proteins have been demonstrated. Humans encode four CLK paralogs (CLK1, 2, 3 and 4), of which CLK1, 2 and 4 appear to be ubiquitously expressed whereas CLK3 is restricted to the testes (Nayler, Stamm et al. 1997). CLK1 and CLK4 are most
16
SRSF2 (Colwill, Feng et al. 1996; Colwill, Pawson et al. 1996; Duncan, Stojdl et al. 1998; Moeslein, Myers et al. 1999; Prasad and Manley 2003; Ngo, Chakrabarti et al. 2005; Bullock, Das et al. 2009). Using in vitro splicing assays, it was shown that hypo- or hyper- phosphorylation of these two factors reduces their ability to control splicing (Prasad, Colwill et al. 1999). Interestingly, adding active CLK1 kinase to in vitro splicing assays generally inhibits splicing regulation altogether. Conversely, doping an in vitro splicing assay with a catalytic mutant of CLK1 enhances splicing. In cells, CLK1 has been shown to interact with a number of SR proteins and co-localizes with splicing factors at nuclear speckles (a nuclear body thought to serve as a storage compartment for splicing regulators) (Colwill, Pawson et al. 1996).
17
tight form of auto-regulation ensures the fine control of active CLK1/4 enzymes. Indeed, disrupting the levels of CLK1 in cells can have deleterious consequences, as will be demonstrated below. Furthermore, I demonstrate that CLK1/4 auto-regulation extends beyond the RNA level. Interestingly, CLK2 and CLK3 do not auto-regulate in this way (DD and ZW).
It was recently found that partially processed CLK1/4 transcripts reside in the nucleus, poised to be post-transcriptionally spliced at the same region described above (Ninomiya, Kataoka et al. 2011). Upon heat-shock the cell quickly splices these “pre-mRNAs” to produce functional transcripts and increases protein levels. Furthermore, the authors of this study demonstrated that this stress-induced splicing also increased the phosphorylation of CLK1 substrates. These include two SR proteins (SRSF10 and SRSF4). Phenotypically, the consequence of these events remains unclear.
CLK1 has also been shown to regulate post-transcriptional processing of other pre-mRNAs. In platelets, which lack a nucleus and therefore the capacity to transcribe RNAs, CLK1 responds to the coagulation cascade and coordinates the splicing of a pool of tissue factor (TF) pre-mRNAs (TF is required for the coagulation cascade) (Schwertz, Tolley et al. 2006). In this case, CLK1 phosphorylates a specific SR protein, SRSF1. Although details regarding how CLK1 stimulates the activity of the spliceosome via SRSF1 phosphorylation are unclear, this form of splicing regulation is very interesting. This highly-specialized mechanism of splicing regulation affords platelets control over gene expression even in the absence of a nucleus.
Post-18
transcriptional splicing bypasses the necessity for transcription, allowing the cell to adapt to the environment very quickly. I hypothesize that post-transcriptional splicing is a form of gene regulation which is far more prevalent than currently appreciated. The application of high-throughput techniques to resolve time-dependent transcriptome dynamics will be instrumental in uncovering these events.
Cellular regulation of CLK1 kinases
19
AS while CLK2 probably regulates gene expression. Some of the biochemical differences between these two factors will be discussed in more detail in the results below.
CLK inhibitors
Efforts to generate small-molecule inhibitors of CLKs have seen some success. The small compound TG003 was developed as a selective CLK1 inhibitor but also acts on CLK4 and CLK2 with two- and ten- fold less specificity, respectively (Muraki, Ohkawara et al. 2004). TG003 was shown to disrupt AS in human cell culture systems and impaired the development of zebra fish. Another inhibitor of CLK1, KHCB-619, has shown similar efficiency as TG003 (Fedorov, Huber et al. 2011). Interestingly, several studies claimed that minimal loss of cell viability and growth was observed upon inhibition of CLK1. I address this question more thoroughly below and show that our data are in direct conflict.
CLK homologs
20
been shown to regulate both mitotic progression and splicing (Tang, Luca et al. 2011). Mechanistic insight regarding Kic1 regulation of either cell cycle or AS, and whether these two processes are coupled, is unknown.
Global gene expression by CLKs
To date, global gene regulation events responsive to CLK activity are mostly unknown. Most of the AS events controlled by CLK1 have been identified on a case-by-case basis, some of which have been discussed already. Limited information regarding global CLK1 gene regulation has made it difficult to assign a major biological role to this factor. SR proteins have additional functions in translation (Michlewski, Sanford et al. 2008), mRNA export (Escudero-Paunetto, Li et al. 2010), genome stability (Li and Manley 2005) and more recently in oncogenesis (Ghigna, Giordano et al. 2005; Karni, de Stanchina et al. 2007; Karni, Hippo et al. 2008; Anczukow, Rosenberg et al. 2012).
Connections between cell cycle and splicing
21
for this notion. For example, the aberrant splicing of specific cell cycle regulators (p53, CDC25B, CDC25C and Cyclin D) due to genetic mutations or loss of splicing machinery components causes cell cycle defects (Ghosh, Stewart et al. 2004; Holley, Heighway et al. 2005; Rohaly, Chemnitz et al. 2005; Pacheco, Moita et al. 2006; Olivares-Illana and Fahraeus 2010; Fregoso, Das et al. 2013). The evolutionarily conserved gene enhancer of rudimentary homolog (ERH) was shown cause intron retention in the key mitotic motor protein CENPE leading to severe mitotic defects (Weng, Lee et al. 2012). While these data demonstrate that splicing is required for the cell cycle, the phenotype is most likely a consequence of the loss of splicing as a house-keeping process. Similarly, blocking transcription would be expected to induce cell cycle arrest as a consequence of the loss of key cell cycle regulators. These observations, however general, have prompted the use of the general splicing inhibitor spliceostatin A for blocking tumor proliferation. Reportedly, this drug functions by non-covalently interacting with a protein within the spliceosome (SF3b) and acts as a general splicing inhibitor (Nakajima, Hori et al. 1996; Kaida, Motoyoshi et al. 2007). Again, these results reflect a link between cell cycle progression and splicing.
22
of splicing in other cell cycle stages has not been shown.
Above, I described a link between constitutive splicing and cell cycle control. Whether AS and cell cycle mutually control each other remains unclear. Thus far, several studies suggest that this likely occurs. Loss of several alternative splicing regulators has been shown to induce cell cycle defects. Loss of SRSF1 (Li, Wang et al. 2005; Edmond, Merdzhanova et al. 2013), SRSF2 (Xiao, Sun et al. 2007), SRSF3 (Loomis, Naoe et al. 2009; Kurokawa, Akaike et al. 2013) and SON (Ahn, DeKelver et al. 2011) alter cell cycle progression. In the case of SRSF1 and SON, it was shown that several cell cycle regulators were alternatively spliced into non-productive isoforms. One study demonstrated that the splicing pattern of the DNA-damage checkpoint kinase CHEK1 was dynamic during cell cycle at the protein level (Pabla, Bhatt et al. 2012).
23
Thesis objectives
AS has emerged as a critical mode of gene regulation and the evidence presented above suggest that AS regulation might be a function of cell cycle. What is lacking is a systematic study to determine if AS is under cell cycle periodic control. What genes (if any) are periodically spliced? Can we identify splicing regulators that serve to ensure periodic splicing occurs? What are the phenotypic consequences of disruption periodic AS? Can information about transcriptome-wide dynamics during cell cycle be used to learn something new about disease states (i.e. cancer)? I propose the following:
1. Uncover transcriptome dynamics during cell cycle.
2. Identify coding transcripts that are periodically expressed. 3. Determine if lncRNAs are periodically expressed.
4. Determine if alternative splicing is under cell cycle control (periodic AS).
5. Use computational approaches to identify putative regulatory mechanisms for 2, 3 and 4.
6. Use computational approaches to functionally classify the genes identified in 2, 3 and 4
7. Uncover the underlying regulatory mechanisms for AS regulation during cell cycle 8. Determining if disrupting periodic AS leads to cell cycle defects.
9. Use the information from our periodic transcriptome to develop a computational approach capable of inferring the cell cycle stage of any sample with gene expression data.
24
II. Materials and Methods
Chapter III
Cell culture and cell cycle synchronizations
HeLa (kind gift from J. Trejo), HEK 293T (from ATCC) and A549 (kind gift from W. Kim) cells were maintained in DMEM (Gibco) medium supplemented with 10% FBS (Gibco). All cells were cultured in a humidified incubator with 5% CO2. Cell cycle
synchronization was adopted from the protocol of Whitfield et al. Briefly, ~ 750,000 log phase HeLa cells were plated in 15 cm dishes in complete media and allowed to adhere for 16hrs. Cells reached < 30% confluence and were treated with 2mM thymidine (Sigma) for a total of 18hrs. Treated cells were then washed 2 times with 1XPBS and allowed to recover in fresh complete media for 10hrs without drug. 2mM thymidine was subsequently added for a second thymidine treatment lasting an additional 18 hrs. Thymidine solution was freshly prepared for each experiment in 1XPBS and passed through 4.5uM filter (Amicon). Cells were then washed as described previously and released in complete medium. Collections were made every 1.5 hrs.
25
Cell collections
Cells from synchronization experiments were collected as follows: plates were washed two times with 1XPBS, each time all solutions coming in contact with the culture dish were kept to prevent the loss of the non-adherent mitotic cells. Washed plates were treated with 0.05% Trypsin EDTA (Gibco). Trypsin was neutralized with cell media and all collected liquid from each sample was pooled and spun down at 1,500 rpm. Cell pellet was washed with 1XPBS and was split three ways for collection of protein, RNA and flow cytometry.
Flow cytometry and cell cycle analysis
Cells were collected as described above. Pellet was re-suspended in 1X weight/cell volume in 1XPBS and fixed in 80% ice cold ethanol (10X final cell volume) for at least 4 hrs (usually overnight) at -20° C. Cells were spun at 2,000 RPM at 4° C for 5 min then washed twice with 1XPBS. Cell pellet was re-suspended in propidium idodide/RNAse staining buffer (BD pharmingen). Cells were analyzed by flow cytometry to count 10,000 cells that satisfied gating criteria. Data collected were analyzed using ModFit software to discern 2N (G1), S-phase and 4N (G2 and M) composition.
RNA preparations and RNA sequencing
26
quality and expected size of fragment was assessed by standard gel electrophoresis and spectrophotometry. RNA-seq libraries were robotically prepared with the TruSeq Sample Prep Kit (Illumina) according to manufacturer’s protocol. Samples were prepared and each was barcoded at the primer ligation step for future analysis. The 14 samples were mixed at equal concentrations and sequenced on one full chip of HiSeq 2000 (Illumina), using the pair-end protocol with 100 bp read length. This approach resulted in 8 technical sequencing replicates per sample.
Mapping and filtering of RNA-seq data
27
not meet criteria then its gene expression value was adjusted to the mean of the gene expression of the same gene in sample 4 and 6). Finally, a minimal FPKM average across all 14 of less than or equal to 0.5 across was set. In total 8835 genes met our filtering criteria and were further analyzed.
The levels of alternatively spliced isoforms were calculated by the MISO (Mixture-of-Isoforms) probabilistic framework (Katz, Wang et al. 2010). For the purpose of consistency and library quality, the annotated alternative splicing event assembly from the hg18 genome build was used. Each AS event was assigned a PSI (percent-spliced-in) value which represents the percent of the inclusion event as detailed in the MISO manual. I calculated AS events for skipped exons SE, retained introns RI, alternative splice sites, tandem untranslated regions TUTR, and mutually exclusive exons MXE. For cell cycle data, I required that each detected event have a minimum of four supporting reads.
Identification of periodic RNAs and periodic AS
For each expressed gene, I normalized gene expression as follows:
𝑛𝑜𝑟𝑚𝑎𝑙𝑖𝑧𝑒𝑑 (𝑒𝑛𝑖) =
𝑒𝑛𝑖 − 𝐸𝑚𝑖𝑛𝑖 𝐸𝑚𝑎𝑥𝑖
, where i = 1 to 8,835 for all expressed genes; n = 1 to 14 for the14 samples; 𝐸𝑚𝑖𝑛 is the minimum and 𝐸𝑚𝑎𝑥 is the maximum gene expression value among the 14 samples.
To identify periodic genes, normalized gene expression values (i.e. 𝑛𝑜𝑟𝑚𝑎𝑙𝑖𝑧𝑒𝑑 (𝑒𝑛)) for the well-known periodic genes, CCNB1, CCNA2, CCNB2, and CENPE were used as a starting point for the modeling of 7 curves which have periodic
28
and phase shifts. To identify genes that have similar expression across the cell cycle, I calculated the Euclidean Distance 𝐸𝐷 between each ideal seed curve and every detected gene as follows:
𝐸𝐷𝑚,𝑖 = ∑ |𝑛𝑜𝑟𝑚𝑎𝑙𝑖𝑧𝑒𝑑 (𝑒𝑛𝑚) − 𝑛𝑜𝑟𝑚𝑎𝑙𝑖𝑧𝑒𝑑 (𝑒𝑛𝑖)| 14
𝑛=1
, where m = 1 to 7 for all model seed curves, i = 1 to 8,835 for all expressed genes. I ranked genes according increasing order of ED. An arbitrary cutoff of 𝐸𝐷 ≤ 2.5 was used in this study as a minimum requirement to be classified as periodic. A requirement of at least 1.5 fold change between the 𝐸𝑚𝑖𝑛𝑖 and 𝐸𝑚𝑎𝑥𝑖 for gene i was also employed to reflect a significant change in expression across cell cycle.
For identification of periodic AS, a similar approach was employed. PSI values were normalized as follows:
𝑛𝑜𝑟𝑚𝑎𝑙𝑖𝑧𝑒𝑑 (Φ𝑛𝑠) =
Φ𝑛𝑠 − Φ𝑚𝑖𝑛𝑠 Φ𝑚𝑎𝑥𝑠
, where s = 1 to 32,109 for all splicing events; n = 1 to 14 for the14 samples; Φ𝑚𝑖𝑛 is the minimum and Φ𝑚𝑎𝑥 is the maximum PSI value among the 14 samples. Periodicity was calculated utilizing the same periodic seeds and distance metric. For each AS event s, I computed the Euclidean Distance 𝐸𝐷 as follow:
𝐸𝐷𝑚,𝑠 = ∑ |𝑛𝑜𝑟𝑚𝑎𝑙𝑖𝑧𝑒𝑑 (e𝑛𝑚) − 𝑛𝑜𝑟𝑚𝑎𝑙𝑖𝑧𝑒𝑑 (Φ𝑛𝑠)| 14
𝑛=1
, where m = 1 to 7 for all model seed curves, s = 1 to 32,109 for all AS events.
29
Heat maps, hierarchical clustering and Pearson correlation analysis
Heat maps, hierarchical clustering and Pearson correlations were generated using GENE-E (www.broadinstitute.org/cancer/software/GENE-E/). All heat maps shown are
row-normalized for presentation purposes. DAVID
(http://david.abcc.ncifcrf.gov/gene2gene.jsp) was used for all gene ontology enrichments. GO terms shown are for biological process (GOTERM_BP_FAT).
Analysis of enriched motifs
30
exons and introns was carried out 10 times, and the average frequency of each pentanucleotide was used to calculate pentamer enrichment as previously described (Fairbrother, Yeh et al. 2002). The over-represented pentanucleotides (z cutoff 2.5) were aligned with clustalW2 to generated consensus motifs (Fairbrother, Yeh et al. 2002).
Splicing assay with semi-quantitative RT-PCR
Total RNA was purified using the Trizol method (Life Technologies). Purified RNA was treated with 1U of RNAase-free DNAase (Promega) for 1 hour at 37ºC. ~0.5ug of total RNA was used for reverse transcription using random hexamers as primers with a cDNA preparation kit (Applied Biosystem). RT product was used as the template for PCR amplification (25 cycles of amplification, with trace amount of Cy5-dCTP in addition to non-fluorescent dNTPs) using gene specific primers listed in supplementary table S5. DNA was resolved on TAE gels and the resulting gels were scanned with a Typhoon 8600 Imager (GE Healthcare). Images were analyzed with Image Quant 5.2 software (Molecular Dynamics/GE Healthcare). Real time PCR was carried out with SYBR Green kit (Applied Biosystem).
Western blotting
Proteins were extracted in lysis buffer (CHAPS 1% w/v, 150mM NaCl, 50 mM MgCl2 with protease inhibitor), resolved by SDS-PAGE and transferred onto PVDF
31
Chapter IV
Cell culture and inhibitor treatments
To inhibit the activity of CLK1 or proteasome, TG003 (Sigma), KHCB-19 (Tocris) and MG132 (Sigma) were re-suspended in DMSO and added to growing cultures at the indicated concentrations. All drugs were aliquotted into 20uL of 1000X concentrated solutions to prevent freeze thaw cycles.
Western blotting and immunoprecipitation
Proteins were extracted in lysis buffer (CHAPS 1% w/v, 150mM NaCl, 50 mM MgCl2 with protease inhibitor at pH 7.4), resolved by SDS-PAGE and transferred onto
PVDF membranes. For ubiquitin immuprecipitation experiments, cells were co-transfected with Flag-CLK1 and myc-ubiquitin constructs as above. 36 hours later, TG003 (20 μM) was added to culture for 18hrs. 4 hours prior to harvest 10M of MG132 was added to media. Proteins were extracted and clarified in lysis buffer as above with the addition of NEM. Incubation with EZ-View FLAG Beads (Sigma) was performed for 2 hours at 4ºC. Samples were extensively washed according to manufacturer’s protocol and resolved by immunoblot.
Plasmid construction, transfections, RNAi and lentiviral infections
32
was a gift from Dr. Gary Johnson’s lab, and the Histone H2B-GFP expression vector was gift from Dr. Angelique Whitehurst’s lab. Plasmid transfections were performed using Lipofectamine 2000 (Invitrogen) according to the manufacturer’s protocol. The lentiviral shRNA vectors were obtained from Addgene (pLKO.1 TRC mammalian gene knockdown consortium). Lentiviral infections were performed according to Addgene’s protocol (plKO.1) or System Biosciences (pCDH1).
High-throughput RNA sequencing and analysis
RNA was collected from HEK 293T cells treated with 10 M of TG003 for 18 hours. Samples were collected as above and the library was prepared utilizing a strand-specific protocol described in (Ni, Corcoran et al. 2010). Samples were sequenced on Genome Analyzer II (Illumina) with a read length of 75 bp. Mapping and data processing was performed as detailed above.
Colony formation assays
HeLa cells stably carrying shRNAs targeting CLK1 or control shRNAs were plated at low density (1,000 cells/6 cm2)in standard culture medium and allowed to proliferate
for 9 days. Cells were then fixed and stained with crystal violet at room temperature for 15 min. Plates were washed with 1XPBS twice, dried at room temperature and photographed.
Immunofluorescence and high-content live-cell imaging
poly-33
L-Lysine. Cells were then washed twice with 1XPBS, fixed with 4% formaldehyde (Sigma), permeabilized with 0.05% Triton X-100 (Promega) and blocked with 3% BSA (Fisher); all dilutions were made in 1XPBS and filtered. For live cell imaging, a HeLa cell line transduced with Histone H2B-GFP was stably selected as described previously (Cappell, Larson et al. 2010). These cells were plated in a 6-well format and subjected to thymidine 2mM for 24hrs, subsequently washed and released in fresh complete medium with or without TG003 (20uM). Cells were imaged using the BD Pathway Microscope with a 10X objective. Images were captured every 10min and further processed and analyzed using ImageJ Software.
Chapter V
Databases used and data collection
TCGA sequencing results were downloaded from: “Data Matrix - TCGA Data Portal - National Institutes of Health”:
(https://tcga-data.nci.nih.gov/tcga/dataAccessMatrix.htm). mRNA gene expression and somatic mutations data were collected. PAM50 for breast classification was provided by Perou lab. Embryo data was obtained from the supplementary materials provided by Yan et al. (Yan, Yang et al. 2013).
Correlation analysis for inference of cell cycle stage
34
35
III. Transcriptome dynamics during the mitotic cell cycle
Introduction:
The coordination of gene function with specific cell cycle stages enables timely control of molecular events to ensure accurate genome duplication, chromosome segregation and division of daughter cells. Mis-regulation of these processes is the underlying cause for many human diseases, most notably cancer. Conventionally, periodic gene function is thought to be achieved through stage-dependent transcription (Bertoli, Skotheim et al. 2013), protein degradation (Nakayama and Nakayama 2006; Mocciaro and Rape 2012), protein-protein interactions (Satyanarayana and Kaldis 2009) and protein modification.
36
AS is an integral mode of gene regulation that controls key biological process including development and cellular differentiation (Gabut, Samavarchi-Tehrani et al. 2011; Han, Irimia et al. 2013; Xue, Ouyang et al. 2013), raising an important question: is AS is coordinated with cell cycle stages? Previous studies have implied that splicing regulation may be affected by cell cycle. For example, the abundance and phosphorylation of some splicing factors exhibit cell cycle-associated dynamics (Gui, Lane et al. 1994; Lane, Yu et al. 2013) and loss of specific splicing factors was found to induce cell cycle arrest (Ahn, DeKelver et al. 2011; Kurokawa, Akaike et al. 2013). In addition, mitotic arrest induced by AURKA inhibition leads to the activation of pro-apoptotic splicing of Bcl-X and Mcl-1 (Moore, Wang et al. 2010). Furthermore, it is known that splicing is inhibited during mitosis, consistent with the general inactivation of transcription during this cell cycle stage (Shin and Manley 2002). However, the relationship between global coordination of AS and the cell cycle has not been systematically investigated.
37
Results
Sequencing the cell cycle-dependent transcriptome
38
technical replicates per sampling point. Further analysis was performed using Cufflinks, a bioinformatics tool capable of accurately calculating the abundance of transcripts arising from each gene (Trapnell, Williams et al. 2010). FPKM values (fragments per kilobase of transcript per million mapped reads) were used as the expression value for each gene. ~9,000 transcripts met our stringent filtering criteria (see methods) set to discriminated against transcripts with poor consistency across technical replicates or with low expression level.
Identification, function and regulation of periodic genes
39
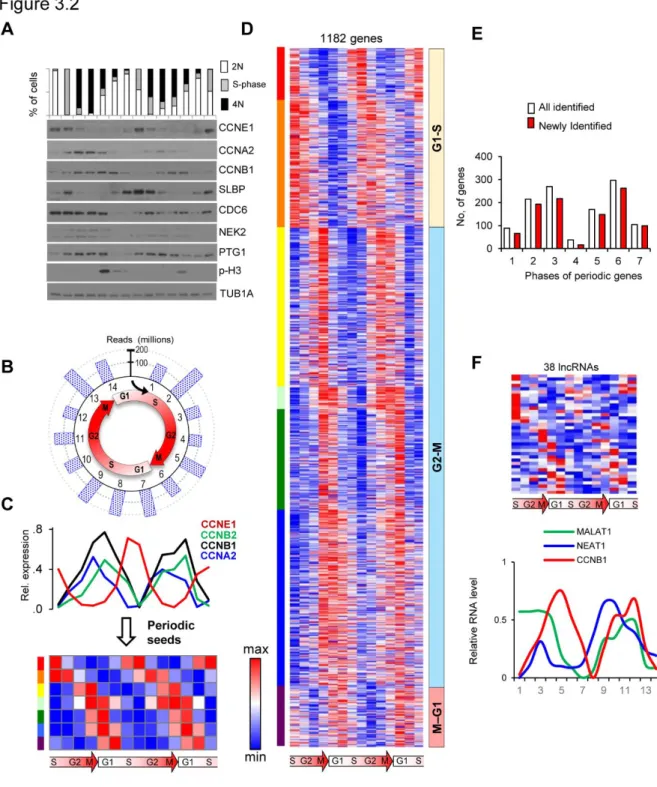
In addition to detecting known protein coding genes, transcriptome profiling by RNA-seq enables the unbiased detection of any RNA harboring a polyadenylated tail. The long non-coding RNAs (lncRNAs) are emerging as class of factors that control development and cell proliferation (Batista and Chang 2013; Yoon, Abdelmohsen et al. 2013). To examine if the expression of lncRNAs is periodic, I mapped our reads to the annotated lncRNA database (see methods). Out of ~400 lncRNAs with sufficient read coverage, 40 were identified as periodically expressed, including the known cell cycle-dependent lncRNA MALAT1 (Tripathi, Shen et al. 2013) (Figure 3.2 F and G). The fact that I captured a previously reported periodic lncRNA indicates the sensitivity of our approach. This analysis strongly suggests that periodic lncRNAs may play previously unappreciated roles in cell cycle regulation.
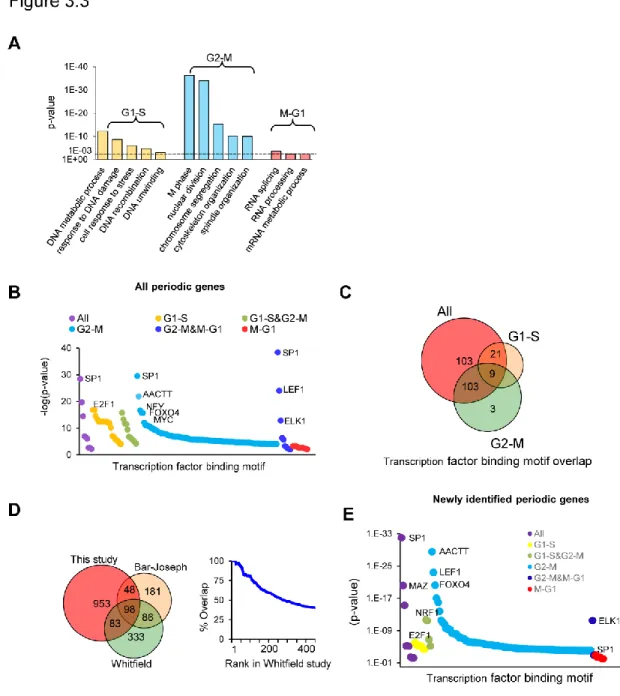
To further investigate the function periodic genes I classified them into three groups (G1-S, G2-M and M-G1) according to their peak expression stage. I first analyzed the concordance between peak expression stage and gene function. As expected, all three groups are enriched ontologies in cell cycle progression, although the specific molecular functions differ (Figure 3.3 A). For example, genes in G1-S group were enriched for functions related to “DNA metabolic process” (p= 6x10-13). Among these
genes are many DNA pre-replication factors, components SCF complex and DNA repair genes. While the G2-M group was highly enriched for the “M phase” ontology (p= 5x10 -37), including genes encoding key mitotic factors like members of the MCC, APC and
40
regulators, suggesting extensive regulation of RNA processing during this stage (Figure 3.3 A).
I next determined putative transcription factors that may control gene expression levels during each of the three expression groups by analyzing the promoters of periodic genes (see methods). As expected, the promoters of the G1-S group contained the binding sites for cell cycle-related transcription factors such as E2F motifs (p= 1.8x10⁻¹⁹).
These data are consistent with the known roles of E2F family members in regulating the G1/S transition. In fact, 18 out of the top 20 motifs identified were related to the E2F family. The top motifs for G2-M genes included binding sites for SP1, NFY, LEF1 and FOXO4 as well as unknown motif (i.e. AACTT). The M-G1 had very modest enrichments, likely due to the small number of genes in this cluster. In total, 164 putative transcription factor-binding motifs were identified. To address whether the different waves of transcription G1-S vs. G2-M may be regulated by a non-overlapping mechanism, I compared the transcription factor binding motifs in each group. A modest overlap of only 9 motifs was observed, suggesting a global difference in transcriptional regulation during these two stages of cell cycle (Figure 3.3 B and C).
41
Consistency across datasets
Hundreds of periodic transcripts have previously been identified using microarrays across different cell types (Whitfield, Sherlock et al. 2002; Bar-Joseph, Siegfried et al. 2008). I sought to investigate the how consistent our periodic gene signature is when other compared to those in other cell types. I first compared our data to another study that also employed HeLa cells and found that our dataset covered ~40% of periodic transcripts previously reported. It is worth noting that our approach captured most of the highest ranking periodic transcripts according to Whitfield et al (80 out of the top 100 periodic genes were captured) (Whitfield, Sherlock et al. 2002). A strong correlation between the rank of periodic score (a measure of how periodic an RNA is) and likelihood of overlap was observed (Figure 3.3D). I next examined the concordance between this study and 4 other independent studies. A striking find was that although roughly 2,500 different transcripts have been classified as periodic, only 67 of these are consistent across all cell lines investigated. Furthermore, these 67 appear to have specialized mitotic functions. This observed variability can be explained by intrinsic differences in cell lines used, techniques applied (i.e. microarray vs. RNA-seq), and culturing conditions.
42
experimental conditions and/or computational analyses rather than by a high false positive rate.
Identification of periodic alternative splicing
43
suggest that periodic splicing presents a novel mechanism for temporal fluctuation of gene function and is mostly regulated independently from transcription.
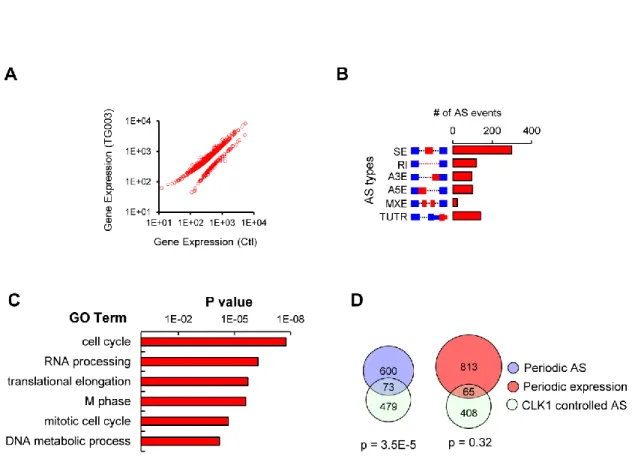
To examine the function of periodically spliced genes, I performed GO analysis and found that these genes are enriched for cell cycle-related functions including M-phase, nuclear division and DNA metabolic process (Figure 3.4 E) This finding indicates that temporal regulation of AS may play a role in the control of cell cycle progression. I further analyzed the transcripts that are periodically spliced (but not periodically expressed) vs. those that showed both periodic expression plus AS, and again found cell cycle-related functions. These results imply that many cell cycle-related genes previously thought to be invariably expressed may in fact function periodically due to the temporal regulation of AS. Using semi-quantitative RT-PCR, I validated a set of periodic AS events with known functions in cell cycle progression (including BORA, AURKB, HMGB2A, CHEK2 and HMG20B), confirming that our approach can reliably identify periodic AS events (Figure
3.4 F)
For genes whose splicing and expression are both periodically regulated, the AS fluctuations and total transcripts fluctuations frequently occurred in different phases. For example, the removal of retained introns in AURKB, a critical mitotic kinase, had a phase shift that lagged behind the total expression level. I corrected the absolute levels of protein coding AURKB mRNA by taking into account the fraction of intron-retaining (non-functional) transcripts across time (Figure 3.5 A). The expression curve for corrected AURKB mRNA was substantially different from the total mRNA levels with a shifted peak
44
control of protein production and fine-tune expression timing of functional transcripts (Figure 3.5 B).
Putative cis-elements and trans-factors that regulate periodic AS
Generally, AS is regulated by multiple cis-acting splicing regulatory elements (SREs) that recruit cognate splicing factors to influence splicing outcomes. To identify specific RNA sequence motifs that might regulate periodic splicing, I computed the frequency of all possible RNA pentanucleotides in periodically spliced transcripts (Fairbrother, Yeh et al. 2002). I identified 14 putative SRE motifs that were statistically enriched near periodic alternative exons or introns compared to a set of control alternative exons and introns with similar expression levels (Figure 3.5 C and D). These motifs were highly variable, suggesting that periodically spliced pre-mRNAs are recognized by various RNA binding proteins (RBPs). In addition, distinct putative SREs were identified in different regions of periodically spliced pre-mRNAs. These data reflect the regulatory complexity of periodic splicing which is likely controlled by multiple RBPs in a context-dependent fashion (Wang and Burge 2008).
45
(Figure 3.5 G), with RNA-splicing being the most significantly enriched pathway (p= 2.4x10⁻¹¹). These initial findings suggest that context-dependent interactions between
cis-elements and trans-factors are involved in the control of periodic splicing. In addition
to computational analyses, I also used experimental approaches to identify putative regulatory factors that control AS during cell cycle. The abundance of various proteins with known splicing regulatory roles was measured in synchronized HeLa cells by immunoblotting. Among the proteins tested, the CDC-like kinase 1 (CLK1, an SR protein kinase) displayed robust cyclic expression peaking at G2/M phase. These observations will be the subject of further investigations in the following chapter.
Discussion
46
G). Since most lncRNAs are expressed at low levels, it is likely that our stringent expression level filter (400 of ~13,000 predicted lncRNAs passed our initial filter) led to a conservative estimate of cycling lncRNAs. These data lead us to speculate that many of these non-coding transcripts may play key roles in cell cycle control, as exemplified by the recently identified periodic lncRNA MALAT1 (Tripathi, Shen et al. 2013).
I uncovered widespread temporal regulation of splicing during cell cycle: greater than 800 AS events are coordinated with cell cycle stage (Figure 3.4). Since AS is largely tissue specific (Wang, Sandberg et al. 2008), it remains an open question whether the AS events identified in this study are generalizable to other tissue and cell types. However, many periodically spliced genes have cell cycle-related functions that have been annotated across many cell types, leading us to speculate that AS is a general regulatory layer of cell cycle control. Temporal regulation of AS can alter the protein-coding potential, as was the case for AURKB where the periodic intron retention introduces a pre-mature stop codon. Therefore AS presents a prevalent mechanism for periodic regulation of protein production independent of total RNA levels. Recent studies have demonstrated that intron removal can rapidly induce protein expression (Ninomiya, Kataoka et al. 2011). One possibility is that while total transcripts are produced constantly across cell cycle, stage-dependent post-transcriptional intron removal enables a more rapid and precise control of protein expression.
47
48
49
50
51
52
motifs are identified using in all 1182 (red), G1-S (blue) and G2-M (green). (D) Venn diagram showing the overlap of periodic genes identified by Whitfield et al, Bar-Joseph et al, and this study (left). Percent overlap ordered by Whitfield rank score (right). (E)
53
54
55
56
57
IV. CLK1 kinase controls cell cycle processes via an alternative splicing network.
Introduction
CLK kinases were originally discovered due to their similarity to CDK1, but have not been implicated in cell cycle regulation (Johnson and Smith 1991). In humans CLK1-mediated SR protein phosphorylation has been shown to regulate the AS of genes that control blood coagulation (TF) (Schwertz, Tolley et al. 2006), insulin signaling (PKCbeta) (Jiang, Patel et al. 2009; Li, Carter et al. 2013), and angiogenesis (VEGFA) (Nowak, Woolard et al. 2008). Recent reports have identified CLK kinases as factors that control viral infection by mechanisms that include AS regulation of viral mRNAs (Yomoda, Muraki et al. 2008; Escudero-Paunetto, Li et al. 2010; Karlas, Machuy et al. 2010; Wong, Balachandran et al. 2011). However, global gene regulation events responsive to CLK activity in human cells are mostly unknown. Furthermore, a general role for CLKs kinases in controlling biological processes, besides isolated AS events, remains undefined.
In D. melanogastor, the CLK homologue darkener of apricot (DOA) was identified in a genome-wide RNAi screen as a protein required for normal cell cycle progression; however these results have not been validated or assessed in mammalian cells. In S. pombe, Kic1 bears similarity to human LAMMER kinases and has been shown to regulate
58
Recent evidence indicates that canonical SR protein phosphorylation can be dynamically regulated in response to osmotic stress, heat shock and genotoxic stress. Importantly, dynamic SR protein phosphorylation elicits rapid signal-dependent changes in AS that control phenotypic outputs such as cell death. Additionally, one study has demonstrated that SR protein phosphorylation is cell cycle stage-dependent with a general increase in canonical SR protein phosphorylation during mitosis.
Here I demonstrate that that CLK1 kinase protein levels fluctuate during the cell cycle and uncover the mechanistic details of CLK1 protein turnover. I profiled the transcriptome in response to CLK activity and found that CLK-regulated genes have functions in processes such as RNA splicing, mitotic cell cycle and DNA damage repair/response. I show that a significant fraction of CLK-responsive genes overlap with those I identified as being periodic expressed and spliced (Chapter III). Furthermore, disruption of CLK1 activity in synchronized cultures leads to AS decisions which are different than those in synchronous cultures with active CLK1. Phenotypically I demonstrate that inhibition or depletion of CLK1 disrupts cell cycle progression marked by pleotropic mitotic defects and cell death. Taken together, these data indicate CLK1 is a master regulator of cell cycle-related AS.
Results
CLK1 is cell cycle regulated
59
cyclic expression with a peak G2/M phase (Figure 4.1 A and B). The levels of CLK2, a highly similar kinase, as well as other SR protein kinases (SRPK1 and SRPK2) did not significantly change in expression during the cell cycle. In addition, no significant change in the total protein levels of various splicing factors was detected across the cell cycle (Figure 4.1 A). However, I were able to reproduce a previous result (Gui, Lane et al. 1994) that showed an increase in the phosphorylation status of SR proteins at the G2/M transition (DD and ZW). These data implicate that CLK1 may be the kinase responsible for SR protein phosphorylation changes during the cell cycle. I speculate that CLK1 may have a specialized role in controlling cell cycle-dependent AS.
CLK1 protein turnover
60
CLK1 was readily detected in immunoprecipitation experiments using extracts from MG132-treated cells (Figure 4.2 F). Altogether these data suggest that CLK1 protein is controlled by ubiquitin-mediated turnover in a cell cycle-dependent manner.
CLK1 is engaged in negative feedback auto-regulatory loop
As discussed above, periodic protein levels are frequently under the control of auto-regulatory feedback loops. CLK1 has been shown to auto-phosphorylate at several residues. During the course of experimentation I observed that inhibition of CLK1 kinase activity with a selective inhibitor, TG003 (Muraki, Ohkawara et al. 2004), robustly stabilized endogenous CLK1 proteins (Figure 4.2 A). This effect can in part be explained by the fact that inhibition of CLK1 kinase activity leads to the production of primarily functional splice variants of CLK1, thereby increasing total CLK1 protein levels. Indeed, I noted a robust shift in the AS of CLK1 to variants that encode the full length protein upon TG003 treatment (as will be discussed below). However, the change in protein levels was so robust and turned over very rapidly after inhibitor washout (data not shown) that it prompted us to speculated that there may be another layer of regulation that accounts for the dramatic increase protein levels.
61
KD) which has been previously shown to abrogate catalytic activity. The activity-dependent de-stabilization was only observed with wild type (WT) CLK1 and not a kinase dead (KD) mutant (Figure 4.2 A). This suggests that the degradation of CLK1 is kinase activity-dependent. I further examined protein stability and found that while the WT CLK1 was rapidly degraded upon cycloheximide treatment, the KD CLK1 was much more stable under identical treatment conditions (Figure 4.2 B). Next I asked if CLK1 activity alone was sufficient to promote its own degradation. To this end, I co-expressed CLK1 KD with increasing amounts of WT CLK1. I expected that CLK1 WT would act in trans to trigger the degradation of the CLK1 KD form. Consistently, I found that increasing amounts of WT CLK1 reduced the levels of KD CLK1 (Figure 4.2 C).
62
CLK1-mediated transcriptome regulation
To date, the global effect of CLK1 activity on gene expression has not been systematically determined. To identify endogenous AS events regulated through the CLK1 pathway, I sequenced total polyadenylated RNA from HEK cells treated with the CLK1 inhibitor (TG003) or solvent control (DMSO). I obtained over 40 million sequencing reads per sample and found 711 genes whose expression level was affected by CLK1, most of which increased their expression level upon CLK1 inhibition (Figure 4.3 A). Importantly, inhibition of CLK1 affected the splicing of 783 AS events (in 584 genes) that covered all major AS types (Figure 4.3 B), reconfirming the functions of CLK1 as a major AS regulator (Duncan, Stojdl et al. 1997; Prasad, Colwill et al. 1999; Jiang, Patel et al. 2009). Additionally, previously known CLK1-regulated splicing events (i.e. exon 4 of CLK1 (Duncan, Stojdl et al. 1997)) were identified as top hits in this dataset, verifying the sensitivity of this analysis.
63
expression and the CLK1-regulated AS events is not significantly different from what is expected by chance (p=0.32, hyper-geometric test), further supporting a role for CLK1 in regulating cell cycle related AS.
I selected individual AS events for validation with RT-PCR and were able to confirm these changes (Figure 4.3 C, 4.4 A and B). To further validate our findings, I over-expressed wild type and kinase dead CLK1 and examined changes of AS in selected targets (Figure 4.4 B). As expected, over-expression of WT CLK1, but not KD CLK1 changed TG003-regulated events in the predicted direction (Figure 4.3 C).
I next applied statistical enrichment to identify sequence motifs enriched near CLK1-regulated exons (Fairbrother, Yeh et al. 2002) and found that exons promoted or inhibited by CLK1 were associated with distinct RNA motifs (Figure 4.4 C), suggesting CLK1 functions through multiple splicing factors with different RNA binding specificities.
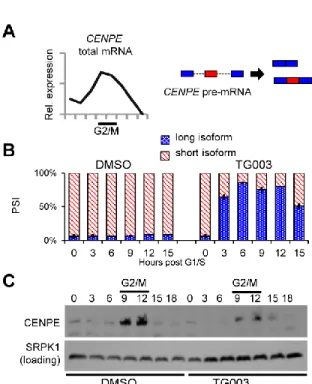
CLK1 controls CENPE alternative splicing
64
substantially shifted CENPE splicing to produce mostly the long isoform (Figure 4.5 A and B). Inhibition of CLK1 also substantially reduced CENPE protein levels during G2/M phase, presumably by controlling CENPE transcript processing (Figure 4.5 C). These data suggest that the dynamic behavior of AS during cell division is in part controlled by CLK1.
CLK1 and SFRS1 regulate CHEK2 AS
Given the enrichment of cell cycle and DNA damage response genes in our RNA-seq data, I further examined another Clk1-regulated AS event. CHEK2 is a key DNA damage-sensing kinase whose activity controls cell cycle progression (Nevanlinna and Bartek 2006; Paronetto, Minana et al. 2011). CHEK2 AS can produce variants lacking kinase activity or that localize differently from canonical CHEK2 protein (Staalesen, Falck et al. 2004). Recently, CHEK2 AS was shown modulate the DNA-damage response in Ewing sarcoma (Paronetto, Minana et al. 2011). Staalsen et al. identified over 50 CHEK2 variants in human breast tumor samples (Staalesen, Falck et al. 2004). Several alternative exons encode the kinase domain of CHEK2 (Staalesen, Falck et al. 2004). For example, exon 9 encodes the amino acids required for ATP binding (Figure 4.6 A). I measured an increase in exon 9 inclusion after depletion or inhibition of CLK1 (Figure 4.6 B). Conversely, over-expression of CLK1 WT, but not CLK1 KD, increased exon9 skipping (Figure 4.6 C). The most probable mechanism by which CLK1 could influence CHEK2 AS is by phosphorylating an SR protein substrate whose target RNA sequence