REDUCING PUBLIC HEALTH RISK DURING DISASTERS: IDENTIFYING SOCIAL VULNERABILITIES
Amy Funk Wolkin
A dissertation submitted to the faculty at the University of North Carolina at Chapel Hill in partial fulfillment of the requirements for the degree of Doctor of Public Health in the Department of Health Policy and Management in the Gillings School of Global Public Health.
Chapel Hill 2013
Approved by:
Sandra B. Greene
Suzanne H. Hobbs
Edward F. Brooks
William Gentry
ABSTRACT
Amy Funk Wolkin: Reducing Public Health Risk during Disasters: Identifying Social Vulnerabilities
(Under the direction of Sandra B. Greene)
All regions of the US experience disasters; many of these disasters are responsible for
negative public health consequences, such as increased morbidity and mortality. Previous
research has demonstrated that populations with higher levels of social vulnerability are more
likely to experience negative consequences to disasters [1, 2]. Social vulnerability is defined as
the characteristics of a person or group in terms of their capacity to anticipate, cope with, resist
and recover from the impact of a discrete and identifiable event in nature or society [1]. Because
the impacts from a disaster are expressed differentially across and within communities,
emergency managers must be aware of the social vulnerabilities within their community to
mitigate risk [3]. The purpose of this study was to understand how emergency managers are
currently identifying social vulnerabilities within their populations.
I used a qualitative research paradigm to understand their approach and to inform a plan
for change. Key informant interviews were conducted with emergency managers and a
follow-up workshop with additional stakeholders was conducted to gain a deeper understanding of the
barriers and facilitators to current approaches. Findings suggest that despite the need to identify
social vulnerabilities, currently emergency managers lacked the awareness of how to and the
technical capacity to adequately identify at-risk populations. Although public health tools have
proposes the development of a guidance document to provide emergency managers with critical
information, strategies, and resources they need to improve their ability to identify at-risk
populations. To institutionalize the approaches outlined in the guidance, new behaviors and
policy should also be introduced. Because vulnerability is an important cross-cutting
preparedness topic it should be addressed by multiple national preparedness frameworks and
should be a required public health preparedness core capability. Through these approaches and
opportunities for change, public health and emergency management can begin to effectively
mitigate vulnerabilities and reduce losses and enhance outcomes for a broader population of
ACKNOWLEDGEMENTS
Although I owe more people a debt of gratitude than I can name here, I would be remiss
if I did not specifically acknowledge a few whose support I could not have done without.
I am grateful to my committee chair, Dr. Sandra Greene, for your steady guidance,
direction and encouragement. To Dr. Michael McGeehin, my friend and mentor, for graciously
adopting me into the field of environmental public health and looking after me for the past 12
years. To my other committee members, Dr. Suzanne Havala Hobbs, Dr. Ned Brooks, and Mr.
William Gentry, I appreciate your support and insightful comments.
To the very wise individuals of DrPH Cohort Seven, you have shaped the lens in which I
see the world. Thank you for being my colleague and becoming my lifelong friend.
To my parents, Barbara and Mark Funk, who have been proud of me since the day I was
born and who have always provided me with unconditional love and unwavering support. To my
sister Mandy and brother Michael, thanks for always being there for me.
To my beautiful children Ethan and Shai Wolkin, thank you for providing me with
endless laughter and love. I hope that I have instilled in you a lifelong desire to learn and the
belief that you can achieve your wildest dreams.
My gratitude to my husband Brent Wolkin cannot truly be expressed in words and can
never be repaid. I absolutely could not have done this without your support. Your humor and
TABLE OF CONTENTS
LIST OF TABLES...ix
LIST OF FIGURES...x
LIST OF ABBREVIATIONS...xi
STUDY OBJECTIVES AND AIMS ... ...1
Proposal Contribution and Significance ... 3
CHAPTER 1: INTRODUCTION ... 4
Statement of Issue ... 4
Significance ... 5
Background ... 6
Conceptual Framework... 10
Research Question ... 12
CHAPTER 2: LITERATURE REVIEW ... 13
Definitions ... 14
Methods ... 15
Sources ... 15
Search Strategy ... 15
Selection Criteria ... 16
Results ... 17
Discussion ... 26
Findings ... 26
Implications ... 27
Directions for Future Research ... 28
Limitations ... 29
Conclusions—Aim 1 ... 30
CHAPTER 3: METHODS ... 32
Data Collection and Data Sources ... 32
Limitations ... 35
Institutional Review Board and Confidentiality Issues ... 35
CHAPTER 4: RESULTS ... 37
Description of in-depth interview participants ... 37
Definitions of at-risk populations ... 37
Identification of at-risk populations ... 38
Registries ... 38
Partnerships ... 39
Frequency of updates ... 40
Tools or processes used by emergency managers ... 41
Future use of tools ... 41
Facilitators needed to identify at-risk populations ... 44
How at-risk data is used... 45
Additional themes ... 46
Responsibility ... 47
Improve communications ... 48
Conclusions—Aim 2 ... 48
CHAPTER 5: PLAN FOR CHANGE ... 50
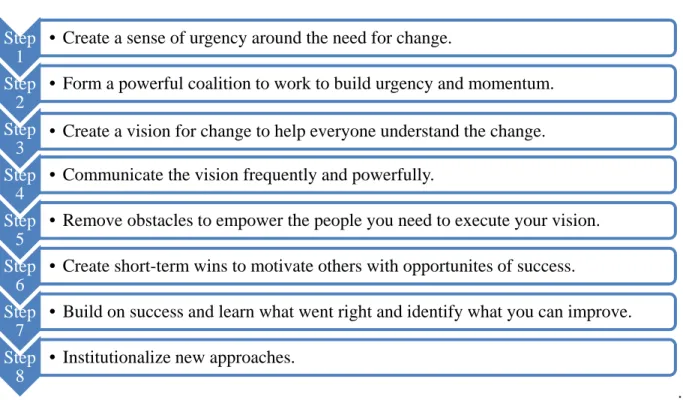
Leadership Principles ... 50
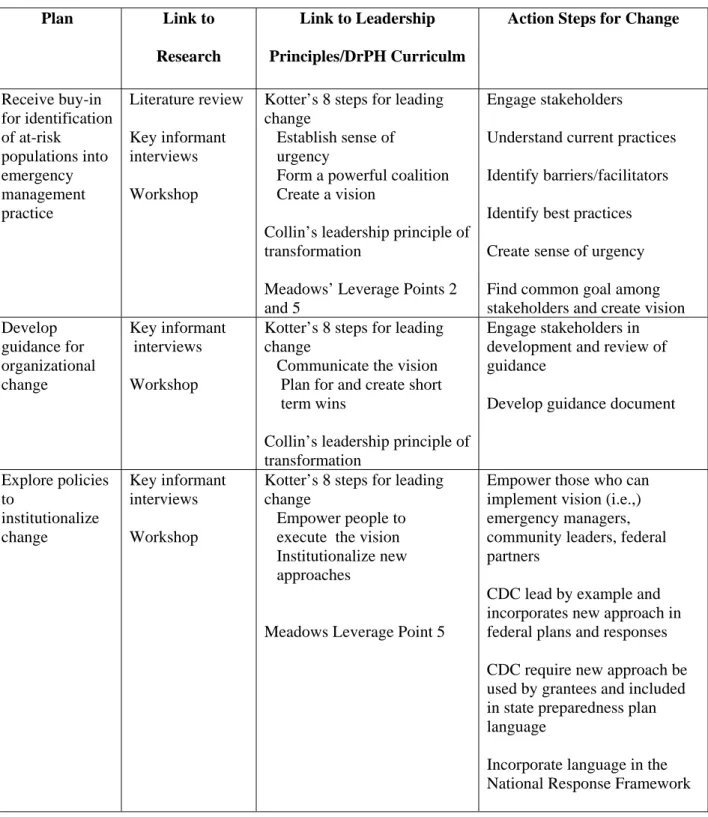
Action Steps ... 53
Receive buy-in to support integration of social vulnerabilities into emergency management practice ... 53
Develop guidance for organizational change ... 54
Integration of data ... 56
Explore policy development to institutionalize change ... 57
Conclusions—Aim 3 ... 60
APPENDIX A. PARTICIPANT RECRUITMENT LETTER/ E-MAIL ... 61
APPENDIX B. INTERVIEW GUIDE ... 63
APPENDIX C. KEY INFORMANT INTERVIEW CODEBOOK ... 67
APPENDIX D. WORKSHOP AGENDA ... 69
LIST OF TABLES
Table
1. Concepts, MeSH terms, and key words used for systematic review...13
2. Summary of articles assessing application of social vulnerability (SV) assessments (n=15)...18
3. Ten most common concepts included in the 15 social vulnerability assessments...21
4. Region and jurisdiction size of key informant interviewees…...30
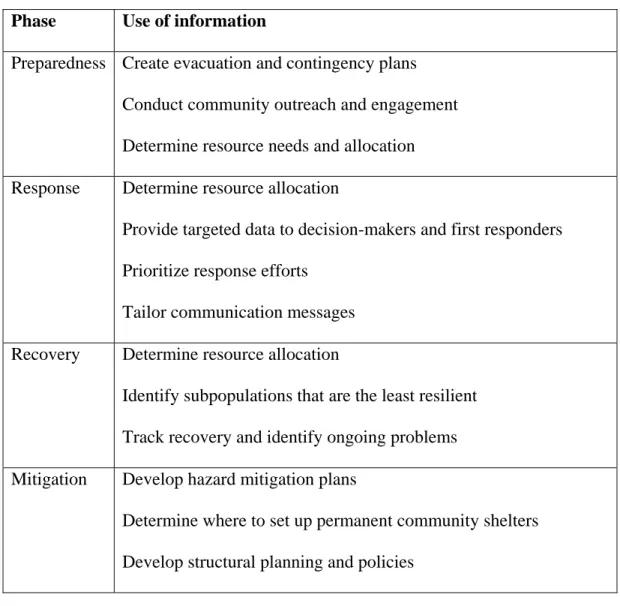
5. Use of information on at-risk populations...45
LIST OF FIGURES
Figure
1. The disaster cycle...7
2. Conceptual framework...9
3. Article selection process for the systematic literature review...15
LIST OF ABBREVIATIONS
ATSDR Agency for Toxic Substances and Disease Registry
CDC Centers for Disease Control and Prevention
COIN Community Outreach Information Network
EOC Emergency Operation Center
FEMA Federal Emergency Management Administration
GIS Geographical Information Systems
GRASP Geospatial Research, Analysis & Services Program
HVS Hazard Vulnerability Score
IRB Institutional Review Board
OMB Office of Management and Budget
PAHPA Pandemic and All Hazards Preparedness Act
SES Socioeconomic status
SoVI Social Vulnerability Index (Susan Cutter)
SVI Social Vulnerability Index (CDC/ ATSDR)
UNC University of North Carolina
STUDY OBJECTIVE AND AIMS
The frequency and magnitude of natural disasters is rising in the US. With climate
change, this trend is expected to continue [4]. All regions of the US experience disasters; many
of these disasters are responsible for negative public health consequences, such as increased
morbidity and mortality. Previous research has demonstrated that socially vulnerable populations
are more likely to be adversely affected in disasters [1, 2]. Social vulnerability is defined as the
characteristics of a person or group in terms of their capacity to anticipate, cope with, resist and
recover from the impact of a discrete and identifiable event in nature or society [1]. The term
socially vulnerable is interchangeable with at-risk and is compatible with the National Response Framework definition of special needs populations [5]. Researchers have developed approaches and specific tools designed to assist emergency managers in identifying social vulnerabilities
within populations [6-8]. These approaches and tools enable communities to identify geographic
areas with higher levels of social vulnerabilities. Identifying social vulnerabilities is the first step
in developing mitigation and prevention strategies that address these populations [6].
The purpose of this study was to understand how emergency managers are identifying
social vulnerabilities within their populations. I used a qualitative research paradigm to
understand their current approach and to inform a plan for change to address barriers to
sub-questions: What approaches, if any, are emergency managers using to identify at-risk
populations within their jurisdiction?
o What tools or processes do emergency managers use to identify at-risk
populations?
o What are the barriers to identifying socially vulnerable populations?
o What would facilitate the identification of these populations for emergency
managers?
To explore these questions, the research examined three aims.
Aim 1: To determine the extent to which social vulnerability tools are used in disaster research. A systematic literature review was conducted to determine recent applications of tools used to identify social vulnerabilities. The literature review also determined how the information
about social vulnerabilities is used in disaster research and response.
Aim 2. To identify current approaches, if any, used by emergency managers to identify social vulnerabilities within their community. I conducted key informant interviews with nine emergency managers to determine if and how emergency managers currently identify at-risk
populations within their jurisdiction. During the interviews, I identified approaches and tools
emergency managers were currently using, the frequency of updating information on at-risk
populations, and barriers and facilitators. I also conducted a follow-up workshop with additional
stakeholders to gain a deeper understanding of current approaches. The results from the
interviews and the workshop were used to address Aim 2.
mitigating disaster-related risks for at-risk populations. The goal of Aim 3 is to propose a
strategy to improve current approaches. Although this research does not address the underlying
causes of social vulnerabilities, the research can be used to inform mitigation strategies for
reducing risk among those with social vulnerabilities. I used the literature review, key informant
interviews, workshop results, and leadership principles and frameworks to develop a plan for
change.
Proposal Contribution and Significance
The findings from this research have the potential to improve the public’s health. Being able to
identify socially vulnerable segments of the population can enable emergency managers to focus
mitigation and planning efforts, rather than take a broad-brush, one-size-fits-all approach that
CHAPTER 1: INTRODUCTION
Statement of Issue
According to the Federal Emergency Management Administration (FEMA), in 2011
there were 99 Presidentially Declared Major Disasters, an increase from 45 declared major
disasters in 2000 [9]. With the increase in precipitation and rising seas associated with climate
change, this trend is expected to continue [4]. Most natural disasters have major public health
consequences. Hurricane Katrina, for example, resulted in more than 1,800 deaths and at least
7,500 injuries and illnesses and destroyed most of the areas’ health and public health
infrastructure [10].
Socially vulnerable segments of communities are at particular risk for negative health
effects from disasters and are disproportionately affected by disasters [1]. Within communities
there is a heterogeneous spread of social characteristics that produces unequal exposure to
disaster risks, making some people more prone to disaster-related morbidity and mortality.
During the past few decades, researchers have discovered that a person’s vulnerability to
disasters is essentially a social and community construct [2]. The conditions and social factors
that limit a person’s everyday abilities to cope with daily life also make them vulnerable to the
effects of disasters [1]. Previous research has demonstrated that socially vulnerable populations
implementation of mitigation strategies should focus on the vulnerable segments of the
population to reduce the public health impact of disasters [12].
Significance
Although there is strong evidence that vulnerable population groups are at greater risk
during a disaster, few emergency preparations focus on at-risk population groups and their
special needs in emergencies [13]. These social vulnerable populations, also referred to as at-risk
groups and special needs populations, require special considerations. By knowing vulnerabilities
within a community, emergency managers can better design and implement community-based
efforts to mitigate and prepare for disasters [12]. For example, if emergency managers know
social vulnerabilities a priori, they can plan more efficient evacuations for people who need transportation or special assistance, such as those without a vehicle.
The devastation following Hurricane Katrina raised serious public policy issues in
disaster management, prompting a Congressional investigation [14]. The Hurricane Katrina
Congressional Investigation committee reported that “many of the problems we have identified
can be categorized as ‘information gaps’...Better information would have been an optimal
weapon against Katrina. Information sent to the right people at the right place at the right time.”
The committee also concluded that “issues of race and class were central” to the disaster’s
consequences [14]. Emergency managers can better anticipate the needs of their communities by
knowing the types of vulnerabilities in their community and providing this information to the
Background
Disaster management is the set of strategic management processes used to reduce the
impact of disasters on people and property [12]. For most of the twentieth century, disaster
management attributed disaster-related morbidity and mortality solely to the physical aspects of
the disaster (e.g., hurricane winds, flood waters). The dominant view was that disaster-related
morbidity and mortality were caused by people being in the wrong place at the wrong time [1,
15, 16]. Those who believed in this fatalistic view perceived that there was little one could do to
prevent the occurrence, and consequently the effects, of disasters. More recently, disaster
research has recognized that the interaction of a wide range of physical (i.e., meteorological,
environmental, technological) and social factors threaten society during a disaster. Disaster
management uses the following formula to estimate the risk of health, social, and economic
consequences of a disaster:
Risk= Hazard*Vulnerability,
where risk is the likelihood of a specific disaster event occurring and its probable consequences (i.e., impact on people and property); hazard is the potential threat to humans and their welfare; and vulnerability ischaracteristics of a person or group and their situation that influences their capacity to anticipate, cope with, resist, and recover from a hazard [6, 7]. Previously, disaster
management excluded the influence of social vulnerabilities on risk; however, social
vulnerabilities should be included in the risk equation [8].
Social vulnerabilities arise from differences in social conditions and are rooted in at least
six broad categories: socioeconomic status, race and ethnicity, age, gender, disability, and
English language proficiency. Socioeconomic status (SES) is one of the largest categories of
the US the poorest people living in the poorest conditions are the most vulnerable [12].Those
with lower socioeconomic status are more likely to have problems related to the crowding, poor
housing structures, lack of home ownership, and lack of access to resources [19]. The poor also
spend a greater percent of income on housing, which limits their money available for other
necessities. During Hurricane Katrina, many of the poor were displaced and sheltered significant
distances from New Orleans impairing access to their social networks. Social networks are an
important aspect of recovery, particularly among the poor who depend on social networks for
child care, food transportation, and support [19].
Race and ethnicity also contribute to social vulnerabilities [8, 17, 20]. It is not necessarily
race and ethnicity that create the increased risk to disasters; rather it is how race and ethnicity are
interpreted by society and the structures that surround race and ethnicity that relate to
vulnerability [19]. Race and ethnicity are intrinsically tied to issues of SES. During Hurricane
Katrina more than half of poor blacks did not have transportation to evacuate compared to 17%
of poor whites [19]. Without transportation many blacks sheltered in the Superdome and
comprised the majority of the 30,000 people evacuated to the Superdome [19]. Follow-up studies
found that black male residents had a higher mortality rate than whites relative to their
population distribution [7, 21]. Race and ethnicity also play a role in recovery. Some areas of
New Orleans, such as the French Quarter, recovered quickly after Hurricane Katrina, whereas
the predominantly poor black neighborhoods continue to struggle [19].
Age is another social vulnerability. The elderly are more likely to have co-morbidities,
less mobility, and greater dependencies (e.g., medication, supplemental oxygen) that increase
their risk to hazards. Further, many elderly have physical or cognitive disabilities that prevent
protective behaviors [8, 22, 23]. Many elderly are also poor which may prevent them from
engaging in protective behaviors. For example, the majority of fatalities in New Orleans
following Hurricane Katrina were elderly people over age 75 years, despite the fact that only 6%
of the pre-hurricane population was older than 75 years of age [7, 21]. The elderly are also more
difficult to reach with communication messaging and warnings due to their isolated living
situations and because they are less likely to use advanced communication technologies, such as
email, social media, texting and automatic telephone alert notifications [19]. Additionally, most
elderly people live at home (90%); however, many evacuation plans for the elderly are geared
towards nursing homes and other assisting living facilities [19]. On the other end of the age
spectrum, young children are more susceptible to injury and disease due to greater sensitivity to
poor hygiene conditions, lack of safe water, and lack of access to proper diet (e.g., breast milk,
baby food) [24] .
Gender is also an important component of social vulnerability. Gender does not
necessarily indicate vulnerability or disadvantage; however, gender can intersect with social
patterns and inequalities can arise from gender differences [19]. During a disaster, females may
be more vulnerable due to differences in employment, lower income, and family responsibilities
[8]. However, females also have capacities that may mitigate risk, such as being a stronger
influence in mobilizing a response to a warning. Females are more likely to be strong risk
communicators in their capacity as active participants in the community and may be more
knowledgeable of “neighborhood information” that can assist emergency managers [19]. While
most families evacuate together, it is not uncommon for males to stay back to guard the property
or continue working as the family provider. Men are also likely to be risk-takers and may not
die as women in the same age group. This finding has been related to “the gender of isolation”
reflecting norms of isolation and independence that result in less social and familial ties [19].
During the Chicago heat wave, those who did not leave home daily were 6.7 times more likely to
die and those who lived alone were 2.3 times more likely to die in the heat wave [25].
Disability is another social vulnerability that impacts risk. The American with Disabilities
Act of 1990 (ADA) defines disability as physical, sensory, or cognitive. This category also
includes special needs populations (i.e., function-based needs irrespective of diagnosis or status)
and persons with medical conditions (e.g., cancer). For many with disabilities, the ability to
respond to a warning is impaired. Further, people with mobility impairments may not be able to
move independently or require special vehicles for transportation. Continuity of care is also
important as it can be difficult for those with disabilities to separate from their caregivers or
treatment (e.g., medication). During the Chicago 1995 heat wave, those were confined to bed
were at increased risk for death (odds ratio=5.5) and those who were unable to care for
themselves were also at increased risk of death (odds ratio= 4.1) [25].
Limited English language proficiency is another component of social vulnerability. The
number of people in the US who do not speak English or speak English as a second language is
increasing. In the US, at least 18% of those older than 5 years of age speak a language other than
English at home [19]. If warnings are not understood or are culturally insensitive, then they are
not received. While some emergency managers are making efforts to translate warning messages,
most translate only to Spanish despite the prevalence of diverse migrant populations in the US
[19]. Additionally, foreign-born residents are likely to cluster in urban and coastal regions prone
demonstrated that the nation’s basic and critical human services delivery systems had no
infrastructure for meeting the linguistic and cultural needs of many Americans [26]. Prior to
Hurricane Katrina, Louisiana was home to over 50,000 Asian Americans, of which more than
half were Vietnamese [26]. The report documents that prior to Katrina, there were no health or
mental health service provider agencies with Asian language services in the Gulf States of
Louisiana, Alabama and Mississippi. This resulted in many unmet health and mental health
needs for Asian Americans in the communities affected by Hurricane Katrina [26]. Language
proficiency also ties in with other social vulnerabilities; those with language barriers tend to have
less political power and less access to public services [8, 19].
Conceptual Framework
Disasters are often thought of as a cycle (Figure 1). The four phases of the disaster cycle
are preparedness, response, recovery and mitigation [12, 27].The preparedness phase takes the
form of plans designed to save lives and to minimize damage when a disaster occurs. The
Figure 1. The disaster cycle.
response phase is defined as the actions taken to save lives and prevent further damage in a
disaster [28]. The recovery phase includes the actions taken to return the community to normal
sustained action or policies that reduce or eliminate risk to people and property from disasters
[28]. The conceptual framework in Figure 2 depicts the influence of social vulnerabilities on
each phase of the disaster cycle and its intersection with the disaster risk equation. Risk
represents the intersection between hazard and vulnerability and vulnerability includes both physical and social vulnerabilities. Knowledge of social vulnerabilities can diminish risk during
each disaster phase. During the preparedness phase, emergency managers need to know which
groups are less likely to prepare for disasters and which groups are least likely to have critical
response items available (e.g., first aid kits, bottled water) [12]. During the response phase,
emergency managers need to know which groups are least likely to hear, understand and react to
warnings, which groups will have greatest difficulty following evacuation orders, which groups
will need emergency medical care or continuation of medical care, and which groups are least
likely to have access to emergency services. During the recovery phase, emergency managers
need to know which groups are most likely to have suffered a debilitating impact, experienced
problems with economic or emotional recovery, or have altered social factors requiring
additional resources. During mitigation, policies can ensure emergency managers are aware of
the social vulnerabilities in their community and require that resources are made available to
Figure 2. Conceptual framework
Research Question
The objective of this research is to answer the following question and sub-questions:
What approaches, if any, are emergency managers using to identify at-risk populations within
their jurisdiction?
o What tools or processes do emergency managers use to identify at-risk
populations?
o What are the barriers to identifying socially vulnerable populations?
o What would facilitate the identification of these populations for emergency
CHAPTER 2: LITERATURE REVIEW
In 2006, the Pandemic and All Hazards Preparedness Act (PAHPA) was enacted and
singled out preparedness as an essential public health capability requiring state and local health
departments to implement disaster plans. PAHPA required the disaster plans “to integrate the
needs of at-risk individuals on all levels of emergency planning, ensuring the effective
incorporation of at-risk populations into existing and future policy, planning, and programmatic
documents” [29].
To assist emergency managers in identifying social vulnerabilities, researchers have
developed approaches and tools to quantify and geographically visualize social vulnerabilities
within populations [13]. Susan Cutter’s Social Vulnerability Index (SoVI) was one of the first
tools developed to assist with the identification and visualization of social vulnerabilities. The
SoVI is based on 42 US census variables and examines social vulnerabilities at the county level,
such as socioeconomic status, gender, occupation, family structure, and education [6]. The SoVI
is an operational index for empirically determining social vulnerability. Despite the requirement
to integrate the needs of at-risk populations and the availability of tools to assess social
vulnerabilities, it is unclear if emergency managers are identifying social vulnerabilities. This
literature review will answer the following question:
How are social vulnerabilities identified and to what extent are social vulnerability
The objectives of this systematic literature review were the following: 1) describe recent
applications of social vulnerability assessments in relation to disaster research; 2) identify which
social vulnerabilities indices (or similar assessments/metrics) are being used, and 3) present
lessons learned on applying social vulnerabilities indices to disaster research.
Definitions
Disaster- a serious disruption of the functioning of society, causing widespread human, material or environmental losses, that exceeds the local capacity to respond, and calls for external
assistance.
Disaster plan- The ongoing plan maintained by various jurisdictional levels for responding to a wide variety of potential hazards. Also referred to as “emergency” or “all-hazards” plan.
Disaster management- strategic management processes used to protect communities from negative consequences of disasters.
Emergency manager- the person who has the day-to-day responsibility for coordinating all aspects of a jurisdiction’s emergency management program and activities.
Social vulnerability-the characteristics of a person or group in terms of their capacity to anticipate, cope with, resist and recover from the impact of a discrete and identifiable event in
nature or society.
Social vulnerability assessment- a quantitative and/or qualitative analysis used to identify socially vulnerable populations, to more completely understand the risk of hazards to these
populations, and to aid in mitigating, preparing for, responding to, and recovering from that risk.
resources offered in disaster preparedness, relief, and recovery. Also referred to as at-risk
populations.
Methods
This purpose of this literature review was to aggregate and analyze articles on the
application of social vulnerability tools used in disaster research. This literature review will
guide additional research on the identification of social vulnerabilities for disaster planning, as
well as identify current and/or best practices, gaps, and barriers to applying social vulnerability
assessments to disaster research. A broad search was conducted to identify published articles on
this topic. This literature review included published case studies, review articles, and
preparedness reports from credible US federal, state, and local government, academic and private
sector sources.
Sources
A systematic review was performed using PubMed and Google Scholar. PubMed
captured all published articles that had a health component on this topic and Google Scholar
captured relevant articles that were not published in a medical journal. I limited my Google
Scholar review to the first 100 articles returned. Bibliographies of relevant articles and reports
were searched to identify additional research not found through the searches.
Search Strategy
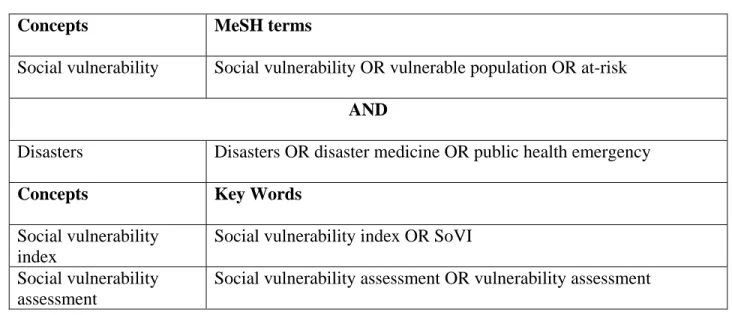
The PubMed search strategy reflected the concepts and MeSH search terms included in
Table 1. Concepts, MeSH terms, and key words used for systematic review
Concepts MeSH terms
Social vulnerability Social vulnerability OR vulnerable population OR at-risk
AND
Disasters Disasters OR disaster medicine OR public health emergency
Concepts Key Words
Social vulnerability index
Social vulnerability index OR SoVI
Social vulnerability assessment
Social vulnerability assessment OR vulnerability assessment
Selection Criteria
Four inclusion criteria were used for this review. First, the article had to be published in
English and refer to social vulnerabilities and natural disaster research within the US. Because
the construction of indices typically used in the US is dependent upon the US Census, indices are
not replicable outside of the US. Second, the article had to describe the application of social
vulnerabilities to research or response work. Third, the article had to be from the past ten years
(2002-present). Fourth, the articles were limited to the application of social vulnerabilities
assessments for natural or man-made disaster scenarios (as defined previously).
Articles were excluded for any of the following reasons: 1) the article focused solely on
hazard vulnerability assessments (which include only hazards to the physical environment and
excludes social vulnerabilities), 2) the article described a social vulnerability index or framework
without including an application of the data, 3) the article solely described an application
because social vulnerability indices are based on the Hazards of Place models which
conceptualize the inputs to social vulnerability within the broader physical hazards paradigms
and are not applicable to infectious diseases [6]. Further, this review did not include individual
state or local emergency plans.
The titles and abstracts or summaries (when available) of each paper identified through
PubMed and Google Scholar were first screened for relevance and to determine if they meet
selection criteria. If the abstract met the criteria, then the entire article was examined for content
relevant to the research question.
Review Strategy
I recorded all relevant articles in an Excel database. I tracked the relevant studies and
included the title, brief abstract (if available), journal, date, authors and their affiliations, article
objectives, application location (e.g., southern coastal communities, Los Angeles), geographic
context (i.e., regional, state, local), disaster type assessed (e.g., hurricane, earthquake), method
for conducting social vulnerability assessment, specific social vulnerability index or framework
utilized, data source, and lessons learned, including results, limitations, and successes. Further, I
noted common themes and identified gaps in the application of social vulnerability indices in
relation to disaster research.
Results
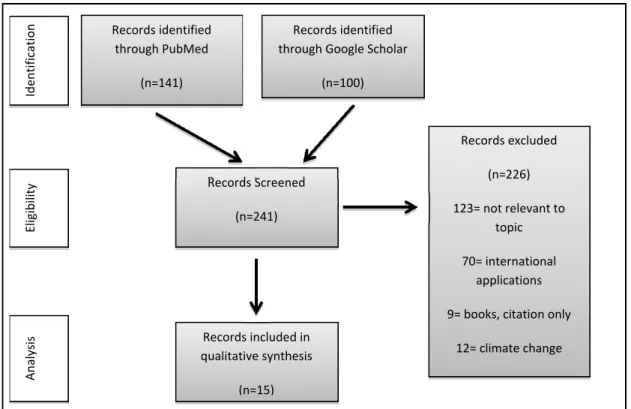
Figure 3 describes the study selection process for the systematic review. The PubMed search
Figure 3. Article selection process for the systematic literature review
articles were first reviewed by reading the title and abstract (when available). If necessary, the
complete article was reviewed to determine selection status. The majority of the articles were
excluded from this review because they were not relevant to the topic (n=123). Many articles
were also excluded because the work was not domestic (n=70). Fifteen articles met the selection
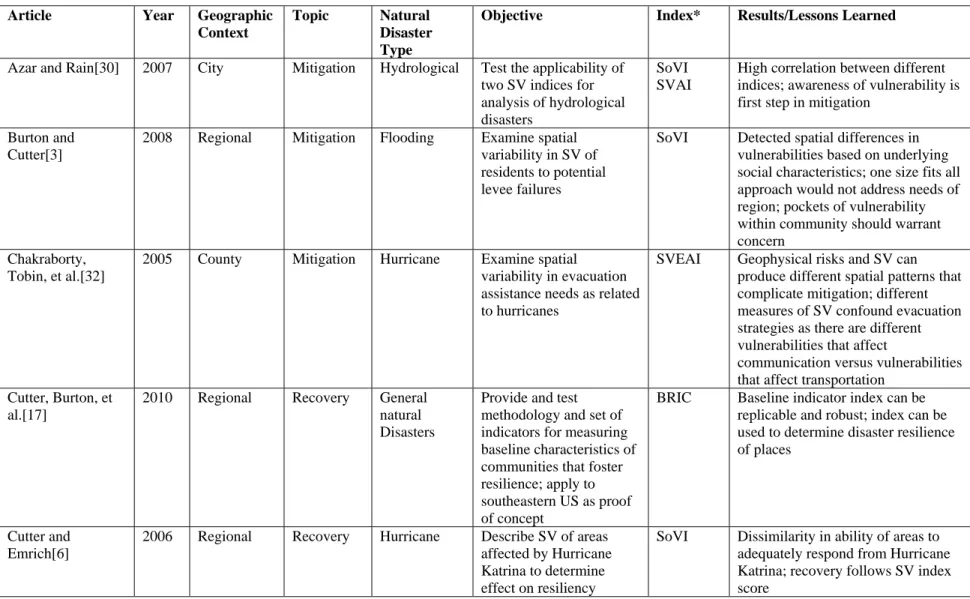
criteria; the majority of articles were captured in Google Scholar. Table 2 describes a summary
of the articles. The majority of the authors were academics; 40% (n=6) were from the University
of South Carolina’s Hazard and Vulnerability Research Institute. Only five articles were
co-authored by non-academics, including four from government agencies. Most articles focused on
a specific natural disaster type, with hurricanes (n=4) being the most common disaster type
addressed. The assessments were conducted for jurisdictions all over the country; the type of
mitigation (n=10) and recovery (n=5). The articles on mitigation examined spatial variability of
social vulnerabilities to potential disaster impacts, test the application of specific indices to
disasters, or overlay social vulnerability scores with physical hazard scores to determine the
geographic distribution of vulnerabilities. Articles focusing on recovery assessed the relationship
between social vulnerability and recovery patterns, migration, economic losses, or resiliency.
Seven different indices were used to assess social vulnerability. Most authors used
Cutter’s SoVI (n=10) or slight modifications of Cutter’s SoVI. Because many of the indices were
based on the SoVI, the social vulnerability concepts and variables used to construct the indices
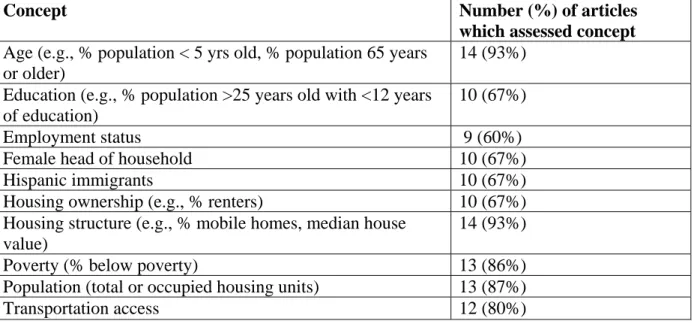
were similar. Table 3 lists the 10 most common variable concepts used in the 15 assessments.
Although Cutter’s original SoVI recommends a set of 42 variables, some researchers chose a
subset of these variables appropriate for the areas they were assessing and most researchers
eliminated variables due to multicollinearity. Most of the articles did not include the concepts of
disability (20%) and English language competency (27%). Most of the articles used social
vulnerability data from the US Census. Other data sources included GeoLytics Neighborhood
Change Database, FEMA HAZMUS, and the National Atlas.
Several themes emerged from the 15 articles included in this analysis, including: 1) the
general role of social vulnerability and its impact on disaster risk; 2) the utility of social
vulnerability assessments; and 3) limitations and gaps of current social vulnerability assessments.
The most prominent theme discussed in these articles was the general study of social
vulnerability and its impact on disaster risk. The majority of articles state that populations are
differentially affected by disasters due to three factors: 1) physical and geographic landscape in
which people live, 2) physical risks to which they are exposed, and 3) underlying social
“based on the characteristics of the communities,” as well as the physical risk of disasters [3].
Many of the articles concluded that geographic discrepancies in social vulnerability necessitate
different mitigation and recovery actions. Specifically, Cutter and Emrich state that a “one-size
fits all approach to preparedness, response, recovery, and mitigation may be the least effective in
reducing vulnerability or improving local resilience to hazards” [6]. Azar and Rain made similar
conclusions stating that “awareness of vulnerability is the first step toward action by any
interested individual or party” [30].
The majority of authors concluded that the social vulnerability indices are useful tools for
mitigation and recovery activities and suggested that the tools would also be useful for
preparedness and response activities. The information provided by the indices allow disaster
planners to identify pockets of vulnerability, make quick comparisons across and within
communities, and determine geographical areas where improvements in mitigation plans and
recovery actions should occur. For example, Meyers et al. concluded that the social vulnerability
index “provides an important diagnostic tool for policymakers interested in identifying the
factors that place communities at differential risk to disaster and that influence response and
recovery efforts in their aftermath”[31]. Chakraborty et al. cited that the index “combines
physical and social vulnerabilities to create a picture of the country’s present overall
Article Year Geographic Context
Topic Natural Disaster Type
Objective Index* Results/Lessons Learned
Azar and Rain[30] 2007 City Mitigation Hydrological Test the applicability of two SV indices for analysis of hydrological disasters
SoVI SVAI
High correlation between different indices; awareness of vulnerability is first step in mitigation
Burton and Cutter[3]
2008 Regional Mitigation Flooding Examine spatial variability in SV of residents to potential levee failures
SoVI Detected spatial differences in vulnerabilities based on underlying social characteristics; one size fits all approach would not address needs of region; pockets of vulnerability within community should warrant concern
Chakraborty, Tobin, et al.[32]
2005 County Mitigation Hurricane Examine spatial variability in evacuation assistance needs as related to hurricanes
SVEAI Geophysical risks and SV can produce different spatial patterns that complicate mitigation; different measures of SV confound evacuation strategies as there are different vulnerabilities that affect
communication versus vulnerabilities that affect transportation
Cutter, Burton, et al.[17]
2010 Regional Recovery General natural Disasters
Provide and test methodology and set of indicators for measuring baseline characteristics of communities that foster resilience; apply to southeastern US as proof of concept
BRIC Baseline indicator index can be replicable and robust; index can be used to determine disaster resilience of places
Cutter and Emrich[6]
2006 Regional Recovery Hurricane Describe SV of areas affected by Hurricane Katrina to determine effect on resiliency
SoVI Dissimilarity in ability of areas to adequately respond from Hurricane Katrina; recovery follows SV index score
Table 2. Summary of articles assessing application of social vulnerability (SV) assessments (n=15)
21
Finch, Emrich, et al.[33]
2010 City Recovery Hurricanes Use index to measure how SV affects the geography of recovery in New Orleans from Hurricane Katrina
SoVI SV was an important indicator for recovery, but not as important as flood height; communities with higher SV scores have slower recovery rates
Gaither, Poudyal, et al.[34]
2011 Regional Mitigation Wildfires Address wildfire risk and its intersection with SV
SoVUP SV populations have longer distances to wildland fire mitigation programs than areas with low SV; useful to use SV index to explore relationship between social status and wildland fire risk
Kleinosky, Yarnal, et al.[35]
2007 Regional Mitigation Flooding Assess overall vulnerability to flooding by multiplying flood risk scores with SV scores
SoVI Areas likely to experience storm-surge flood same areas where most SV populations lives
Myers, Slack, et al.[31]
2008 Regional Recovery Hurricanes Assess relationship between SV and
migration after hurricanes
SoVI Places with greater proportion of disadvantaged populations, housing damage, and densely built
environment more likely to have outmigration after hurricane; SV index useful as diagnostic tool for policy makers to consider both biophysical and social characteristics Peacock, Grover, et
al.[27]
2011 Regional Mitigation Hurricanes Identify and test methods to target areas with natural disaster risks due to both physical and SV
SV index Determined Cutter’s SoVI not conducive for community-based planning and developed new approach for disaster planners to effectively identify areas within their communities which have high levels of SV that will affect resiliency Schmidtlein,
Deutsch, et al.[36]
2008 City Mitigation General natural disasters
Conduct sensitivity analysis of SoVI to address changes in index construction, scale at which applied, set of variables used, and various geographic contexts
SoVI Subset of indicators produced similar findings to full set; index robust for minor changes in scale; index was sensitive to construction and required local expert knowledge to correctly apply
Schmidtlein, 2011 City Recovery Earthquake Examine spatial linkage SoVI In each model, the physical event
22
*SoVI=Cutter’s Social Vulnerability Index; SVAI=Social Vulnerability Averaged Index; SVEAI=Social Vulnerability for Evacuation Assistance; BRIC=Baseline Resilience Indicators for Communities; SoVUP=Social Vulnerability Index (developed by Gaither et al.[34]); SV index= Social Vulnerability Index (developed by Peacock et al.[27]); HVS=Hazard Vulnerability Score
Shafer, et al.[37] between SV and
estimated earthquake losses for differing magnitudes
parameters were more important than SV measures; there was a
relationship between earthquake losses and SV; SV index can be used to predict relative losses
Simpson, Deutsch, et al.[38]
2008 State Mitigation General natural disasters
Identify and test method for Kentucky to conduct vulnerability assessment based on hazard
vulnerability score (HVS) which includes SV and hazard scores
HVS Compiled repository of state-level data that includes social and physical hazard vulnerabilities; state can use new technology for comprehensive vulnerability assessment at state level for natural hazards, however, exceeds technical capacity at local level Wood, Burton, et
al.[39]
2010 Regional Mitigation Earthquake and tsunami
Assess spatial variability in SV of Oregon coast residents to potential earthquake and tsunami impacts
SoVI Certain groups and individuals living on the Oregon Coast are likely to differ disproportionately due to difference in SES and other demographics unrelated to natural disaster physical impact; need to include place-based characteristics to fully understand hazard risk; not useful for exhaustive inventory of individuals with high SV, rather useful for comparative purposes Wu, Yarnal, et
al.[40]
2002 County Mitigation Flooding Assess the vulnerability of Cape Cod, MA coastal community to flooding and relationship with social construction
SoVI Most of the barrier islands have SV because of a high concentration of elderly people; areas of SV due to poverty are congregated near larger towns; useful to overlay SV, hazard risk, and resources in GIS to assess overall vulnerability picture
23
Table 3.Ten most common concepts included in the 15 social vulnerability assessments
Concept Number (%) of articles
which assessed concept
Age (e.g., % population < 5 yrs old, % population 65 years or older)
14 (93%)
Education (e.g., % population >25 years old with <12 years of education)
10 (67%)
Employment status 9 (60%)
Female head of household 10 (67%)
Hispanic immigrants 10 (67%)
Housing ownership (e.g., % renters) 10 (67%)
Housing structure (e.g., % mobile homes, median house value)
14 (93%)
Poverty (% below poverty) 13 (86%)
Population (total or occupied housing units) 13 (87%)
Transportation access 12 (80%)
Despite the resounding conclusion in these articles that social vulnerability indices
provide useful information, there were several limitations discussed regarding the actual
application of the social vulnerability assessments. Several of the articles cited that social
vulnerability mapping does not adequately represent the true nature of components contributing
to the vulnerabilities at a particular place. Finch et al. suggested that “without understanding the
underlying causes that contribute to disparities it is difficult to address the vulnerabilities in
disaster planning” [33]. In addition, the social vulnerability indices only capture a “snapshot” of
a single period and do not explore the longitudinal nature of disasters and vulnerabilities.
Chakraborty et al. suggest that social vulnerability is not a static measurement for at least two
reasons. First, people move, therefore, the distribution of those with need will change over time.
Second, measures of need change with different types of disasters [32]. Another limitation
discussed is the dependency on national data to construct the indices. Much of the data used to
every 10 years. Cutter et al. stated the reliance on national data “may be inadequate to
characterize local circumstances and does not include important indicators, such as, community
capacity (e.g., volunteerism)” [17]. A few of the articles found the sensitivity of the construction
of the index to be significant. There was some disagreement on whether to use a subset of or the
full set of variables recommended by Cutter, as well as on how to construct the index (e.g.,
weighting the variables, use of additive models). Finally, several articles mentioned that the level
of technical capacity needed to construct these complex assessments was a major limitation and
noted that they would be difficult for emergency managers to implement. For example, Simpson
et al. suggest that “a majority of state mitigation staffs will not have the expertise or the time to
complete these time and labor-intensive plans” [38].
The most common gap discussed within the context of social vulnerability assessment
was the lack of a qualitative counterpart to the quantification of social vulnerabilities.
Quantitative assessments provide summary characteristics but do not provide a complete
understanding of the driving forces underlying social vulnerability or its distinct landscape,
which require qualitative assessments to understand. Schmidtlein et al. emphasized that “we
must be careful when employing numerical vulnerability indices to realistically represent the
underlying vulnerability, and not other hidden or related phenomena”[36]. Schmidtlein et al.
assert that “in-depth qualitative analysis, such as case-studies, can provide the context necessary
for applying the quantitative index constructions. These studies could provide better information
on the actually manifestation of vulnerabilities within a study area and provide additional
Discussion
Findings
Three major findings emerged in the literature, including the general role of social
vulnerability and its impact on disaster risk, the utility of social vulnerability indices, and
limitations and gaps of current methodologies.
There was universal acceptance that social vulnerabilities place certain populations at
greater risk of illness and death during many types of disasters. The role of social vulnerabilities
presented in the articles supports findings from previous disasters. For example, previous studies
have shown that hurricanes disproportionately affected the poor, elderly, and female heads of
households [18]. During Hurricane Katrina, African Americans and elderly populations were
disproportionately affected [21, 41]. Most of the articles assessed a set of social vulnerabilities
consistent with broader disaster literature; however, disability, literacy, and English language
competency were not included in the majority of these articles despite evidence in the literature
of the importance of these vulnerabilities [11, 18]. These variables may have been excluded
because it is difficult to ascertain this information at the community level. The majority of
studies used US Census data, which do not have variables for disability and literacy at the level
of analysis (i.e., census tract). Further, race was often excluded despite strong evidence in
previous research that non-whites are affected disproportionately by disasters. Race was likely
not included because of its strong correlation with other variables, such as poverty and social
class. Several authors noted that it is difficult to separate the source of increased vulnerability
when race is included in the indices.
The second finding in this review centered on the utility of social vulnerability indices.
predicting who and where disasters would impact and recovery patterns. The articles highlighted
that knowledge of where vulnerabilities are concentrated within communities and the nature of
the vulnerabilities is an important criterion of effective disaster management. However, based
on the minimal number of studies identified (n=15), there is little evidence that practical
applications of social vulnerabilities assessments are frequently, if at all, included in disaster
management. All of the articles were published by academics and only four of the articles
included government authors (i.e., state and local health or emergency staff). This may suggest
that while academics recognize the importance of identifying social vulnerabilities for effective
disaster management, it may not be conducted in practice.
The final finding highlights the limitations and gaps in the current social vulnerability
assessment methodologies. Several authors claimed that social vulnerability indices ignore the
underlying causes of vulnerabilities, which are often rooted in the structure of society itself. An
opposing view from other authors stressed the recognition of increased vulnerability of these
populations alone can lead to solutions for addressing these problems, suggesting knowledge of
social vulnerabilities is an important first step. Another major limitation addressed by several of
the authors was the technical capacity necessary to conduct social vulnerability assessment. The
current indices require expertise in statistics and geographical information systems (GIS); these
skills may not exist among emergency managers. Further, a few of the authors highlighted the
need for local information, which can provide the context necessary to understand the
manifestation of vulnerability within their communities, to properly interpret the quantitative
assessments. Without having both the technical capacity and the local expertise, the social
Implications
The main implication of this literature review is that identification of social vulnerabilities is
important; however, emergency managers are likely not using existing tools to identify social
vulnerabilities. All of the articles found on social vulnerability assessments were published by
academics and none were published in public health or emergency management journals. I
hypothesize several reasons for this finding.
First, the study of social vulnerabilities has historically been conducted by geographers
who tend to publish in geography or social science journals. Socially vulnerability research
concentrates on the role of “place” in disasters and requires sophisticated geographic information
systems (GIS) to map social vulnerabilities. Another hypothesis is that the field of public health
has not wholly adopted the role of social vulnerabilities in disasters, which would have a much
broader implication on the research question. If emergency managers and planners do not
recognize the role of social vulnerabilities in disasters, then it is difficult to motivate them to
adopt the use of social vulnerability indices.
Directions for Future Research
Future research should address the gap between the existence of social vulnerability
assessment methodologies and utilization of social vulnerability assessments by emergency
managers. The technology and methodology exist to determine social vulnerabilities in
communities; however, emergency managers likely are not utilizing these tools. Research that
closes this gap would add greatly to the current practices in the disaster preparedness and
response community. One solution is the development of a simpler tool that allows emergency
managers to identify social vulnerabilities within their communities. Another solution is
information must be learned: 1) acceptability of social vulnerability assessments in disaster
management; 2) emergency managers’ attitudes regarding the usefulness and effectiveness of
social vulnerability assessments; and 3) current feasibility in conducting these assessments (e.g.,
statistical capability, GIS proficiency) at the local level.
Limitations
There are two overarching limitations of this review. The first is the quality and
limitations of the articles included in this review. The quality was weak in several areas. Many
articles did not describe the social vulnerability variables they ideally would have included had
the data been available. Because many of the articles used US Census data, they were limited to
the variable provided by the Census. Variables that have been found to significantly affect
disaster risk, such as disability, were not included in the analysis or even mentioned in the
articles. Another weakness is that the studies promote the usefulness of social vulnerability
assessments, but stop short of describing how and if emergency managers were using the
information provided by the assessment. Additionally, five of the articles were conducted by
researchers from academic institutions located outside the jurisdiction they were studying and
did not include co-authors from the study areas. Because social vulnerability assessments must
be interpreted with local knowledge, the quality of their interpretations may be dubious.
The second limitation is my ability to collect all examples of social vulnerability
assessments. Ideally, I wanted to capture all applications of social vulnerability indices in
disaster research to address my research question. My chosen methodology only captured
published material and articles to ensure data quality. I attempted to capture additional articles by
using Google Scholar in addition to PubMed. Based on this literature review there is very little
applications are being conducted but the results are not being published. The majority of articles
were by academics which could mean that academics are the only researchers conducting social
vulnerability assessments or academics are the only ones publishing their social vulnerability
assessment results.
Additionally, 40% of the articles had the same co-authors, which may have led to an
overestimation of the current use of social vulnerability indices. Conversely, publication bias
may have led to underrepresentation of social vulnerability assessment utilization. Individual
social vulnerability assessments are not generalizable; therefore, articles on this topic may not be
selected for publication in peer-reviewed journals.
A review of individual state, city, or county disaster plans would have provided
additional information on who is conducting social vulnerability assessments. However, this
would have been extremely time intensive and could have led to spurious results since the
mention of social vulnerability assessments within a disaster plan does not indicate the
assessments are being conducted, nor would the plan indicate the quality or usefulness of the
assessment.
Conclusions—Aim 1
The important role of social vulnerabilities in disasters has been widely accepted;
however, approaches to incorporating social vulnerability into emergency management practices
are not known. This review suggests that social vulnerability indices as part of a broad approach
to emergency management has the potential to significantly reduce losses and improve
outcomes. Because the literature did not provide much information on current practices,
vulnerabilities. Future research should determine current approaches and determine ways to
CHAPTER 3: METHODS
This study used a nonexperimental, descriptive design. I applied qualitative methods to
understand what, if any, approaches emergency managers are using to identify social
vulnerabilities. Key informant interviews were conducted with emergency managers to
understand the current approaches in disaster management for identification of social
vulnerabilities. Because the literature did not provide much information on current practices, the
interviews were used to elicit this information. A follow-up workshop with additional
stakeholders was also conducted to gain a deeper understanding of current approaches. The
results from the interviews and the workshop were used to address Aim 2 (identify current
approaches used by emergency managers to identify social vulnerabilities) and Aim 3 (develop a
plan for change that improves approaches to identifying social vulnerabilities).
Data Collection and Data Sources
Nine key informants were identified through purposive sampling. Emergency managers
were selected from a wide variety of jurisdiction sizes and regions. At least one emergency
manager was selected from each of the five US regions (Northeast, Southeast, Midwest,
Southwest and the West). Additionally, I selected at least two emergency managers from the
following population sizes: small (less than 50,000); medium (50,000-175,000); and large
(greater than 175,000). Table 4 displays the region and jurisdiction sizes of the nine key
organizations including the National Emergency Managers Association, International
Association of Emergency Managers, Disaster Epidemiology Community of Practice, and
Council of State and Territorial Epidemiologists’ Disaster Epidemiology Subcommittee.
Table 4. Region and jurisdiction size of key informant interviewees
Region Jurisdiction Size Total
Large (total population greater than 175,000)
Medium (total population between 50,000and 175,000)
Small (total population less than 50,000)
Northeast 1 1
Southeast 3 1 1 5
Midwest 1 1
South 1 1
Northwest 1 1
Total 4 3 2 9
I sent potential participants a recruitment email (see Appendix A). Interested participants
were then scheduled for a 30 minute telephone interview. During the interview, I read the
informed consent over the phone and participants were asked to verbally consent to participation
and recording of the interview. All interviews were conducted using a semi-structured interview
guide (see Appendix B) between June and August 2013. After each interview, I wrote memos
and summarized the content of each interview (including date/time of interview, main points
expressed, and how long the interview lasted).
Each interview was transcribed and transcripts were reviewed for quality assurance.
Transcription was conducted by GMR Transcription (GMR Transcription, Atlanta, GA). Once
the transcriptions were complete a second person read through each while listening to the
notes. I reviewed each transcript as well for accuracy. Each transcript was then coded by a
researcher at SciMetrika (SciMetrika, Research Triangle Park, NC) using ATLAS.ti (version
6.2.28, Atlas.ti Scientific Software Development GmbH, Berlin). Coding allowed the data to be
systematically read for themes. Deductive codes based on the interview questions were applied
to all transcripts, as well as inductive codes based on themes observed by me during the
interview. Not all themes were found across all interviews. Codes were organized in a codebook
(see Appendix C) based on the conceptual framework, research questions, and interview guide.
The Atla.ti© software coded emergent themes that were common across interviews and
SciMetrika conducted a systematic analysis of the codes.
To delve deeper into understanding the themes that emerged in the interviews, I hosted a
workshop—Emergency Managers and Social Vulnerability Workshop— at CDC on July 11-12,
2013 to gather additional information from informants and other stakeholders. Workshop
participants included local-level emergency managers (of which, seven were also key informant
interviewees), state-level emergency managers, academic researchers, public health and human
resource practitioners, and representatives from CDC. The workshop agenda included
demonstrations of social vulnerability tools and breakout sessions to discuss the themes that
emerged from the key informant interviews (see agenda Appendix D). Workshop participants
were asked to share their personal knowledge and experiences with the group during the
discussion groups. To capture information from the workshop, note takers took notes throughout
the entire workshop and audio recorded each session. SciMetrika summarized the meeting notes
Limitations
This study was limited to nine participants for the key informant interviews due to the
Office of Management and Budget (OMB) Paperwork Reduction Act which requires approval
from the OMB for federally sponsored data collections. Because I am an employee of the CDC
and data collection for this project is federally sponsored, the OMB Paperwork Reduction Act
would have applied to this research had I included 10 or more participants in the survey.
Therefore, the interview portion of this study was limited to nine emergency managers. The nine
interviews and the additional information gathered from the workshop were sufficient to inform
future work. The nine also provided enough information to reach saturation on all areas of
inquiry.
This study was not representative of all emergency managers across the country and was
limited to the experiences, perceptions and practices conveyed by study participants. In
alignment with the principles of qualitative research, participants for this study were
purposefully selected. The idea behind purposefully selecting participants in qualitative research
is to help the researcher understand the research question and does not imply a random sample or
a large number of participants was used [42]. This research was not designed to be representative
of a larger population and generalizability was not a goal of this study.
Institutional Review Board and Confidentiality Issues
I sought and received IRB approval from CDC. CDC reviewed the protocol in
accordance with expedited review process, determined that the study poses no greater than
minimal risk to subjects, and approved the request for waiver of documentation of informed
UNC reviewed the submission and determined the study to be exempt from further review on
May 22, 2013.
Respondent information was kept confidential. Names were not recorded on the
transcripts. Each interview was assigned a code, all written materials summarizing the interview
content, including the transcripts, were designated by this code, and the master sheet linking the
participant and the code were kept separately in a locked cabinet. Electronic and hard copies of
interview notes and other data were stored on a password-protected computer. Access to
electronic and hard copies of notes were restricted to the researchers only. All notes, tapes and
transcripts will be destroyed upon the completion of the study and after the dissertation is
approved by my dissertation committee.
Data are only presented by jurisidction size and geographic region. The primary risk to
subjects participating in this study was breach of confidentiality. However, because all study
CHAPTER 4: RESULTS
Results are based on key informant interviews and the workshop. Throughout the results
select quotations from key informants are included in blue boxes. These quotations were selected
based on the clarity with which they illustrate the emergent themes. At the end of each quotation,
the source (i.e., the region and jurisdiction size) of the quotation is identified.
Description of in-depth interview participants
The nine key informants were all local-level emergency managers. Emergency managers
described working in their current positions on average nine years, with a range of 1-18 years.
Several emergency managers worked in the emergency management field before starting their
current role increasing the average time working in emergency management to 19 years.
Definitions of at-risk populations
Emergency managers in the key informant interviews and the workshop were asked how
their jurisdictions defined at-risk populations. All the emergency managers had broad definitions
of at-risk populations. Most often the definition included all persons that may not be able to
evacuate in the event of an emergency, including individuals with medical or functional needs,
individuals with special needs including physical or cognitive disabilities (e.g., mental illness,
vision impaired, hearing impaired), low socioeconomic status, those with no transportation,
speaking, and immigrants. One emergency manager specified using the Federal Emergency
Management Agency (FEMA) definition of at-risk which includes “those individuals specifically
recognized as at-risk in the statute, i.e., children, senior citizens, and pregnant women, as well as
those individuals who may need additional response assistance such as those with physical or
mental disabilities and those with limited English proficiency.” Several emergency managers
created their own definitions.
"Anybody that doesn't have the ways and means to get out of harm’s way is an at-risk population. I mean it’s pretty broad from that perspective. So you can’t leave no body behind, you have to be prepared to handle any and all situations.”
(Large jurisdiction, Southeast)
“We look at anyone who is outside of the mainstream population, meaning if you have a set of people who you know you can give a set of directions and they’re going to
understand your directions and follow those, you assume they are your mainstream population. Anyone outside of that would be a special needs person, whether that’s because they have physical limitations or because they speak a different language.”
(Medium jurisdiction, Northwest)
One definition also included tourists, farm workers, and populations that live in mobile homes.
Another included sex offenders as a “special needs” population since during emergencies they
require accommodations that are separate from the general population.
Identification of at-risk populations
Emergency managers reported two main methods for identification of at-risk individuals:
registries and partnerships.
Registries
Some emergency managers described a self-identification process for the registration of
at-risk populations. Several counties maintained a registry or database where people needing