Vaccination Confidence and Parental
Refusal/Delay of Early Childhood Vaccines
Melissa B. Gilkey1*, Annie-Laurie McRee2, Brooke E. Magnus3, Paul L. Reiter4, Amanda F. Dempsey5, Noel T. Brewer61Department of Population Medicine, Harvard Medical School & Harvard Pilgrim Health Care Institute, Boston, Massachusetts, United States of America,2Department of Pediatrics, University of Minnesota, Minneapolis, Minnesota, United States of America,3Department of Psychology, University of North Carolina, Chapel Hill, North Carolina, United States of America,4Division of Cancer Prevention and Control, The Ohio State University, Columbus, Ohio, United States of America,5Adult and Child Centered Outcomes Research and Dissemination Science (ACCORDS) Program, University of Colorado Denver, Aurora, Colorado, United States of America,6Department of Health Behavior and Lineberger Comprehensive Cancer Center, University of North Carolina, Chapel Hill, North Carolina, United States of America
Abstract
Objective
To support efforts to address parental hesitancy towards early childhood vaccination, we sought to validate the Vaccination Confidence Scale using data from a large, population-based sample of U.S. parents.
Methods
We used weighted data from 9,354 parents who completed the 2011 National Immunization Survey. Parents reported on the immunization history of a 19- to 35-month-old child in their households. Healthcare providers then verified children’s vaccination status for vaccines including measles, mumps, and rubella (MMR), varicella, and seasonal flu. We used sepa-rate multivariable logistic regression models to assess associations between parents’mean scores on the 8-item Vaccination Confidence Scale and vaccine refusal, vaccine delay, and vaccination status.
Results
A substantial minority of parents reported a history of vaccine refusal (15%) or delay (27%). Vaccination confidence was negatively associated with refusal of any vaccine (odds ratio [OR] = 0.58, 95% confidence interval [CI], 0.54–0.63) as well as refusal of MMR, varicella, and flu vaccines specifically. Negative associations between vaccination confidence and measures of vaccine delay were more moderate, including delay of any vaccine (OR = 0.81, 95% CI, 0.76–0.86). Vaccination confidence was positively associated with having received vaccines, including MMR (OR = 1.53, 95% CI, 1.40–1.68), varicella (OR = 1.54, 95% CI, 1.42–1.66), and flu vaccines (OR = 1.32, 95% CI, 1.23–1.42).
a11111
OPEN ACCESS
Citation:Gilkey MB, McRee A-L, Magnus BE, Reiter PL, Dempsey AF, Brewer NT (2016) Vaccination Confidence and Parental Refusal/Delay of Early Childhood Vaccines. PLoS ONE 11(7): e0159087. doi:10.1371/journal.pone.0159087
Editor:Anne C Moore, University College Cork, IRELAND
Received:January 15, 2016
Accepted:June 27, 2016
Published:July 8, 2016
Copyright:© 2016 Gilkey et al. This is an open access article distributed under the terms of the
Creative Commons Attribution License, which permits unrestricted use, distribution, and reproduction in any medium, provided the original author and source are credited.
Data Availability Statement:Due to NCHS restrictions aimed at ensuring participants’ confidentiality, we do not have access to the dataset. However, investigators wishing to use NIS data may contact the NCHS Research Data Center (http://www. cdc.gov/rdc/) to complete a proposal and receive ethics approval. Upon approval, NIS data are available to all interested researchers.
Conclusions
Vaccination confidence was consistently associated with early childhood vaccination behav-ior across multiple vaccine types. Our findings support expanding the application of the Vacci-nation Confidence Scale to measure vacciVacci-nation beliefs among parents of young children.
Introduction
From January 2014 to June 2015, the Centers for Disease Control and Prevention documented over 800 cases of measles in the United States, including a cluster of 117 cases linked to a California amusement park [1]. The highly publicized“Disneyland outbreak”brought national attention to the rising incidence of measles specifically as well as to the issue of parents’hesitancy to vaccinate their children against infectious diseases more generally [2]. Public health research to date largely supports assertions made in the popular press that parents’confidence in routine vaccination has eroded in recent years, leading to vaccine refusal and delay [3–6]. Evidence of this trend comes indirectly from several sources, including studies that show that parents are more often requesting exemptions to school entry requirements for vaccination and that providers perceive parental vac-cine refusal as being more common than in the past [3–6]. However, neither vaccine refusal and delay, nor the underlying concerns that motivate these behaviors, are routinely assessed in the National Immunization Survey or other ongoing, large-scale surveillance efforts. For this reason, our ability to more directly quantify changes in the prevalence of vaccine hesitancy is limited.
Public health experts, including the National Vaccine Advisory Committee (NVAC), have highlighted the need to address this gap through additional research on vaccine refusal and delay [7]. In a recent report, the NVAC Vaccine Confidence Working Group placed special emphasis on developing valid and reliable measures to assess parental beliefs and other determinants of forgone vaccination [7]. Toward this end, we developed the Vaccination Confidence Scale, an 8-item, 3-factor scale that measures beliefs related to the perceived benefits of vaccination, the perceived harms of vaccination, and trust in vaccine providers [8]. We originally created our scale to assess parental beliefs related to adolescent vaccination, and in a prior validation study, we found that parents’mean Vaccination Confidence Scale scores were consistently associated with vaccine refusal and vaccination status for vaccines in the adolescent platform, including meningococcal and human papillomavirus (HPV) vaccines [9]. This success raises the possibility that a modified version of our scale could be useful for assessing vaccination beliefs related to early childhood vaccines, including measles, mumps, and rubella (MMR) vaccine.
To investigate this question, we conducted a second validation study of the Vaccination Confidence Scale. Using data from a nationally-representative sample of parents, we sought to assess associations between vaccination confidence and vaccine refusal, vaccine delay, and vac-cination status for vaccines administered in early childhood. By broadening our scale’s applica-tion to include early childhood vaccinaapplica-tion, this study aims to support ongoing efforts to understand and increase the public’s vaccination confidence so as to reduce vaccine refusal and delay across the life course.
Methods
Participants and Data Source
Data came from the 2011 National Immunization Survey (NIS). As described previously, the NIS is a population-based survey conducted annually by the Centers for Disease Control and Prevention with the primary goal of assessing children’s vaccination status; in 2011, the survey MG, K22 CA186979 to MG,http://www.cancer.gov/)
The funders had no role in study design, data collection and analysis, decision to publish, or preparation of the manuscript.
also included questions to assess parents’vaccination beliefs [10]. In the first phase of data col-lection, a probability sample of parents and guardians participated in a landline or cellular tele-phone survey; the purpose of this survey was to assess the immunization history of a randomly selected 19- to 35-month-old child in the household. (To facilitate reporting, we refer to respondents hereafter as“parents.”) For those parents who gave consent, a second phase of data collection involved a mail-based survey sent to children’s vaccine providers; the purpose of this survey was to assess children’s vaccination status using medical records.
The response rate for the 2011 NIS household survey was 62% for the landline telephone sample and 25% for the cellular telephone sample [11]. Across the samples, providers returned adequate data for 72% of all respondents. We drew our analytic sample from 12,580 parents with adequate provider-confirmed vaccination data who completed the“Parental Concerns Module,”a special set of questions included in the 2011 NIS. We excluded parents who had missing data on variables related to vaccination beliefs or behaviors (n = 2,461) or who com-pleted the survey in a language other than English (n = 765). Our final analytic sample con-sisted of the remaining 9,354 parents.
The National Center for Health Statistics (NCHS) Research Ethics Review Board approved data collection for the 2011 NIS. Analysis of de-identified data from the survey is exempt from the federal regulations for the protection of human research participants. We accessed data from the Parental Concerns Module through the NCHS Research Data Center because these restricted variables are not included in the public-use dataset. Analysis of restricted data through the NCHS Research Data Center was approved by the NCHS Ethics Review Board. The University of North Carolina Institutional Review Board determined that this study was exempt from further review.
Measures
The 2011 NIS Parental Concerns Module assessed parents’vaccination beliefs with survey items that used an 11-point response scale ranging from 0 (“strongly disagree”) to 10 (“strongly agree”). The module included items corresponding to the 8 items from the 2010 NIS-Teen that we used to develop the Vaccination Confidence Scale in a prior study, with the difference being that NIS-Teen items referred to“teenagers”while NIS items referred to“children”[8]. The resulting scale consisted of factors assessing perceived benefits of adolescent vaccination (i.e., “Benefits,”α= 0.78), perceived harms (“Harms,”α= 0.56), and trust in healthcare providers (“Trust,”α= 0.55) (Fig 1). To assess overall confidence, we calculated mean scale scores for each parent by averaging responses for all 8 items, after reverse coding negative beliefs in the Harms factor. The resulting scores had a possible range of 0 to 10 with higher scores indicating more positive beliefs about vaccination. We next calculated mean scores for the Benefits, Harms (without reverse coding), and Trust factors by averaging the item responses within each factor.
The 2011 NIS household survey assessed demographic characteristics including the child’s age, sex, and race/ethnicity (Table 1). NCHS analysts used demographic data to determine chil-dren’s eligibility for the Vaccines for Children (VFC) program, which provides free vaccines for children whose families have limited ability to pay [12]. Survey respondents indicated their relationship to the child, the age and educational attainment of the child’s mother, and the annual income and geographic location of the household.
The 2011 NIS provider survey assessed the child’s vaccination status for vaccines in the rou-tine immunization schedule. Providers used medical records to indicate the dates on which the child received vaccine doses, and NCHS analysts then determined whether the child was up-to-date by age 36 months for vaccinations including1 dose of MMR,1 dose of varicella, and1 dose of seasonal flu vaccines [10,11]. The NCHS also reported whether children were up-to-date for the 4:3:1:-:3:1:4 combined series, which included4 doses of tetanus-containing vaccine,3 doses of poliovirus vaccine,1 dose of measles-containing vaccine,3 doses of hepatitis B,1 dose of varicella vaccine, and4 doses of pneumococcal conjugate vaccine (PCV). As indicated by the dash (-), this series excludedHaemophilusinfluenzae type b (Hib) due to a shortage of that vaccine during the study period.
Fig 1. The Vaccination Confidence Scale as modified for early childhood vaccination.
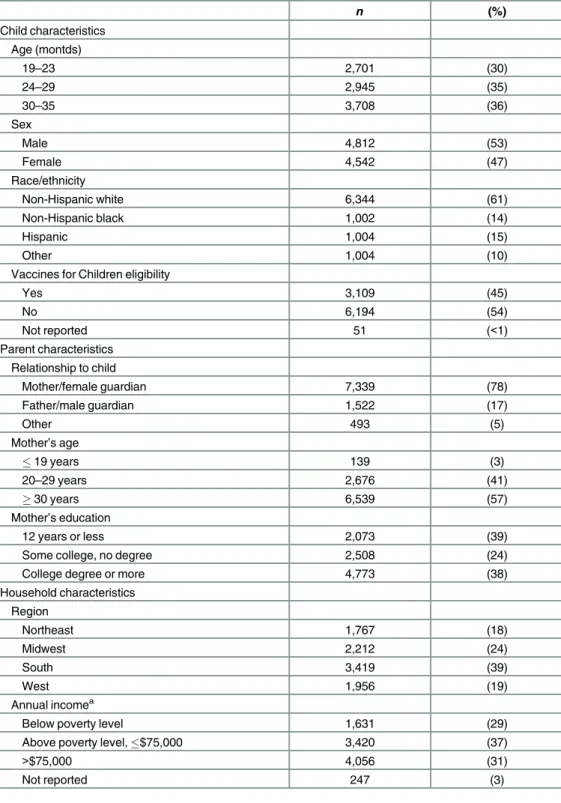
Table 1. Sample characteristics (n= 9,354).
n (%)
Child characteristics Age (montds)
19–23 2,701 (30)
24–29 2,945 (35)
30–35 3,708 (36)
Sex
Male 4,812 (53)
Female 4,542 (47)
Race/ethnicity
Non-Hispanic white 6,344 (61)
Non-Hispanic black 1,002 (14)
Hispanic 1,004 (15)
Other 1,004 (10)
Vaccines for Children eligibility
Yes 3,109 (45)
No 6,194 (54)
Not reported 51 (<1)
Parent characteristics Relationship to child
Mother/female guardian 7,339 (78)
Father/male guardian 1,522 (17)
Other 493 (5)
Mother’s age
19 years 139 (3)
20–29 years 2,676 (41)
30 years 6,539 (57)
Mother’s education
12 years or less 2,073 (39)
Some college, no degree 2,508 (24)
College degree or more 4,773 (38)
Household characteristics Region
Northeast 1,767 (18)
Midwest 2,212 (24)
South 3,419 (39)
West 1,956 (19)
Annual incomea
Below poverty level 1,631 (29)
Above poverty level,$75,000 3,420 (37)
>$75,000 4,056 (31)
Not reported 247 (3)
Note. Table shows raw frequencies and weighted percentages. Percentages may not total 100% due to rounding.
aPoverty level based on 2010 U.S. Census poverty threshold.
Statistical Analyses
To investigate the relationship between overall vaccination confidence and vaccination behav-ior, we used separate logistic regression models to assess the association between mean Vacci-nation Confidence Scale scores and vaccine refusal and delay. We examined these outcomes for any vaccine, as well as for MMR, varicella, and flu vaccines specifically. We also used logis-tic regression to assess the association between mean scale scores and vaccination status for the combined series, as well as for MMR, varicella, and flu vaccines separately. To explore the rela-tive influence of each scale factor, we re-ran logistic regression models using all three factors, instead of a single overall scale score. Models controlled for three demographic factors that prior research indicates are associated with vaccine refusal or delay: child’s race/ethnicity, mother’s educational attainment, and annual household income [13–14].
Our analyses used survey weights developed by NCHS analysts to obtain nationally repre-sentative estimates. We report raw frequencies and weighted means, percentages, and odds ratios. Conducted in SAS 9.3 (Cary, NC), all statistical tests were 2-tailed with a critical alpha of 0.05.
Results
Sample Characteristics
Parents reported on roughly equal numbers of male (53%) and female (47%) children (Table 1). Most children were non-Hispanic white (61%), non-Hispanic black (14%), or His-panic (15%). Almost half were eligible for the Vaccines for Children program (45%). About three-quarters of parents were mothers or female guardians (78%). A substantial minority of parents had a high school degree or less education (39%) or lived below the poverty threshold (29%).
Vaccination Confidence
Parents reported high levels of vaccination confidence. The mean score for the full, 8-item scale was 8.30 (standard error [SE] = 0.03). Factor score means were 8.72 (SE = 0.03) for Bene-fits, 3.58 (SE = 0.05) for Harms (without reverse coding), and 9.34 (SE = 0.03) for Trust.
Scale Validation
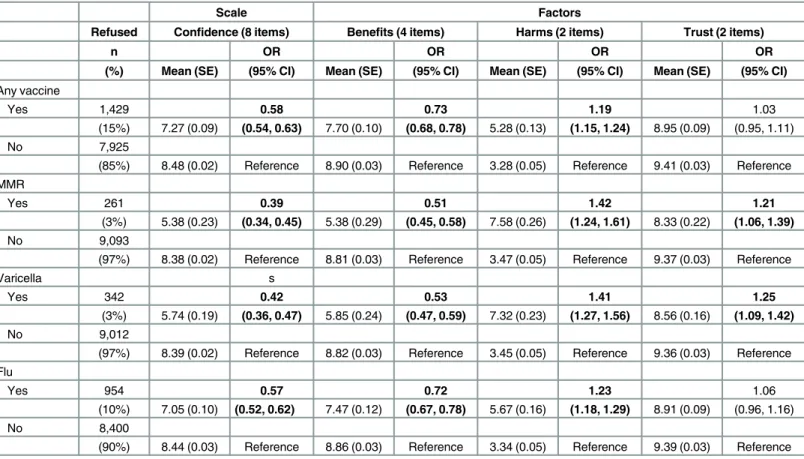
Vaccine refusal. Fifteen percent of parents reported having refused any vaccine for their child, with refusal of specific vaccines being 3% for MMR, 3% for varicella, and 10% for flu (Table 2). Overall vaccination confidence was negatively associated with refusal of any vaccine such that every one point increase in the scale mean corresponded with a 42% decrease in the odds of refusal (odds ratio [OR] = 0.58, 95% confidence interval [CI], 0.54–0.63). Vaccination confidence was also negatively associated with refusal of MMR, varicella, and flu vaccines.
In models that included the three factors separately, the Benefits factor was most strongly associated with refusal of any vaccine (OR = 0.73, 95% CI, 0.68–0.78), as well as with the refusal of MMR, varicella, and flu vaccines specifically. The Harms factor was less strongly associated with refusal of any vaccine (OR = 1.19, 95% CI, 1.15–1.24), as well as with the refusal of MMR, varicella, and flu vaccines. Trust was not associated with refusal of any vaccine, but was posi-tively associated with refusal of MMR and varicella vaccines, contrary to our expectations.
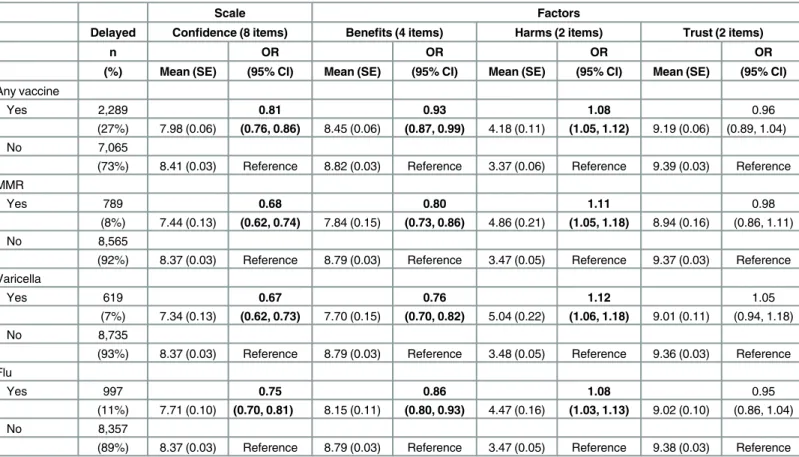
Vaccine delay
models using the full 8-item scale, vaccination confidence was negatively associated with delay of any vaccine (OR = 0.81, 95% CI, 0.76–0.86), as well as with delay of MMR, varicella, and flu vaccines.
In models using the three factors, Benefits again demonstrated the strongest association with delay of any vaccine (OR = 0.83, 95% CI, 0.87–0.99), as well as with delay of MMR, vari-cella, and flu vaccines. The Harms factor was positively associated with any vaccine delay (OR = 1.08, 95% CI, 1.05–1.12), as well as with delay of MMR, varicella, and flu vaccines. Trust was not associated with any of the four measures of vaccine delay.
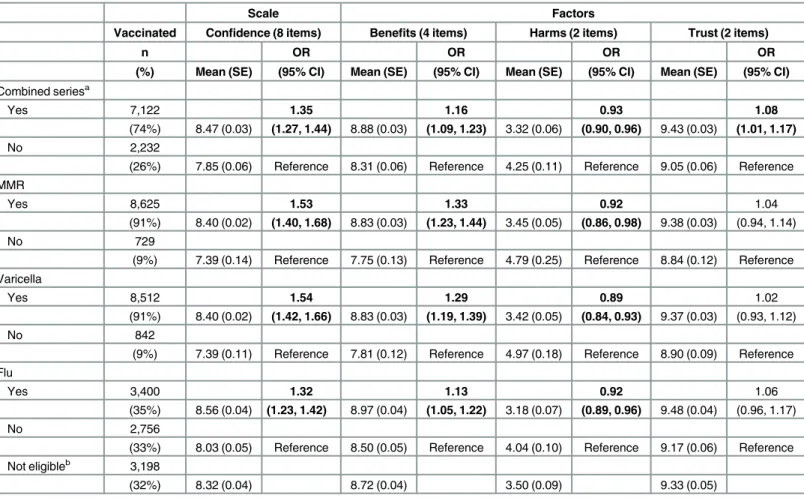
Vaccination status. Seventy-four percent of children were up-to-date for the combined vaccine series, with vaccine-specific coverage being 91% for MMR, 91% for varicella, and 35% for flu (Table 4). In models using the full 8-item scale, vaccination confidence was positively associated with coverage for the combined series (OR = 1.35, 95% CI, 1.27–1.44), as well as with coverage of MMR, varicella, and flu vaccines.
In models using the three factors, Benefits was positively associated with coverage for the combined series (OR = 1.16, 95% CI, 1.09–1.23), as well as coverage of MMR, varicella, and flu vaccines. The Harms factor was negatively associated with coverage for the combined series (OR = 0.93, 95% CI, 0.90, 0.96), as well as coverage of MMR, varicella, and flu vaccines. Trust was associated with coverage for the combined series only (OR = 1.08, 95% CI, 1.01–1.17).
Table 2. Parent-reported vaccine refusal: Multivariable associations with scale and factor score means (n= 9,354).
Scale Factors
Refused Confidence (8 items) Benefits (4 items) Harms (2 items) Trust (2 items)
n OR OR OR OR
(%) Mean (SE) (95% CI) Mean (SE) (95% CI) Mean (SE) (95% CI) Mean (SE) (95% CI)
Any vaccine
Yes 1,429 0.58 0.73 1.19 1.03
(15%) 7.27 (0.09) (0.54, 0.63) 7.70 (0.10) (0.68, 0.78) 5.28 (0.13) (1.15, 1.24) 8.95 (0.09) (0.95, 1.11)
No 7,925
(85%) 8.48 (0.02) Reference 8.90 (0.03) Reference 3.28 (0.05) Reference 9.41 (0.03) Reference MMR
Yes 261 0.39 0.51 1.42 1.21
(3%) 5.38 (0.23) (0.34, 0.45) 5.38 (0.29) (0.45, 0.58) 7.58 (0.26) (1.24, 1.61) 8.33 (0.22) (1.06, 1.39)
No 9,093
(97%) 8.38 (0.02) Reference 8.81 (0.03) Reference 3.47 (0.05) Reference 9.37 (0.03) Reference
Varicella s
Yes 342 0.42 0.53 1.41 1.25
(3%) 5.74 (0.19) (0.36, 0.47) 5.85 (0.24) (0.47, 0.59) 7.32 (0.23) (1.27, 1.56) 8.56 (0.16) (1.09, 1.42)
No 9,012
(97%) 8.39 (0.02) Reference 8.82 (0.03) Reference 3.45 (0.05) Reference 9.36 (0.03) Reference Flu
Yes 954 0.57 0.72 1.23 1.06
(10%) 7.05 (0.10) (0.52, 0.62) 7.47 (0.12) (0.67, 0.78) 5.67 (0.16) (1.18, 1.29) 8.91 (0.09) (0.96, 1.16)
No 8,400
(90%) 8.44 (0.03) Reference 8.86 (0.03) Reference 3.34 (0.05) Reference 9.39 (0.03) Reference
Note: CI: confidence interval. MMR: measles, mumps, and rubella. OR: odds ratio. SE: standard error. Table shows raw frequencies and weighted estimates. Models controlled for child’s race/ethnicity, mother’s educational attainment, and annual household income. Bolded odds ratios indicate statistically significant associations.
Discussion
Using data from a large, nationally-representative sample of parents, we found that vaccination confidence was consistently associated with behaviors related to early childhood vaccination. Mean scores on the Vaccination Confidence Scale were most strongly associated with measures of vaccine refusal, with each one point increase in mean scale scores corresponding with a reduction in the odds of refusal ranging from 42% for any vaccine to 61% for MMR. Although we identified a similar pattern of findings in a prior study focusing on adolescent vaccines [9], the associations between mean scale scores and measures of vaccine refusal were greater in magnitude for the early childhood vaccines that were the focus of the present study. These find-ings suggest that vaccination confidence may be particularly salient for parents of young chil-dren, who are faced with relatively frequent decisions about whether or not to accept
vaccinations [13–17].
In addition to vaccine refusal, we found that vaccination confidence was consistently associ-ated with measures of vaccine delay and vaccination status. Each one point increase in mean scale scores was associated with a reduction in the odds of delay ranging from 19% for any vac-cine to 33% for varicella vacvac-cine. Here again, our scale appeared to perform more strongly for early childhood vaccines than adolescent vaccines, as our prior study found that scale scores were only weakly and inconsistently associated with adolescent vaccine delay [9]. In the case of vaccination status, each one point increase in mean scale scores was associated with an
Table 3. Parent-reported vaccine delay: Multivariable associations with scale and factor score means (n= 9,354).
Scale Factors
Delayed Confidence (8 items) Benefits (4 items) Harms (2 items) Trust (2 items)
n OR OR OR OR
(%) Mean (SE) (95% CI) Mean (SE) (95% CI) Mean (SE) (95% CI) Mean (SE) (95% CI)
Any vaccine
Yes 2,289 0.81 0.93 1.08 0.96
(27%) 7.98 (0.06) (0.76, 0.86) 8.45 (0.06) (0.87, 0.99) 4.18 (0.11) (1.05, 1.12) 9.19 (0.06) (0.89, 1.04)
No 7,065
(73%) 8.41 (0.03) Reference 8.82 (0.03) Reference 3.37 (0.06) Reference 9.39 (0.03) Reference MMR
Yes 789 0.68 0.80 1.11 0.98
(8%) 7.44 (0.13) (0.62, 0.74) 7.84 (0.15) (0.73, 0.86) 4.86 (0.21) (1.05, 1.18) 8.94 (0.16) (0.86, 1.11)
No 8,565
(92%) 8.37 (0.03) Reference 8.79 (0.03) Reference 3.47 (0.05) Reference 9.37 (0.03) Reference Varicella
Yes 619 0.67 0.76 1.12 1.05
(7%) 7.34 (0.13) (0.62, 0.73) 7.70 (0.15) (0.70, 0.82) 5.04 (0.22) (1.06, 1.18) 9.01 (0.11) (0.94, 1.18)
No 8,735
(93%) 8.37 (0.03) Reference 8.79 (0.03) Reference 3.48 (0.05) Reference 9.36 (0.03) Reference Flu
Yes 997 0.75 0.86 1.08 0.95
(11%) 7.71 (0.10) (0.70, 0.81) 8.15 (0.11) (0.80, 0.93) 4.47 (0.16) (1.03, 1.13) 9.02 (0.10) (0.86, 1.04)
No 8,357
(89%) 8.37 (0.03) Reference 8.79 (0.03) Reference 3.47 (0.05) Reference 9.38 (0.03) Reference
Note: CI: confidence interval. MMR: measles, mumps, and rubella. OR: odds ratio. SE: standard error. Table shows raw frequencies and weighted estimates. Models controlled for child’s race/ethnicity, mother’s educational attainment, and annual household income. Bolded odds ratios indicate statistically significant associations.
improvement in the odds of vaccination ranging from 32% for flu vaccine to 54% for varicella vaccine. These findings on early childhood vaccination status are comparable to the associa-tions we observed in our prior study of adolescent vaccines [9].
When we examined the performance of individual factors within our scale, we found that, across our measures of refusal, delay, and vaccination status, the Benefits factor was most strongly associated with vaccination behavior. As in our prior study [9], our findings suggest that the Benefits items offer a possible“short form”of our scale. The Harms factor was also associated with these measures, although somewhat less strongly. These findings are consistent with the well-established literature on the Health Belief Model, which documents the influence of perceived risks and benefits on vaccination behavior [13,18–19]. In contrast to Benefits and Harms, we were surprised to note that the Trust factor was associated with only three measures of vaccination behavior, and in two instances, these associations were not in the expected direc-tion. Given the extent to which prior research has emphasized the importance of the
parent-Table 4. Provider-reported vaccination status: Multivariable associations with scale and factor score means (n= 9,354).
Scale Factors
Vaccinated Confidence (8 items) Benefits (4 items) Harms (2 items) Trust (2 items)
n OR OR OR OR
(%) Mean (SE) (95% CI) Mean (SE) (95% CI) Mean (SE) (95% CI) Mean (SE) (95% CI)
Combined seriesa
Yes 7,122 1.35 1.16 0.93 1.08
(74%) 8.47 (0.03) (1.27, 1.44) 8.88 (0.03) (1.09, 1.23) 3.32 (0.06) (0.90, 0.96) 9.43 (0.03) (1.01, 1.17)
No 2,232
(26%) 7.85 (0.06) Reference 8.31 (0.06) Reference 4.25 (0.11) Reference 9.05 (0.06) Reference MMR
Yes 8,625 1.53 1.33 0.92 1.04
(91%) 8.40 (0.02) (1.40, 1.68) 8.83 (0.03) (1.23, 1.44) 3.45 (0.05) (0.86, 0.98) 9.38 (0.03) (0.94, 1.14)
No 729
(9%) 7.39 (0.14) Reference 7.75 (0.13) Reference 4.79 (0.25) Reference 8.84 (0.12) Reference Varicella
Yes 8,512 1.54 1.29 0.89 1.02
(91%) 8.40 (0.02) (1.42, 1.66) 8.83 (0.03) (1.19, 1.39) 3.42 (0.05) (0.84, 0.93) 9.37 (0.03) (0.93, 1.12)
No 842
(9%) 7.39 (0.11) Reference 7.81 (0.12) Reference 4.97 (0.18) Reference 8.90 (0.09) Reference Flu
Yes 3,400 1.32 1.13 0.92 1.06
(35%) 8.56 (0.04) (1.23, 1.42) 8.97 (0.04) (1.05, 1.22) 3.18 (0.07) (0.89, 0.96) 9.48 (0.04) (0.96, 1.17)
No 2,756
(33%) 8.03 (0.05) Reference 8.50 (0.05) Reference 4.04 (0.10) Reference 9.17 (0.06) Reference Not eligibleb 3,198
(32%) 8.32 (0.04) 8.72 (0.04) 3.50 (0.09) 9.33 (0.05)
Note: CI: confidence interval. MMR: measles, mumps, and rubella. OR: odds ratio. SE: standard error. Table shows raw frequencies and weighted estimates. Models controlled for child’s race/ethnicity, mother’s educational attainment, and annual household income. Bolded odds ratios indicate statistically significant associations.
aCombined series (4:3:1:-:3:1:4) included4 doses of DTaP/DT/DTP,3 doses of poliovirus vaccine,1 dose of measles-containing vaccine,3 doses of
HepB,1 dose of varicella vaccine, and4 doses of PCV. Hib excluded due to shortage.
bNot eligible group excluded from logistic regression models. This group consisted of children who were not 6- to 23- months of age for September 1 through
December 31 in the year prior to data collection.
provider relationship in parents’vaccine-related decision making [13,20–22], our findings likely reflect shortcomings in our measure of trust. For example, our measure was specific to healthcare providers; trust in other entities, such as pharmaceutical companies or governmen-tal bodies, may also be relevant, as well as trust in vaccines themselves. Furthermore, the high mean value for this construct suggests a possible ceiling effect, whereby respondents endorsed trust items so highly that meaningful variation was lacking. Future research can extend the present study by developing and evaluating items that better capture variation with regard to parents’trust of their children’s vaccine providers or the healthcare system more generally.
Overall, our findings provide strong support for broadening the application of the Vaccina-tion Confidence Scale to measure parents’beliefs about early childhood vaccination. Specifi-cally, we anticipate that our brief scale can complement existing measures [23–26] to expand our ability to conduct surveillance of vaccine hesitancy, a goal prioritized by the NVAC Vac-cine Confidence Working Group [7]. Similarly, our scale could also be used for evaluating interventions to address vaccine hesitancy and for segmenting audiences to facilitate the devel-opment and delivery of messages targeted by parents’level of vaccination confidence. Such tar-geting is important because parents’informational needs vary according to the extent of their vaccine-related concerns [27]. Although the Vaccination Confidence Scale may have clinical applications as a screening tool to identify parents at risk for refusing or delaying early child-hood vaccines, additional research will be needed to assess the effectiveness of using our scale as an individual- versus population-level measure.
Strengths of this study include the validation of our scale with regard to vaccine refusal and delay, two behaviors that are more relevant than vaccination status alone to understanding parents’participation in immunization programs. This study is also strengthened by the use of data from the NIS, a large, nationally-representative survey of parents which also offers provider-reported data on children’s vaccination status. Limitations of this study include its cross-sectional design, which limits our ability to establish the directionality of the relationship between vaccina-tion confidence and behavior. Future research can build upon the present study by prospectively assessing Vaccination Confidence Scale scores and subsequent refusal or delay of early childhood vaccines. This study was also limited by its focus on parents’vaccination beliefs. Although this focus served the study’s primary goal of validating the Vaccination Confidence Scale, we acknowl-edge that other factors, such as provider recommendations and clinical systems for patient recall and reminders, are also important determinants of early childhood vaccination coverage [28–31].
In conclusion, the findings of this study suggest that vaccination confidence is closely tied to early childhood vaccination behavior. Parents’mean scores on the 8-item Vaccination Confi-dence Scale were consistently associated with vaccine refusal, vaccine delay, and vaccination status across a variety of early childhood vaccines. Indeed, although we originally developed our scale to investigate parental beliefs about adolescent vaccines, the findings of this study sug-gest that our measure is even more relevant to the context of early childhood vaccination. Additional prospective research will be needed to characterize causal pathways between vacci-nation confidence and behavior, but we believe that the present study suggests considerable promise for using the Vaccination Confidence Scale as a brief measure of vaccination beliefs relevant to vaccine hesitancy. In this way, our scale can offer a measurement tool to support public health efforts to build parents’confidence in immunization programs so as to protect individuals and communities from vaccine preventable diseases.
Author Contributions
References
1. Centers for Disease Control and Prevention. Measles cases and outbreaks. 2015. Available:http:// www.cdc.gov/measles/cases-outbreaks.html.
2. Clemmons NS, Gastanaduy PA, Fiebelkorn AP, Redd SB, Wallace GS. Measles—United States, Janu-ary 4-April 2, 2015. MMWR Morb Mortal Wkly Rep. 2015; 64: 373–376. PMID:25879894
3. Omer SB, Pan WK, Halsey NA, Stokley S, Moulton LH, Navar AM, et al. Nonmedical exemptions to school immunization requirements: secular trends and association of state policies with pertussis inci-dence. JAMA. 2006; 296: 1757–1763. PMID:17032989
4. Kempe A, Daley MF, McCauley MM, Crane LA, Suh CA, Kennedy AM, et al. Prevalence of parental concerns about childhood vaccines: the experience of primary care physicians. Am J Prev Med. 2011; 40: 548–555. doi:10.1016/j.amepre.2010.12.025PMID:21496754
5. Imdad A, Tserenpuntsag B, Blog DS, Halsey NA, Easton DE, Shaw J. Religious exemptions for immu-nization and risk of pertussis in New York State, 2000–2011. Pediatrics. 2013; 132: 37–43. doi:10. 1542/peds.2012-3449PMID:23733795
6. Robison SG1, Groom H, Young C. Frequency of alternative immunization schedule use in a metropoli-tan area. Pediatrics. 2012; 130: 32–38. doi:10.1542/peds.2011-3154PMID:22711719
7. U.S. Department of Health and Human Services. NVAC Vaccine Confidence Working Group. Assess-ing the State of Vaccine Confidence in the United States: Recommendations from the National Vaccine Advisory Committee. 2015. Available:
http://www.hhs.gov/nvpo/nvac/reports/nvac-vaccine-confidence-public-health-report-2015.pdf. http://www.hhs.gov/nvpo/nvac/subgroups/nvac-vaccine-confidence-wg.html.
8. Gilkey MB, Magnus BE, Reiter PL, McRee AL, Dempsey AF, Brewer NT. The Vaccination Confidence Scale: a brief measure of parents' vaccination beliefs. Vaccine. 2014; 32: 6259–6265. doi:10.1016/j. vaccine.2014.09.007PMID:25258098
9. Gilkey MB, Reiter PL, Magnus BE, McRee AL, Dempsey AF, Brewer NT. Validation of the Vaccination Confidence Scale: a brief measure to identify parents at risk for refusing adolescent vaccines. Acad Pediatr. 2015 Aug 20. pii: S1876-2859(15)00215-6. doi:10.1016/j.acap.2015.06.007
10. Centers for Disease Control and Prevention. Datasets and related documentation for the National Immunization Survey, 2010–2014. 2015. Available:http://www.cdc.gov/nchs/nis/data_files.htm.
11. Centers for Disease Control and Prevention. National Immunization Survey: a user’s guide for the 2011 public-use data file. 2015. Available: ftp://ftp.cdc.gov/pub/Health_Statistics/NCHS/Dataset_Documen-tation/NIS/NISPUF11_DUG.PDF.
12. Centers for Disease Control and Prevention. Vaccines for Children (VFC) Program. 2015. Available: http://www.cdc.gov/vaccines/programs/vfc/index.html.
13. Smith PJ, Humiston SG, Marcuse EK, Zhao Z, Dorell CG, Howes C, et al. Parental delay or refusal of vaccine doses, childhood vaccination coverage at 24 months of age, and the Health Belief Model. Pub-lic Health Rep. 2011; 126 Suppl 2: 135–146. PMID:21812176
14. Gilkey MB, McRee AL, Brewer NT. Forgone vaccination during childhood and adolescence: findings of a statewide survey of parents. Prev Med. 2013; 56: 202–206. doi:10.1016/j.ypmed.2012.12.019PMID: 23295175
15. Fredrickson DD, Davis TC, Arnould CL, Kennen EM, Hurniston SG, Cross JT, et al. Childhood immuni-zation refusal: provider and patient perceptions. Fam Med. 2004; 36: 431–439. PMID:15181556
16. Gust DA, Strine TW, Maurice E, Smith P, Yusuf H, Wilkinson M, et al. Underimmunization among chil-dren: effects of vaccine safety concerns on immunization status. Pediatrics. 2004; 114: e16–e22. PMID:15231968
17. Dempsey AF, Schaffer S, Singer D, Butchart A, Davis M, Freed GL. Alternative vaccination schedule preferences among parents of young children. Pediatrics. 2011; 128: 848–856. doi:10.1542/peds. 2011-0400PMID:21969290
18. Rosenstock IM. Historical origins of the Health Belief model. Health Educ Behav. 1974; 2: 328–335.
19. Reiter PL, Brewer NT, Gottlieb SL, McRee AL, Smith JS. Parents' health beliefs and HPV vaccination of their adolescent daughters. Soc Sci Med. 2009; 69: 475–480. doi:10.1016/j.socscimed.2009.05.024 PMID:19540642
20. Benin AL, Wisler-Scher DJ, Colson E, Shapiro ED, Homnboe ES. Qualitative analysis of mothers’ deci-sion-making about vaccines for infants: the importance of trust. Pediatrics. 2006; 117: 1532–1541. PMID:16651306
22. Senier L.“It’s your most precious thing”: worst-case thinking, trust, and parental decision making about vaccination. Sociol Inq. 2008; 78: 207–229.
23. Opel DJ, Taylor JA, Zhou C, Catz S, Myaing M, Mangione-Smith R. The relationship between parent attitudes about childhood vaccines survey scores and future child immunization status: a validation study. JAMA Pediatr. 2013; 167: 1065–1071. doi:10.1001/jamapediatrics.2013.2483PMID:24061681
24. McRee AL, Brewer NT, Reiter PL, Gottlieb SL, Smith JS. The Carolina HPV immunization attitudes and beliefs scale (CHIAS): scale development and associations with intentions to vaccinate. Sex Transm Dis. 2010; 37: 234–239. doi:10.1097/OLQ.0b013e3181c37e15PMID:19940807
25. Larson HJ, Jarrett C, Schulz WS, Chaudhuri M, Zhou Y, Dube E, et al. Measuring vaccine hesitancy: the development of a survey tool. Vaccine. 2015; 33:4165–4175. doi:10.1016/j.vaccine.2015.04.037 PMID:25896384
26. Larson HJ, Schulz WS, Tucker JD, Smith DM. Measuring vaccine confidence: introducing a global vac-cine confidence index. PLoS Curr. 2015 Feb 25; 7.
27. Nyhan B, Reifler J, Richey S, Freed GL. Effective messages in vaccine promotion: a randomized trial. Pediatrics. 2014; 133: e835–e842. doi:10.1542/peds.2013-2365PMID:24590751
28. Smith PJ, Marcuse EK, Seward JF, Zhao Z, Orenstein WA. Children and adolescents unvaccinated against measles: geographic clustering, parents’beliefs, and missed opportunities. Public Health Rep. 2015; 130: 1–20.
29. Szilagyi PG, Rodewald LE. Missed opportunities for immunizations: a review of the evidence. J Public Health Manag Pract. 1996; 2: 18–25. PMID:10186652
30. Dubé E, Laberge C, Guay M, Bramadat P, Roy R, Bettinger J. Vaccine hesitancy: an overview. Hum Vaccin Immunother. 2013; 9: 1763–1773. doi:10.4161/hv.24657PMID:23584253