NMR Study of Local Magnetism, Anelastic Deformation, and Liquid Behavior of Bulk Metallic Glasses
Magdalena Traico Sandor
A dissertation submitted to the faculty of the University of North Carolina at Chapel Hill in partial fulfillment of the requirements for the degree of Doctor of Philosophy in the Department of Physics and Astronomy.
Chapel Hill 2012
ii
© 2012
iii ABSTRACT
MAGDALENA TRAICO SANDOR: NMR Study of Local Magnetism, Anelastic Deformation, and Liquid Behavior of Bulk Metallic Glasses
(Under the direction of Prof. Yue Wu)
In this dissertation, 27Al NMR studies of CuZr- and La-based metallic glasses were carried out to investigate local magnetic properties, the mechanism of anelastic deformation, and liquid state behavior. The first part of this dissertation will cover magnetization properties of (CuZr)93-xAl7Gdx bulk metallic glasses (BMGs) from temperature dependent 27Al NMR spectroscopy and magnetic susceptibility measurements. Significant nonlinear line
broadening of 27Al spectra commencing at high temperatures is attributed to a local magnetic susceptibility distribution. Magnetization measurements confirm linewidth enhancement caused by the strong frustrated development of antiferromagnetic magnetic short-range order.
The next section of this dissertation concerns constant-compression experiments that were carried out at room temperature to study the anelastic response of La50Ni15Al35 bulk
iv
observed and changes in free volume. These results can be further reconciled within the theory of atomic level stresses.
v
vi
ACKNOWLEDGEMENTS
The works discussed in this dissertation were made possible with the support of the U. S. Army Research Office, grant no W911NF-09-1-0343, GAAN, NC Space Grant, and Amelia Earhart Fellowships.
I want to express my sincere gratitude to my advisor, Prof. Yue Wu, for giving me the opportunity to work for him. I remember making the decision to switch from astronomy to physics during the end of my 2nd year of graduate school with the intent of only finishing with a master’s degree. Working with Prof. Wu gave me the confidence to proceed even further with my degree and I discovered that I was actually very interested in metallic glasses. During the past 5 years, he has taught me how to do research and appreciate the physics of glass science. I am grateful for his patience and understanding during which was not able to attend to a normal schedule like everyone else in our research group. My experience as a graduate student has allowed me to understand better the so-called “work/family balance” and all the associated instabilities and triumphs that I encountered on a daily basis. After this experience, I am not at all sure that a balance actually exists. With that being said, I know I could not have come this far without the support from my advisor and members of my research group.
vii
questions regarding NMR experiments, taught me how to handle hardware, and gave me valuable advice about life in general.
I am happy to have met Horst Kessemeier and learn about his many contributions to NMR. I appreciated many of our conversations regarding NMR and family.
I’d like to express my sincere gratitude towards Jacob Forstater. I cannot express how many times has helped me with my experiments and given me advice. I appreciate many of our conversations over coffee and his ability to make light of any situation regardless of how stressed I felt. He is a good friend and I will never forget all that he has done for me.
I am also very thankful to previous and current members of Wu Group for their help. I am especially grateful to Xue-kui Xi. He is the first person I worked with on metallic glasses and has helped me during the last few years. He was also very influential in my decision to stay in physics. I would like to express my thanks to Wei Xu who had helped tremendously me with some of my data collection and probe reconstruction. Other members that I am grateful towards are: Qiang ‘Charles’ Chen, Harsha Kulkarni, Gregory Mogilevsky, B. J. Anderson, Shaun Gidcumb, Courtney Hadsell, Zhixiang ‘Jeff’ Luo, Yunzhao Xing, and Patrick Doyle.
I would also like to express my appreciation to Oscar Bernal, Laszlo Kecskes, Jian Xu, J. Q. Wang, and Haibo Ke for providing me with samples and assistance with data collection (DSC, magnetization measurements, and mechanical testing) and analysis.
I am grateful to my committee members, Profs. Yue Wu, Tom Clegg, Laurie E. McNeil, Lu-Chang Qin, and Pabitra Sen. I am also very appreciative towards Dr. Laurie McNeil’s early proofreading of this dissertation.
viii
TABLE OF CONTENTS
LIST OF TABLES ... xi
LIST OF FIGURES ... xii
LIST OF ABBREVIATIONS ... xviii
CHAPTER 1 Introduction... 18
1.1 Glass Transition and Supercooled Liquids ... 19
1.2 Metallic Glasses and Bulk Metallic Glasses ... 20
1.3 Motivations for Studying Metallic Glasses... 21
1.4 NMR as a probe of local magnetism, anelastic deformation, and liquid structure ………...23
1.5 Dissertation outline ... 23
CHAPTER 2 Nuclear magnetic resonance ... 26
2.1 Introduction: Properties of Nuclei and Relaxation ... 26
2.2 Interactions in Metal ... 30
2.3 Spin-Lattice Relaxation Time ... 32
2.4 Quadrupole Interactions ... 32
CHAPTER 3 Local magnetism in (CuZr)93-xAl7Gdx Bulk Metallic Glasses………...…37
3.1 Introduction ... 37
3.2 Magnetism in rare-earth metals ... 38
ix
3.4 Results and Discussion ... 41
3.4.1 NMR spectra for x = 1 and x = 2 ... 41
3.4.2 Non-linear spectral linewidth broadening ... 43
3.4.3 Hyperfine field temperature dependence ... 46
3.4.4 Magnetization Measurements ... 47
3.4.5 Spin-glass-like behavior ... 51
3.5 Conclusions ... 53
CHAPTER 4 Anelastic deformation of La-based metallic glasses………54
4.1 Introduction: Free Volume and Shear Transformation Zones (STZs) ... 54
4.2 Experiments: Constant Compression, Modulated Differential Scanning Calorimetry, and NMR ... 57
4.3 Experimental Results ... 62
4.3.1 NMR nutation results ... 62
4.3.2 Modulated Differential Scanning Calorimetry (MDSC)……….68
4.3.3 27Al NMR Spectroscopy ... 71
4.4 Discussion: Relevance for atomic-level stress theory ... 73
4.5 Conclusions ... 75
CHAPTER 5………76
Probing the liquid behavior of La-based metallic glass ... 76
5.1 Introduction: Structure of Metallic Liquids ... 76
5.2 Phase Transition in liquid state ... 77
5.3 Microscopic Immiscibility in Metallic Liquids ... 78
5.4 Sample preparation and NMR experiments ... 80
x
5.6 Room temperature versus Liquid Spectra ... 82
5.7 Temperature Dependent Knight Shift ... 84
5.8 Population and Knight Shift Dependence on Rapid Cooling ... 89
5.9 Stability of the Liquid State Due to Isothermal Annealing Time ... 92
5.10 Thermodynamics of the Knight Shift ... 94
5.11 Data Interpretation ... 95
5.11.1 Atomic-level immiscibility ... 95
5.11.1.2 Features of Phase Separation ... 96
5.11.1.3 Liquid Decomposition: Ostwald ripening and Brownian Flocculation ... 98
5.11.2 Potential Energy Landscape Influenced Regime ... 101
5.12 Quadrupole Relaxation ... 106
5.13 Conclusions ... 110
CHAPTER 6………..112
xi
LIST OF TABLES
Table 4.1: Micrometer measurements of a La50Ni15Al35 BMG rod
taken before compression, immediately after, and 10 and 24 hours after 24-hour compression.The average irreversible strain after 24 hours is ~0.03%. Credit: Micrometer measurements were
carried out by Haibo Ke at Chinese Academy of Sciences……...61 Table 4.2: Fitting values of quadrupole frequency ωQ/ 2 , length
changes, and Knight shift values (ppm)..……...……….……….69 Table 5.1: Summary of Knight shift slopes for the two liquid peaks
xii
LIST OF FIGURES
Figure 1.1 Change of volume versus temperature upon cooling below the liquidus temperature Tliq without crystallization.
Deviation from the thermal equilibrium liquid state occurs below Tg due to slow dynamics and glass formation. The
change of volume in the crystalline state is also shown for comparison. ... 20 Figure 2.1 The diagram above demonstrates the difference
between the spectral line splitting due to Zeeman interactions, with a corresponding Larmor frequency of 78 MHz, versus quadrupole effects for a nucleus with spin I 5 / 2. Zeeman interactions result in equally-spaced energy levels (left blue) resulting in a single well-defined peak in the spectrum. This can be compared to first-order quadrupole interactions that cause unequal line splitting of the satellite transitions. The spectrum on the right is simulated using SIMPSON software
with a quadrupole frequency Q = 1.2 MHz..…………...………...………...34 Figure 2.2 The two-pulse Hahn-echo pulse sequence development
in the time domain. Nutation maps the evolution of the central and satellite transition intensities that are strongly dependent
on the quadrupole interaction...……...………...35 Figure 3.1 Schematic of Oxford Helium Variox Cryostat that operates
between 1.3 and 300K operates between 1.3 and 300K………...40 Figure 3.2 NMR frequency-shifted spectra for Cu45.5Zr45.5Al7Gd2
at 300 K and 77 K for comparison. Dashed lines show the two sources of broadening from first-order quadrupole interactions
(satellites) and from +3Gd moments (central transition)………..42 Figure 3.3 (a) & (b) Spectral linewidth for (CuZr)92Al7Gd1 and
(CuZr)91Al7Gd2. Dashed lines provide a guide for the eye to
show that nonlinear broadening occurs at ~ 150K. Purely paramagnetic alloy systems are expected to display linear
linewidth temperature dependence. ………,,,,,,,,,,………..43 Figure 3.4 /k Ks f versus for x = 1 (a) and x = 2 (b) with
temperature as an implicit parameter after conduction-electron Knight shift and second order quadrupolar broadening corrections.
xiii
Figure 3.5 for x = 1 (a) and x = 2 (2) displays Ks f versus with temperature as an implicit parameter. The behavior of Ahf is
inferred from the slope…..………..………….47 Figure 3.6 The magnetic susceptibility1
versus T for x = 1 and 2
at 10,000 Oe. The dashed lines are linear extrapolations of the susceptibility at high temperatures giving paramagnetic Curie temperatures of (-30 ± 1) K for x = 1 and (-5 ± 1) K for x = 2. The inset contains trial fits (black solid) at low temperature to test the possibility of the “Griffiths phase”. Fits to 1
10
T T T
yield values of 0.52 and -0.33 for x = 1 and x = 2, respectively, and do not meet the criteria of the Griffiths magnetization scaling law where 0 1is predicted. Credit: Magnetization measurements
of samples were carried out by J.Q.Wang at the Chinese Academy of Sciences………48 Figure 3.7 Magnetization isotherms for x = 1 and x = 2 at 80 K
and 300 K for fields up to 70,000 Oe show paramagnetic behavior. Credit: Magnetization measurements of samples were carried
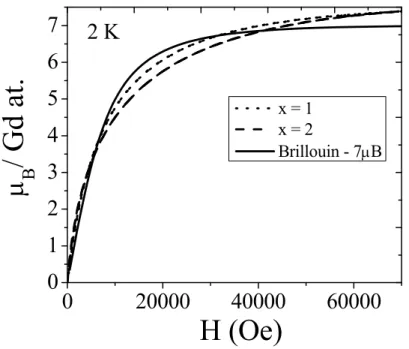
out by J.Q. Wang at the Chinese Academy of Sciences………..………50 Figure 3.8 Magnetization isotherms for x = 1 and 2 at 2 K are
compared to Brillouin function with a magnetic moment gJ= 7B. Direct comparison shows the presence of strong non-Brillouin behavior at 2 K for both x = 1 and 2. Credit: Magnetization measurements of samples were carried out by J.Q. Wang at the
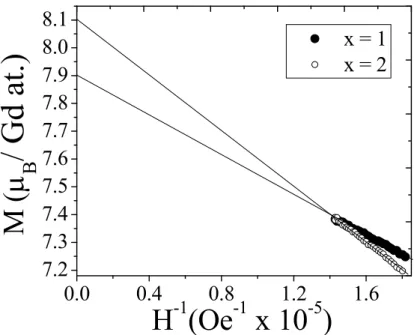
Chinese Academy of Sciences………...………..50 Figure 3.9 A linear extrapolation of M versus H1at high fields
(60-70 kOe) results in a large saturation moment of 7.9 B and
8.1 B for x = 1 and 2, respectively………..………..…52 Figure 4.1 Schematic illustrating the two deformation mechanisms
observed in metallic glasses. Shear transformation zones (STZs) correspond to the regions of local atomic rearrangements that
take place during a shear………...………..………...55 Figure 4.2 At the atomic-level, local regions of metallic glass have
symmetric free energies . Applying a stress lowers the free energy
xiv
Figure 4.4 X-ray diffraction of a compressed BMG sample at 900 MPa
for 24 hours compared with an as-cast BMG sample………….…………..………...59 Figure 4.5 (a) Room temperature constant-compression experiments
for 24 hours. The elastic (~1.90%), anelastic (~0.10%) (delayed elastic), and anelastic and viscoplastic strain (~0.04%) responses are noted. Credit: Mechanical treatment of BMG rods were carried out by
Haibo Ke at Chinese Academy of Sciences. ……...………....60 Figure 4.6 Nutation experiments where the central transition intensity
is plotted versus the second pulse duration in a Hahn-echo sequence. The pulse duration t1 increases from 0 to 6.5 µs by steps of 0.5 µs.
Solid lines are fits of ωQ and are summarized in Table 4.2 in addition
length change percentages. ………...………..………...63 Figure 4.7 Nutation profiles due to different applied stresses for
24 hrs where Q changes from 700 kHz in the as-cast state to 620 kHz after compression at 800 MPa and 560 kHz after
compression at 900 MPa. ……….……….…...…………...64 Figure 4.8 Nutation experimental data for as-cast, compressed,
and annealed samples (data points), which show no changes in structural symmetry due to anelastic relaxation for > 1 month. The
fit of the nutation curve gives Q=810 kHz.………...67 Figure 4.9 MDSC curves of non-reversing heat flow for as-cast,
annealed, and compressed samples. The compressed samples do not show changes in enthalpic recovery near Tg. This can be
compared to the annealed sample that shows significant
structural relaxation……….………71 Figure 4.10 Spectra for the as-cast, compressed, and annealed
rods are shown. The inset demonstrates the small change in
Knight shift caused by structural relaxation: 657 to 647 ppm. ………...………....72 Figure 5.1 High temperature NMR probe that consists of a heating
cap and bottom plate. The picture on the right shows the small
sample used, highlighted in red………...………....81 Figure 5.2 High temperature DSC heating and cooling cycles at a
rate of 20 degrees/minute………..………..……….…82 Figure 5.3 Spectra for La50Ni15Al35 at room temperature and at 960 C……….83
Figure 5.4 Liquid spectrum showing two peaks at 818 ppm (peak 1)
xv
Figure 5.5 The temperature dependence of the Knight shift during a heating cycle. Peak 1 (■) and peak 2 (●) refer to the large and small peaks, respectively in Fig. 5.4 The arrows are a guide for
the eye to show which temperatures correspond to the spectra in Fig. 5.6….………..…...…85 Figure 5.6 Spectra for the heating cycle at 720, 780, 820, 880,
and 920 C. The relative intensities between the two phases stay constant……….…….86 Figure 5.7 The temperature dependence of the Knight shift during
a heating and cooling cycle. Peak 1 (□) and Peak 2 () refers to the large and small peak as shown in Fig. 5.4 Arrows guide the eye to
show which temperatures correspond to the spectra in Fig. 5.8……….………...87 Figure 5.8 Spectra for the cooling cycle at 720, 780, 820, 880,
and 920 C. The relative intensities between the two phases stay
constant until just below the kink temperature at 810C………..….88 Figure 5.9 Ratio of intensities for the two liquid peaks as a function
of temperature. Within the error bars the ratio stays constant at ~7 upon heating. The sharp change in intensity from ~7 to ~2 denotes the significant growth of the smaller liquid phase. The onset temperature is consistent with the temperatures of the kinks
exhibited in the Knight shift during heating and cooling. ...……….……..89 Figure 5.10 Spectra obtained by heating to 960 C and then rapidly
cooling to 860, 790, and 720 C. The smaller liquid phase is suppressed………...90 Figure 5.11 Ratio of intensities for the two liquid phases obtained
by heating to 960 C and then rapidly cooling to 860, 790, and 720 C. The smaller liquid phase is suppressed as observed by
the constant intensity ratio of ~7……….………….91 Figure 5.12 The temperature dependence of the Knight shift
during rapid cooling cycle as noted by the arrows. Peak 1 (▲)
and Peak 2 (∆) refers to the large and small peak as shown in Fig. 5.4………...92 Figure 5.13 Spectra at 960 C and 860 C 8 min, 48 min, and
1.3 hour annealing times. The spectra show stability in these temperature regions…...…….93 Figure 5.14 Spectra at 790 C due to isothermal annealing times 8 min
and 1.3 hours at 960 C. Peak 2 is enhanced for an isothermal annealing time > 1hour…….93 Figure 5.15 Binary phase diagram of A and B atoms that
have a miscibility gap. Cooling liquid LbelowTcresults in liquid decomposition such as phase-separation L1L2,
xvi
Figure 5.16 Schematic illustration of the potential energy landscape of a liquid as a function of the N particle coordinates adapted from [137]. The potential energy is characterized by the number and distribution of potential energy minima that correspond to the liquid configuration. The dashed line (- - - -) represents the crossover
temperature from free diffusion (1) to the landscape-influenced regime (2) [133] …...103 Figure 5.17 Schematic illustration of the potential energy landscape
that accounts for two coexisting liquids states, adapted from [138]. Megabasin 1 corresponds to the larger liquid population and
resides at a lower average potential energy than megabasin 2. The horizontal green line ( - - - - ) corresponds to the crossover
between the free diffusion and landscape-influenced regimes. During large annealing times tunneling occurs in the landscape-
influenced regime and results in an enhancement of peak 2 ………....106 Figure 5.18 The quadrupole relaxation rateR TQ( )is plotted for peak 1
during heating, cooling, and rapid cooling that shows hysteretic behavior. The correlation time is observed to be much larger than during heating
xvii
LIST OF ABBREVIATIONS
NMR Nuclear Magnetic Resonance BMG Bulk Metallic Glass
FM Ferromagnetic AF Anti-ferromagnetic SRO Short-range Order GFA Glass-forming Ability STZs Shear Transformation Zones RF Radio Frequency
DSC Differential Scanning Calorimetry
MDSC Modulated Differential Scanning Calorimetry FWHM Full Width at Half Maximum
CHAPTER 1 Introduction
19
of glass make structural characterizations of these different aspects very challenging using conventional techniques. This dissertation will describe 27Al nuclear magnetic resonance studies to investigate different aspects of bulk metallic glass: local magnetism, anelastic deformation, and liquid behavior.
1.1Glass Transition and Supercooled Liquids
Glass is made by rapid quenching from the liquid state to form an amorphous solid and is thereby considered a “frozen liquid”. Macroscopic flow is not observed in the glassy state due to relaxation times that far exceed the experimental-timescale [1]. From an energetics perspective, glasses are in a metastable state with larger potential energy than the corresponding crystalline state [2, 3]. At ambient temperatures the local energy barrier predominates and renders thermally activated events, such as structural relaxation or crystallization, negligible. When glass is formed by rapidly quenching a melt from the liquid state below the glass transition Tg crystallization is simultaneously bypassed as illustrated in
Figure 1.1 [4]. Liquids that are formed below the liquid temperature Tliq are called
supercooled liquids. When supercooled liquids are cooled below Tliq molecular motions slow
20
Figure 1.1 Change of volume versus temperature upon cooling below the liquidus temperature Tliq without crystallization. Deviation from the thermal equilibrium liquid state
occurs below Tg due to slow dynamics and glass formation. The change of volume in the
crystalline state is also shown for comparison.
1.2Metallic Glasses and Bulk Metallic Glasses
21 m
) of Au75Si25 was produced under rapid cooling conditions [7]. Metallic glass is one of
the important types of glasses because of its unique mechanical properties that surpass conventional engineering materials [5, 8]. For example, some metallic glasses can have yield strength higher than that of steel and elasticity comparable to that of polymers [5]. Unfortunately, it is one of the least accessible glassy systems because of the weak glass forming ability (GFA) of metallic alloys. Forming a metallic glass from the liquid state, while simultaneously avoiding crystallization, requires extremely high cooling rates. For example, Fe-, Co-, and Ni-based metallic glasses require cooling rates that exceed 105 deg/s and typically produce glasses with dimensions of less than 50m [8]. The maximum casting diameter of metallic glasses is the critical diameterDC, which is severely limited by the required large cooling rates. However, this situation has changed drastically with the discovery of bulk metallic glasses (BMGs) [9, 10]. BMGs are defined as metallic glasses that can be fabricated on the millimeter scale or larger and were first produced by Chen in 1974 [10]. Since then Zr-, Mg-, Pd-Fe, Pd-Cu, and La-based multicomponent bulk metallic glasses were discovered [8, 11]. Pd-Cu-based BMGs represent a remarkable class of metallic glasses that require a critical cooling rate as low as 0.1 deg/s with a critical diameter reaching as high as 100 mm [8]. The drastic improvement of glass forming ability (GFA) as indicated by the marked improvement of the critical diameter DC and decreased critical cooling rates has made studying metallic glasses in the supercooled regime using different characterization techniques more feasible [12, 13].
1.3Motivations for Studying Metallic Glasses
22
world of glasses they represent a unique class of materials. Compared to their crystalline counterparts metallic glasses have superior fracture strength, soft magnetic properties, and good corrosion resistance [5, 8]. Unlike crystalline materials, the intrinsically disordered nature of metallic glasses makes experimental characterization a difficult task and causes their underlying properties and various associated mechanisms to remains active areas of study.
For instance, metallic glasses take on lots of interesting magnetic phases ranging from spin-glass behavior to re-entrant ferromagnetism [14, 15]. This has inspired much interest in mapping magnetic phase diagrams with increasing magnetic impurity concentration in metallic glasses [14-16]. Often this magnetic behavior is characterized using bulk magnetization experiments. This dissertation discusses how NMR can also be used to complement susceptibility measurements by characterizing the local magnetism at the atomic level.
23
volume alone perhaps is not sufficient to describe the inherent deformation mechanism in metallic glasses.
The study of structural changes and phase transitions in liquids due to the first-order liquid-liquid phase transition (LLPT) has recently become a prominent area of experimental and computational research [22]. Little attention was paid to the LLPT since it is generally believed that the structural changes in a liquid should be gradual due to dynamical averaging of structure. The LLPT is believed to be driven by differences of entropy or density between the liquid species [22], spinodal decomposition or phase separation due to large differences in heats of mixing between constituent atoms [23], or microheterogeneities that are derived from ingots and preserved upon melting [24, 25] .
1.4NMR as a probe of local magnetism, anelastic deformation, and liquid structure This dissertation describes the work carried out using NMR spectroscopy of BMGs in both the glassy and liquid states in an attempt to address some of the fundamental issues of glasses discussed above. NMR is a powerful and non-invasive technique is used to study properties of nuclei and their local environments. Specifically, 27Al NMR spectroscopy is used to probe the properties of metallic glasses at Al sites. NMR spectroscopy can provide information regarding local atomic and electronic structure in the solid state and dynamics in the liquid state.
1.5Dissertation outline
24
research topics studying using NMR spectroscopy. Chapter 6 summarizes brief conclusions and potential for future research regarding liquid behavior of La-based metallic glasses.
Chapter 3 describes temperature-dependent 27Al NMR spectroscopy and magnetization measurements that were utilized to explore the local magnetism in (CuZr)46.5-xAl7Gdx (x = 1,
2) BMGs at low temperatures. From spectroscopy experiments, it was observed that strong spectral linewidth enhancement emerges at high temperatures arising from a distribution of the local susceptibility that spans a narrow temperature range. Magnetization experiments confirm that while the local susceptibility is inhomogenous and gives rise to strong AF short-range frustration these amorphous systems on average remains paramagnetic.
Chapter 4 discusses transient structural changes that take place during anelastic deformation. This work also provided a better understanding of the relevant order parameter (tensor versus scalar) necessary to characterize the preliminary stages of deformation. 27Al NMR and modulated differential scanning calorimetry studies of La50Ni15Al35 were utilized
to provide a snapshot of anelastic-induced structural changes that were compared with as-cast and annealed reference states. The data reveal that anelastic strain causes an increase in symmetry of the local electric field gradient (second-rank tensor) that is proportional to compression time whereas the corresponding changes of free volume (scalar) were negligible due to the small viscoplastic strain.
25
of hysteresis and thus verifies that the non-linear behavior is a first-order-like phase transition. The nonlinear behavior was also confirmed by analyzing the spectral linewidths. These results are discussed in the context of phase separation driven by chemical potential differences for metallic melts [26] and also within the framework of potential energy landscape theory [2, 27].
CHAPTER 2
Nuclear magnetic resonance
2.1 Introduction: Properties of Nuclei and Relaxation
From a classical perspective, nuclear magnetic resonance (NMR) involves radio frequency (RF) pulses corresponding to the Larmor procession frequency of the nuclear magnetic moments of interest and their precession about a strong constant external field (3-4 Tesla) due to energy absorption. In terms of quantum mechanisms, energy absorption is caused by different spin populations between quantized energy levels of the nuclear magnetic moments. The interaction due to the strong external field and the nuclear magnetic moments is given by the Zeeman interaction. There are other important interactions that are unique depending on the material of study, which can be treated as a perturbation of the Zeeman interaction. Basic theory regarding NMR will be reviewed below [28-30].
The magnetic resonance phenomenon is found in systems that have both a magnetic moment and angular momentum. The angular momentum is given by Iand its magnitude is given by | |I
I I( 1)
1/2where I can be integer or half integer (I 0, 1/2, 1, 3/2, etc.). The work discussed throughout will deal with NMR of 27Al with I 5 / 2. The magneticdipole moment of a nuclear spin is related to the spin angular momentum, I by
I
27
placed in an external field H that causes a time-dependent change in the angular momentum
of the nucleus given by ddt H . For a constant external field Ho
the solution of this equation is that the magnetic moment precesses at a constant angle and at an angular frequency (Larmor frequency) given by o Ho.
The magnetization of the nuclear spin population difference is given by the Boltzmann distribution
0 0 exp / exp / I m I I m Im mH kT
M N mH kT
. (2.1)where N is the total number of nuclear spins and is Planck’s constant. At room temperature an approximation can be made in which
H kT0/ 1. The net magnetization reduces to
2 2
0 1
3 o o
N I I
M H H
kT
(2.2)
whereois the nuclear susceptibility and Hois the strong constant external field that points along the z-axis. The Zeeman interaction is the interaction between the nuclear magnetic moment and the external field and gives rise to the Zeeman energy levels E H mo where m I I , 1,...,I which are equally spaced energy levels with an energy difference
o o
E H
28
NMR experiments are carried out by placing a sample in the inductor coil of an LC circuit of an NMR probe, which is inserted into a superconducting magnet. Initially the nuclear spins are at thermal equilibrium with the strong external field. The transmitter is turned on and produces a linearly-polarized RF field is given by
1 1
( ) 2H t H cost x. (2.3)
This can be decomposed into two rotating components given by
1 1 1
( )H t H (cost xsint y) + (cosH t xsint y). (2.4) The first term on the left rotates clockwise and is in the rotating frame of the precessing magnetic moment. The second term rotates counter-clockwise and has a negligible effect on the resonance of the nucleus since it has a rotation frequency of 2o . The total magnetic field in the NMR experiment is
1 1
( )H t H (cost xsint y) + H z o . (2.5) The first term on the right-hand side of (2.5) corresponds to the RF field applied in a plane
perpendicular toHo
29
As mentioned previously, NMR experiments begin with the population of nuclear
spins in thermal equilibrium as denoted by M0
. An application of an RF field induces a
time evolution of non-interacting nuclear moments of a net magnetization M given by the set of Bloch equations:
2 2 0 1 x x x y y y z z z dM M M H dt T dM M M H dt T M M dM M H dt T . (2.6)
An RF pulse at the resonant frequency of the nucleus of interest results in a perturbation of the nuclear magnetic moment by an RF pulse at the resonant frequency. This causes M to move away from its thermal equilibrium value Mo
. When the transmitter is turned off, the
net magnetization tries to recover towards Mo
and precesses about the strong external field. The small signal induced in the coil (order of ~V ) of the probe during precession is further amplified during data collection. In the longitudinal direction, any change of Mzis due to the energy transfer from the nuclear spin to its surroundings or a thermal reservoir. This time constant T1 is called the spin-lattice relaxation time. Relaxation in the transverse or xy planeis given by the spin-spin relaxation time constant T2. This characterizes the time
30 2.2 Interactions in Metal
Conduction electrons are what set metals apart from non-conducting materials. These electrons are responsible for Pauli paramagnetism and the Knight shift. In metals, the magnetic field at the nucleus of interest might be different from the applied field. For a given nucleus in a simple metal (metallic bonding dominated by s-orbitals), the resonance frequency m is slightly higher than the resonance frequency sof the same isotope in a non-conducting substance, which gives the reference frequency. This is known as the Knight shift [31] given by
m s
s
K
. (2.7)
The origin of such a shift is derived from s-conduction electrons. For simple metals, the spin polarization of the conduction electrons gives rise to an internal field that is parallel and proportional to the strong applied external field, Ho
. In this dissertation, the Knight shift is expressed in units of ppm (parts per million) and calculated by using the reference frequency due to an aqueous 1M solution of Al(NO3)3.
The Knight shift can be expressed as the sum of three dominant contributions,
s d orb
K K K K . (2.8)
31
that minimizes the energy. The presence of an applied external field results in a net magnetic moment of the conduction electrons and results in a Pauli paramagnetic susceptibility that is temperature independent since kT EF . Electrons in the s-band have a non-zero probability density,
F 2 (0)
E
, at the nucleus averaged over all states at the Fermi energy
F
E . This results in a Fermi-contact shift given by
F 2
s 8 / 3 (0) Pauli
E
K (2.9)
where Ω is the atomic volume and Pauliis the Pauli spin susceptibility due to conduction
electrons. In general, Ks is proportional to the nuclear charge given that
F 2 (0)
E
is larger
for heavier metals [32] and provides qualitative information regarding the amount of s -character of the conduction electrons . For example, pure aluminum with sp-electrons has a
s
K of ~1660 ppm [32]. This can be compared to ZrCuAl metallic glass alloys that have
s
K of ~300 ppm [33], which demonstrates their significantly smaller s-character.
In (2.8) the second term in the Knight shift,Kd, is caused by transition metals due to a
polarization of the d-electrons by the external field Ho
and provides an indirect s-d exchange interaction with the s-conduction electrons described by
d d d Pauli
K (2.10)
where d is the hyperfine coupling constant and d Pauli
is the d-electron Pauli susceptibility.
The third term, Korb, is the orbital shift contribution
orb orb orb
32
derived from the orbital moment induced in occupied conduction electron states, where orb is the orbital susceptibility and orb is the coupling constant. This second-order perturbation effect gives rise to magnetic shielding of the nucleus and is most important in transition metals with half-filled d-bands such as Nb, W, and Cr alloy systems [32].
2.3 Spin-Lattice Relaxation Time
The direct Fermi-contact interaction term given in (2.9) not only dominates the Knight shift and the magnetic susceptibility, but also provides a mechanism for the nucleus to undergo spin-lattice relaxation. For free electrons the rate of relaxation is given by the Korringa relation [34]
2 2
1
4
e
n B
K TT f
k
(2.12)
where K is the Knight shift, T1 is the spin-lattice relaxation time, T is the temperature,
e
and n are the electronic and nuclear gyromagnetic ratios and kB is the Boltzmann constant. The equation above also includes the enhancement factor f , which is ~1 for free electrons. For example, the enhancement factor is 1.2 for 27Al [32] . In alloys containing metals that have d or f-electrons, electron-electron interactions become more important. In Chapter 5, another mechanism arising from the motion of atoms that gives rise to spin lattice relation will be discussed.
2.4 Quadrupole Interactions
33
nuclear electric quadrupole moment eQ. Most nuclei on the periodic table have a nuclear spinI 1/ 2. This gives rise to a coupling between the quadrupole moment and the electric field gradient (EFG) generated by the local structure. In addition, this causes unequal splitting of the magnetic energy 2I1 levels. For example, 27Al has a spin I 5 / 2 and a quadrupole moment of 14.66 10 30m2 so quadrupole interactions are important for the metallic glass alloy systems considered in this thesis. This section reviews some basic theory regarding quadrupole interactions and how they are reflected in the NMR lineshape in addition to methods that quantify the interaction, which will be very useful in Chapter 4 [30, 32, 35].
As mentioned in Section 2.1 the interaction of a spin system with a strong external
field Ho
gives rise to a Zeeman interaction. The quadrupole interaction can therefore be treated as a perturbation of the Zeeman interaction. The EFG tensor V in the principal-axis system is given by:
0 0 0 0 0 0 xx yy zz V V V V , (2.13)
which satisfies Laplace’s equation Vxx VyyVzz 0. The largest component of the EFG is given by Vzz eq. For lower than cubic symmetries a dimensionless asymmetry parameter
can be defined xx yy
zz
V V V
, where 0 1.
34
consists of five m m1 transitions including the narrow 1/ 2 1/ 2 central
transition and wide satellite transitions m m1 (m 1/ 2). This is illustrated in Figure 2.1. The satellite transitions are broadened by the first-order quadrupole interaction given by the Hamiltonian
2 2 2
1
3 ( 1) 3cos 1 sin cos 2
12
Q Q z
H I I I (2.14)
where 3 2
2 (2 1)
Q
e qQ I I
is defined as the quadrupole frequency, and α and β are Euler angles
orienting the external field Ho
to the EFG. Fig. 2.1 shows that the spectral features are smeared out since all orientations of the EFG relative to the external field are possible in an amorphous system. Second-order quadrupole effects result in broadening of the central transition and will not be considered here.
35
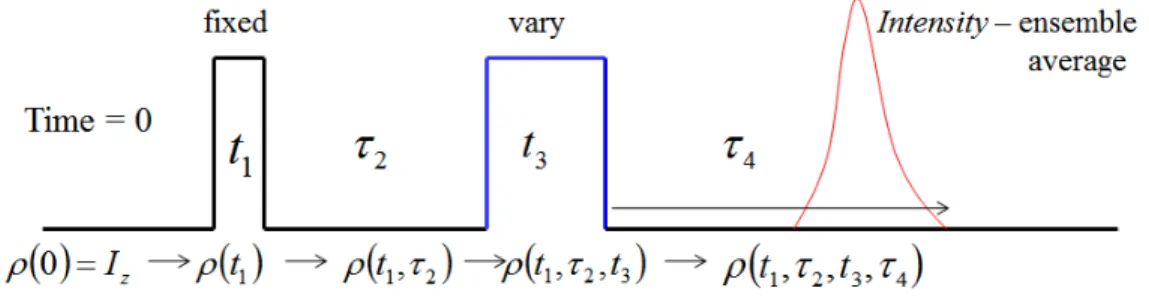
Quadrupole interactions cause fast transverse relaxation or spin-spin relaxation of the nuclear spins due to the large local EFG and give rise to broad spectra. A Hahn-echo [36] pulse sequence is often used in solid state NMR to recover any lost signal intensity due to relaxation and the dead time of the receiver. The Hahn-echo pulse sequence is illustrated in Figure 2.2 and is given by
1 2
3 4 y–t x – –t x – acquisition (2.15)
where t1 and t3 are pulse widths (on the order of s), x and -y are pulse and receiver phases,
respectively, τ1 and τ4 are time delays, and acquisition refers to data collection of the echo
signal. t1 flips the nuclear spins in the xy plane and t3 refocuses the spin magnetization to be
detected after coherence is lost during τ1. The echo signal appearing at τ2 = τ4 is recorded and
the signal intensity corresponds to the central and satellite transitions.
Figure 2.2 The two-pulse Hahn-echo pulse sequence development in the time domain. Nutation maps the evolution of the central and satellite transition intensities that are strongly dependent on the quadrupole interaction.
36
are accurately represented. NMR nutation [35] is an alternate method that can be used to quantify quadrupole interactions. Nutation methods have demonstrated much success in describing local structural changes at aluminum sites due to quadrupole interactions in ZrCuAl- and CeAlCu-based metallic glasses [37, 38] due to micro-alloying (minute changes of composition). Nutation is carried out by using the Hahn-echo sequence described in (2.15) and is more time efficient than extracting Qfrom a broad piecewise-constructed spectrum as shown in Fig. 2.1. Density operator formalism can be used to describe the interactions that take place during a Hahn-echo sequence. Fig. 2.2 shows the time-domain development of the density operator during the Hahn-echo sequence and the corresponding significant interactions. If second-order quadrupole interactions are neglected, the density matrix
1 2 3 4 ( , , , )t t
can be described in the rotating frame of the central transition:
( ) ( )
1 2 3 4 4 3 2 1
( ) ( )
1 2 3 4
( , , , ) exp exp t exp exp (0)
exp t exp exp t exp
x x
Q Q
x x
Q Q
t t iH iH iH iH t
iH iH iH iH
(2.16)
where
0 Iz, ( x)rf Q
CHAPTER 3
Local magnetism in (CuZr)93-xAl7Gdx Bulk Metallic Glasses 3.1 Introduction
38
In this Chapter, NMR is used to characterize the local anomalous magnetic behaviors in (CuZr)93-xAl7Gdx (x = 1, 2) bulk metallic glasses (BMGs) in the temperature range of 77-300
K. dependence on temperature of the nonlinear linewidth broadening was found and is attributed to strong spatial inhomogeneities in both the hyperfine coupling and bulk magnetic susceptibility due to local Gd3+ ions. This is also confirmed using magnetization measurements.
3.2 Magnetism in rare-earth metals
39 3.3 Experiments
BMG compositions (CuZr)93-xAl7Gdx (x = 1, 2) with good glass forming ability (GFA)
were fabricated into cylindrical rods using conventional copper mold casting [55]. The amorphous nature of these BMGs was confirmed by X-ray diffraction and differential scanning calorimetry (DSC). The RF penetration into BMG samples is finite and limited to
the skin depth, 2
2 f
[52] which causes a reduction in both the effective sample
volume and the signal intensity. Here is the resistivity, f is the NMR resonance frequency and is the magnetic permeability of the BMG under study. To maximize the filling factor or fraction of the coil detection volume filled with sample and overcome skin depth issues samples were prepared by crushing cylindrical rods into a powder which was packed into quartz tubes with Teflon tape.
27Al NMR experiments were performed in a magnetic field of 7.01 T in the temperature
40
41 3.4 Results and Discussion
3.4.1 NMR spectra for x = 1 and x = 2
NMR spectra were obtained using a Hahn-echo pulse sequence 90 180 detection. Detection of the significantly-broadened line of 27Al caused by Gd magnetic moments was done by implementing frequency-stepped Fourier-transform methods in the time domain [57] . NMR spectral data for each temperature were acquired by using five 0.1 MHz frequency steps in which echoes were shifted in the time domain to a common carrier frequency of 78.992 MHz. All the spectra for each frequency step were then obtained through Fourier transform processing and added together to obtain a single spectrum. 27Al Knight shifts were referenced to 1.0 M Al(NO3)3 aqueous solution.
Figure 3.1 shows an example 27Al NMR spectrum for x = 2. 27Al is a spin I 5 / 2
nucleus and, as mentioned in Chapter 2, its spectrum consists of five m m1
transitions including the narrow 1/ 2 1/ 2 central transition, broadened only by the
42
the Fermi level and Ks f is due to the transferred hyperfine interaction mediated by s-f exchange interactions between the localized f-electron spins and the spins of the s electrons.
s f
K is given by f
hf MA T where Ahf zHhf / (NA B ) is the hyperfine coupling constant and is generally assumed to be temperature independent [52]. Here, Hhf is the hyperfine field due to local moments, NA is Avogadro’s number, is the Bohr magneton, z is the number of Gd ions that are nearest neighbors to Al, and f
M T
is the bulk magnetic susceptibility due to localized Gd f moments.
10000 5000 0 -5000 -10000
Knight Shift (ppm)
5000 2500 0 -2500 -5000
300 K
77 K
Cu
45.5Zr
45.5Al
7Gd
2Figure 3.2 NMR frequency-shifted spectra for Cu45.5Zr45.5Al7Gd2 at 300 K and 77 K for
43 3.4.2 Non-linear spectral linewidth broadening
In general, paramagnetic alloy systems are known to have homogenous magnetic character (i.e. Curie temperature of ~0K, linear isothermal magnetization curves, absence of cusp in AC susceptibility measurements, etc.). Such paramagnetic behavior would be reflected in NMR measurements as a linear dependence of the full-width at half max (FWHM) or linear spectral linewidth on temperature. This would mean that in the case of dipolar or RKKY magnetic interactions the linewidth would be directly proportional to the local time-averaged value of the magnetic moment 1
z
S T as the temperature is lowered [58]. Surprisingly, NMR studies of paramagnetic alloy systems (CuZr)93-xAl7Gdx for x = 1 &
2 [16, 59] demonstrate a nonlinear dependence of linewidth on temperature. Figures 3.3 (a) and (b) below show the non-linear linewidth broadening commencing at high temperatures.
Figure 3.3 (a) & (b) Spectral linewidth for (CuZr)92Al7Gd1 and (CuZr)91Al7Gd2. Dashed
44
previously been evaluated using NMR shift and linewidth data [60]. Assuming Ahf and are not correlated, the Knight shift can be expressed as an average over all distributions of hyperfine coupling constants and local magnetic susceptibilities K Ahf [60, 61]. Due to the amorphous nature of these BMGs under study, different local environments at 27Al sites are anticipated to induce a spread in susceptibilities and result in nonlinear line broadening. This line broadening can be evaluated by calculating the experimental fractional NMR linewidth [60], which is expressed as
2
1/22
/ s f rms/ hf / hf
rms
k K A A (1)
where k is the 27Al NMR linewidth. Temperature-independent / | | s f
k K values are expected in magnetically-homogenous alloys due to spatially-independent local susceptibilities in purely paramagnetic systems.
The behavior of line broadening is shown in Figure 3.4 (a) below, which displays values of the ratio k K/ s f versus bulk magnetic susceptibility with temperature for x = 1 as an implicit parameter ranging from 77-300 K. Here Ks f was obtained by subtracting the Fermi-contact shift Ks of 342 ppm for x = 1 and 330 ppm for x = 2 as determined from the y-intercept of Kiso plotted against.This value agrees with the shift value observed in the x = 0 sample ((CuZr)93Al7). In addition, the second-order quadrupole broadening of the central
45 0.0004 0.0008 0.0012
2 3 4 5 6 /|K s-f | Susceptibility (emu/mole)
T = 120 K (a)
x = 1
0.0006 0.0012 0.0018 0.0024 0.0030 7
8 9 10 11
x = 2
/|K is o | Susceptibility (emu/mole) T = 160 K
(b)
Figure 3.4 /k Ks f versus for x = 1 (a) and x = 2 (b) with temperature as an implicit parameter after conduction-electron Knight shift and second order quadrupolar broadening corrections. The dashed lines indicate pure paramagnetic behavior between Gd ions.
46
demonstrates a similar NMR linewidth enhancement occurring at a higher temperature of ~ 160 K with a corresponding non-zero distribution of Ahf denoted by an offset of ~ 7.75. The anomalies span a wider temperature range for x = 2, which may be due to the twofold increase in the number of magnetic moments. Proportionality between k K/ s f and confirms that the linewidth dependence on temperature is significantly stronger than are paramagnetic effects caused by RKKY coupling between individual Gd spins and host Al nuclei [58].
In general, the distribution of susceptibilities and Ahf for this alloy system is not entirely unexpected since the spatially-disordered nature of these BMGs is expected to give rise to a distribution in the magnetic environments due to fluctuations of local interatomic distances and atomic coordination [15]. Interestingly, k K/ s f is observed to saturate near 77K for both compositions and suggests that a magnetic susceptibility distribution develops only over a narrow temperature range between 160-77 and 120-77 degrees for x = 1 and 2, respectively. The nature of these susceptibility distributions is further elaborated upon through magnetization experiments.
3.4.3 Hyperfine field temperature dependence
47
would suggest that these couplings might have various strengths in temperature and space. The linear behavior demonstrated in both x = 1 and x = 2 shows that Ahf is temperature independent and is not the source of non-linear NMR linewidth broadening in the temperature range of 77-300 K.
0.0000 0.0004 0.0008 0.0012
-300 -250 -200 -150 -100 -50 0 K s-f (p pm ) Susceptibility (emu/mole) (a)
0.000 0.001 0.002 0.003
-350 -300 -250 -200 -150 -100 -50 0 K s-f (p pm) Susceptibility (emu/mole) (b)
Figure 3.5 for x = 1 (a) and x = 2 (b) displays Ks f versus with temperature as an implicit parameter. The behavior of Ahf is inferred from the slope.
3.4.4 Magnetization Measurements
48
x =1 and (-5 ± 1) K for x = 2 demonstrating anti-ferromagnetic short-range order. The Curie constants obtained from the extrapolated fit yield an effective moment of 9.9 B for x = 1 and 10.0 B for x = 2. These values of effective moment are much larger than the 7.94 B for localized Gd+3 ions. An enhancement of the effective moment could originate from the
effect of 5d conduction electron polarization [64] .
0
50
100
150
200
250
300
0
500
1000
1500
2000
2500
3000
0 15 30 45
0 150 300 450
(T.
m
ol/emu
)
x = 2
Temperature (K)
x = 1 x = 1
Figure 3.6 The magnetic susceptibility1 versus T for x = 1 and 2at 10,000 Oe.
The dashed lines are linear extrapolations of the susceptibility at high temperatures giving paramagnetic Curie temperatures of (-30 ± 1) K for x = 1 and (-5 ± 1) K for x = 2. The inset contains trial fits (black solid) at low temperature to test the possibility of the “Griffiths phase”. Fits to 1
10
T T T
yield values of -0.52 and -0.33 for x = 1 and x = 2, respectively, and do not meet the criteria of the Griffiths magnetization scaling law where
49
The low-temperature behavior of the magnetic susceptibility suggests a broad range of inter-cluster interactions centered on T = 0 K that is largely reminiscent of spin glass or cluster-glass behavior observed in YAlGd, ZrCuGd, LaGdAu, and MgGdZn amorphous systems [14, 16]. The importance of short-range clusters in the high-temperature paramagnetic regime is emphasized by the enhanced effective moments for x = 1 and x = 2 obtained from the Curie constants that are larger than 7.94 B for localized Gd+3 ions. This
suggests the presence of short-range magnetic correlations as seen in Griffiths systems, including randomly-doped manganites and heavy-fermion alloys [46, 65, 66]. The Griffiths phase is characterized by regions that have pre-formed magnetic clusters that grow in number with a decrease in temperature [65]. Although this gives rise to a globally paramagnetic state, locally there are competing interactions. Trials fits to the low temperature susceptibility data in the “Griffith’s phase” are shown in the inset of Fig. 3.6 and demonstrate that local magnetic characteristics in these BMGs are not in agreement with Griffiths scaling behavior characterized by 1
10
T T T
[48]. The expected value for the Griffiths phase is
0 1whereas the fitting yields values of -0.52 and -0.33 for x = 1 and x = 2, respectively.
50
0 20000 40000 60000
0.00 0.25 0.50 0.75 1.00 1.25 1.50
B/ G
d at.
H (Oe)
80 K 300 K x = 1x = 1 x = 2 x = 2
Figure 3.7 Magnetization isotherms for x = 1 and x = 2 at 80 K and 300 K for fields up to 70,000 Oe show paramagnetic behavior. Credit: Magnetization measurements of samples were carried out by J.Q. Wang at the Chinese Academy of Sciences.
0
20000
40000
60000
0
1
2
3
4
5
6
7
B/ Gd at.
H (Oe)
x = 1 x = 2
Brillouin - 7B
2 K
51
susceptibility inhomogeneities at high temperatures, inspection of Fig. 3.7 and Fig. 3.8 reveals that isotherms at 80 K and 300 K exhibit purely paramagnetic behavior. Fig. 3.8 also shows that at 2K the magnetization does not reach saturation even at the maximum applied field and displays non-Brillouin behavior possibly due to frustrated RKKY magnetic correlations as also observed in amorphous spin-glass systems [50, 67]. Random magnetic anisotropies are not expected to play an important role in suppressing the magnetization due to a non-existent orbital angular momentum (J S L, 0).
3.4.5 Spin-glass-like behavior
A comparison to RKKY theory for spin-glass for the dilute impurity limit can be made using the relationship for reduced magnetization [68] given by
0
1 2 / 3 2 1 / B
M V n J g H , which is valid for V n0 gB and g HB k TB where n is the impurity number density and V0 is the amplitude of the RKKY interaction strength. Figure 3.9 shows the saturation moment for x = 1 and 2 as obtained from a linear extrapolation of 1
versus
M H at high fields (60 - 70 kOe) at 2 K. For x = 1, the saturation moment of 7.9 B is larger than the expected value of 7.0 B for Gd+3 and may be attributed to magnetic short-range order, as implied by the high-temperature molar susceptibility fits given in Fig. 3.6, or conduction electron polarization as seen in Gd-La and Gd-Y alloys [69, 71]. The relevance of evaluating isothermal magnetization data in this way was further verified using the y-intercept of 1
versus
52
0.0
0.4
0.8
1.2
1.6
7.2
7.3
7.4
7.5
7.6
7.7
7.8
7.9
8.0
8.1
H
-1(Oe
-1x 10
-5)
B
/ Gd at.)
x = 1
x = 2
Figure 3.9 A linear extrapolation of M versus H1at high fields (60-70 kOe) results in a large saturation moment of 7.9 B and 8.1 B for x = 1 and 2, respectively.
characteristics in this BMG system. The saturation behavior for x = 2 yields a similarly larger moment of 8.1B. Interestingly, a field much greater than 70,000 Oe is necessary to obtain saturation at 2 K which strongly suggests the importance of frustration such as spin-glass behavior in CuZrGd alloy systems [44] although past studies of similar BMG systems and recent AC susceptibility measurements confirm that x = 1 and 2 remain paramagnetic down to 2K [16, 59]. The slope determined from the linear fit gives 38
0 3 10
V and 2.3 10 38 erg cm3 for x = 1 and x = 2, respectively. For a free electron the Fermi energies are estimated to be EF 9.34eV and 9.40 eV and the exchange integral Js f can be determined from
2 3 2
032 2 / 9 1
s f F F
53
CuZrGd [44] with considerably higher Gd concentration and in (La, Gd)Al [69] alloy systems containing comparable Gd content. It is interesting to note that a smaller Gd content (x = 1) yields a slightly stronger interaction strength, which is consistent with the NMR and susceptibility measurements.
3.5 Conclusions
In general, NMR and magnetization measurements both confirm the development and the importance of AF short-range order of (CuZr)93-xAl7Gdx glasses with x = 1 and 2,
beginning at high temperatures near 150K. This is supported by the temperature-independent hyperfine couplings Ahf for x = 1 and x = 2 that show the source of broadening is due to the local magnetic susceptibility distribution at high temperatures. Non-linear linewidth broadening shown in Fig. 3 (a) and (b) clearly proves that this distribution is prominent at high temperatures and evolves over a narrow temperature range (40-80 degrees). Furthermore, non-Brillouin isothermal magnetization behavior at low temperatures seems to suggest that the AF cluster development in both x = 1 and 2 is magnetically frustrated. The intra-cluster interaction strength for x = 1 and 2, as determined by the exchange integral Js f , shows that this frustration is quite strong as it is considerably higher than other Gd-bearing amorphous systems [44, 69] showing long-range spin-glass behavior.
CHAPTER 4
Anelastic deformation of La-based metallic glasses
4.1 Introduction: Free Volume and Shear Transformation Zones (STZs)
One of the great challenges in the study of bulk metallic glasses (BMGs) is a basic understanding of the deformation mechanism in amorphous systems where dislocations are absent [71]. Plastic flow in metallic glasses can proceed by two mechanisms: inhomogenous and homogenous deformation [18]. Inhomogenous deformation takes place at low temperatures and high stresses resulting in highly localized shear banding (at 45o with respect to the tensile axis), since only a small fraction of the volume of the sample participates in flow [18]. At low stress and higher temperatures (near Tg) the entire volume of the sample
55
defects that have a definite slip plane [75]. This Chapter will focus on using NMR to understand the anelastic response to homogenous deformation1.
Figure 4.1 Schematic illustrating the two deformation mechanisms observed in metallic glasses. Shear transformation zones (STZs) correspond to the regions of local atomic rearrangements that take place during a shear.
Phenomenological models of inelastic deformation describe the fundamental flow mechanism in metallic glass as a process involving a local rearrangement of atoms that accommodates strain though single-atomic diffusion [18] or as a cooperative shear process of atomic clusters referred to as shear-transformation zones (STZs) [19]. This is also illustrated in Fig. 4.1. These deformation mechanisms are believed to be facilitated by a distribution of
56
free volume [76] that is a widely-used scalar parameter for quantifying structural relaxation [1] and creep kinetics [77, 78] in metallic glass. Free volume is defined as the volume that is in excess of the material’s corresponding crystalline state or ideally-ordered structural state. The red highlighted areas in Fig. 4.1 represent STZs that are in close proximity to regions of large free volume and therefore can easily undergo shear. Due to the amorphous nature of metallic glass, there is believed to be a continuous distribution of different local structure and free volume [73]. In essence, this is what makes up the defects in metallic glass [73, 79].
Figure 4.2 At the atomic-level, local regions of metallic glass have symmetric free energies
. Applying a stress lowers the free energy by in the direction of shear and causes atomic rearrangements [80].
57
application of shear stress induces an asymmetry of the local free energy by an amount and causes mechanical polarization of STZs. This effectively increases the probability for atoms to reshuffle along the direction of shear. Backward atomic shuffling is possible, but has a much lower probability [80].
During an applied stress local regions that are sheared are not isolated. STZs are embedded in an elastic surrounding that exerts a back stress on the transformed volume. The back stress developed during anelastic deformation is anticipated to aid in the macroscopic recovery of the shape when the applied stress is released [73]. This gives rise to delayed-elastic or andelayed-elastic recovery. Previous studies have shown that the andelayed-elastic recovery of glass exhibits a continuous spectrum of activation energies and relaxation times [73, 74] reflecting the resulting distortion of free volume and local structural distribution due to STZs. If two or more neighboring transformed STZs emerge and interact with each other, dissipative release of the back stress could occur resulting in viscoplasticity [81]. This chapter will cover the anelastic response of La-based metallic glass to constant compression at room temperature.
4.2 Experiments: Constant Compression, Modulated Differential Scanning Calorimetry, and NMR
For constant compression experiments, La50Ni15Al35 BMG rods 3mm in diameter and ~6
58
could be obtained at high stress by applying a stress just below the yield strength [77]. The samples were therefore compressed at a strain rate of 1 10 s 4 1 (Instron electromechanical testing system 3384) to a stress equal to 0.90 of the metallic-glass yield strength ( 900 Mpa), and held at this stress for 10, 24, and 48 hours. The effect of different stress was also explored by studying rods that were compressed for 24 hours at a stress equal to 0.80 ( 800 Mpa) and 0.90 ( 900 Mpa) of the metallic-glass yield strength. The amorphous nature of these BMGs was confirmed using DSC and X-ray diffraction. An as-cast rod (no mechanical treatment) and a rod annealed at Tg – 20 (240 oC) degrees for 48
hours were used as reference samples. SEM of the rods after compression confirmed the absence of any inhomogenous deformation development such as cracking or localized shear banding. Figure 4.3 shows some SEM images of the rods after mechanical treatment.
Figure 4.3 (a) and (b) SEM images of a compressed BMG rod at 900 MPa for 24 hours.
59
amorphous systems [83]. These diffraction peaks are compared to those of the sample mechanically treated at 900 MPa, which shows no obvious sign of crystallization.
Figure 4.4 X-ray diffraction of a BMG sample compressed at 900 MPa for 24 hours compared with an as-cast BMG sample.
The compression experiments and length measurements made using a micrometer were
carried out by Haibo Ke at the Chinese Academy of Sciences. Figure 4.5 shows an example
of a strain curve for constant compression at room temperature for 24 hours. The strain
response is characterized by three components: elastic (~ 1.90%), anelastic (~0.10%), and a
sum of viscoplastic and anelastic (~0.04%) components [72]. It is important to note that
anelastic strain continues even at the onset of viscoplastic strain [72]. Table 4.1 summarizes
60
compression, and 10 and 24 hours after the 24-hour compression. The micrometer used
has a length scale of 10-6 m. The average irreversible strain determined after 24 hours is
~0.03% also in agreement with Fig. 4.5.
Figure 4.5 (a) Room temperature constant-compression experiments for 24 hours. The elastic (~1.90%), anelastic (~0.10%) (delayed elastic), and anelastic and viscoplastic strain (~0.04%) responses are noted. Credit: Mechanical treatment of BMG rods were carried out by Haibo Ke at Chinese Academy of Sciences.
For each sample the anelastic and viscoplastic components were also verified systematically
by micrometer measurements after unloading and well after macroscopic recovery (>48 hrs).
27Al NMR nutation experiments were performed in a magnetic field of 8.9 T at 300 K.
Nutation was performed using Hahn-echo pulse sequence
![Figure 3.1 Schematic of Oxford Helium Variox Cryostat that operates between 1.3 and 300K [56]](https://thumb-us.123doks.com/thumbv2/123dok_us/8276863.2191983/40.918.254.720.168.946/figure-schematic-oxford-helium-variox-cryostat-operates-k.webp)