3D IMAGE ANALYSIS OF OPEN FOAMS USING RANDOM
TESSELLATIONS
C
LAUDIAL
AUTENSACK ANDT
ETYANAS
YCHFraunhofer-Institut f¨ur Techno- und Wirtschaftsmathematik (ITWM), Fraunhofer-Platz 1, D-67663 Kaiserslautern
e-mail: [email protected], [email protected]
(Accepted May 11, 2006)
ABSTRACT
Volume image analysis provides a number of methods for the characterization of the microstructure of open foams. Mean values of characteristics of the edge system are measured directly from the volume image. Further characteristics like the intensity and mean size of the cells are obtained using model assumptions where the edge system of the foam is interpreted as a realization of a random closed set. Macroscopically homogeneous random tessellations provide a suitable model for foam structures. However, their cells often lack the degree of regularity observed in real data. In this respect some deterministic models seem to be closer to realistic structures, although they do not capture the microscopic heterogeneity of real foams. In this paper, the influence of the model choice on the obtained mean values is studied. Moreover, a method for reconstruction of the cells of an open foam from its edge system is described and tested for the tessellations under consideration.
Keywords: foam structures, image analysis, Minkowski functionals, random tessellations, volume images, Voronoi tessellation.
INTRODUCTION
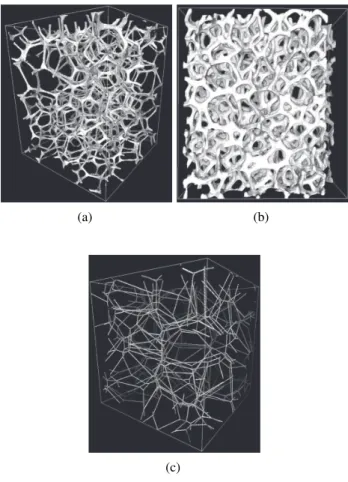
Foams (polymer, ceramic or metal) are new materials of high interest in a wide range of application areas. Due to high porosity, stiffness, and compliance, they are useful for constructione.g., of filters or crash absorbers. Foams are characterized by polyhedral cells forming a space-filling structure. They are classified as either “open-cell” with a strut-like morphology forming a continuous network, or as “closed-cell” with solid membrane-like faces. As the properties of a foam depend on the geometric characteristics of its cells, one is interested in measuring those quantities. Classical metallographic methods using two-dimensional images of cross sections are less suitable for foams. Due to their high porosity, the preparation of sections is extremely complicated and can destroy the features of the microstructure. On the other hand, computer micro-tomography (µCT) provides high quality three-dimensional images of foam structures. Reconstructed topological images of typical foam structures are shown in Fig. 1. Various tools for deriving the desired values from these images have been developed during the last years.
In Lautensack and Sych (2005) two methods for obtaining cell characteristics of an open foam using a three-dimensional image of its edge system have been considered. One of these is based on measuring the Minkowski functionals of the edge system.
Using model assumptions, these measurements can be used to compute the mean values of the cell characteristics of the open foam. However, in many cases one is not only interested in information on the mean values but also on the distribution of cell characteristics. Therefore, image processing tools are used for reconstruction of the cells. Distributions of cell characteristics can then be determined by measuring the desired properties of each of the reconstructed cells.
In this paper, the dependency of the results on the model choice as well as the geometric structure (e.g., the degree of regularity of the cells) of the analyzed foam is studied. To this end, both methods are applied to three-dimensional images of realizations of the model structures under consideration.
GEOMETRIC MODELS FOR
OPEN FOAMS
Open foams can be interpreted as the edge system of a spatial tessellation. To reproduce properties of real foams, this tessellation should be macroscopically homogeneous but microscopically heterogeneous and feature mainly pentagonal faces. Three models are studied here, two of which are stochastic and one is deterministic. The two stochastic models both belong to the class of Voronoi tessellations. Randomly placed seeds start to grow at the same time and at uniform rate. The growth stops when two cells meet (Okabe
et al., 2000, Chapter 2). The easiest and best known model is the Voronoi tessellation with respect to a homogeneous Poisson point process (Stoyan et al., 1995, Section 2.4.). It is achieved using independently uniformly distributed seeds. However, the cells of a Poisson Voronoi tessellation do not show the degree of regularity (measured for example by the coefficient of variation of cell volumes or shapes) and the tendency to pentagonal faces observed in real data. More regular cells are obtained if the seeds satisfy some hard core condition, i.e., there are no points closer than a fixed distance from each other. Here, the Voronoi tessellation with respect to a Mat´ern hard core point process (Stoyan et al., 1995, Section 5.4.) is used. However, it does not overcome this problem to a satisfying degree.
Some deterministic models seem to be more suitable for capturing the regularity of open foams. We use the Weaire-Phelan foam (Weaire, 1996) whose cells are pentagonal dodecahedra and tetradecahedra having two hexagonal and 12 pentagonal faces. However, the regularity of this model is paid for by the complete loss of microscopic heterogeneity.
ANALYSIS USING MINKOWSKI
FUNCTIONALS
For analysis of foam structures, a basic set of characteristics from integral geometry is used -the Minkowski functionals (or quermass integrals or intrinsic volumes). In three-dimensional space, these are volume, surface area, integral of mean curvature, and integral of total curvature, also called Gaussian curvature. For homogeneous structures, these functionals are completely determined by their densities, which are
(a) (b)
(c)
Fig. 1. Reconstructed tomographic images of a polymer foam (resolution5µm) (a) and an open nickel foam (resolution10µm) (b), visualization of the edge system of a Poisson Voronoi tessellation (c).
– VV - the volume density (the volume fraction or the specific volume)
– SV - the surface density (the specific surface area) – MV - the density of the integral of mean curvature
(the specific integral of mean curvature)
– KV - the density of the integral of total curvature (the specific integral of total curvature).
Details can be found in Ohser and M¨ucklich (2000), Schneider and Weil (2000) or Stoyanet al.(1995).
Segmentation of a three-dimensional image of a foam structure results in a black-and-white-image of the edge system of the foam. Using methods described in Lang et al. (2001), the densities of the Minkowski functionals can then be estimated from this image. From these values, other characteristics can be deduced. For open foams, the length density of the edge system LV =MV/(π(1−VV)) is of particular
interest.
diameter) of the cells, model assumptions have to be introduced. Knowing the geometry of the typical cell of the foam model under consideration, these mean values can then be calculated from the measured value ofLV. For the Voronoi tessellations this is shown in Ohser and M¨ucklich (2000, Section 10.3.2), for the Weaire-Phelan foam see Sych (2004). In the present work, the dependency of the obtained mean values on the choice of the model assumptions is studied.
RECONSTRUCTION OF CELLS
In order to derive empirical distributions of size, shape or other features of the cells, the cells have to be reconstructed using image analysis tools. Again, the edge system of the foam is segmented. To the resulting black-and-white image, a Euclidean distance transform is applied assigning each background pixel its distance to the edge system (Cuisenaire, 1999). Ideally, this yields local maxima exactly at the cell centers. In practice, superfluous local maxima have to be removed using filters or morphological transformations. Finally, the watershed algorithm (Vincent and Soille, 1991) divides the inverted distance image into cells. This algorithm can be imagined as flooding the topographic representation of a gray value image with water. The water flows down the steepest slope path until reaching a local minimum. All points whose steepest slope path reaches a given local minimum form the catchment basin (cell) associated with this minimum. Neighboring catchment basins are separated by a watershed which represents the boundary of the cells. A discussion of this method, which is state-of-the-art in 2d image processing, can be found in the book by Soille (1999). The processing chain has been applied to 3D µCT-images of solid foams e.g., by Thieme et al. (2003), Brunke et al.
(2004), and Godehardtet al. (2004). We applied it to 3D images of the edge system of a Poisson Voronoi tessellation and the Weaire-Phelan foam. Sections of the resulting 3D images are shown in Figs. 2 and 3.
SIMULATION METHODS
Samples of each of the three model structures under consideration (Poisson Voronoi (PV), hard core Voronoi (HCV) and Weaire-Phelan (WP)) with an intensity of 216 cells in a cube of side lengths =1 are created. Periodic boundary conditions are used in order to avoid boundary effects. 30 realizations of a Poisson Voronoi tessellation are calculated analytically using the Qhull software package (Barber et al., 1996). Discretized versions of the edge system of
the tessellation are drawn to a three-dimensional binary image of size 5123. The characteristics of the
edge system are estimated with the MAVI software package (MAVI, 2005) using each of the three model assumptions. Since the sufficient conditions for unbiased estimation are not met (Ohser and Nagel, 1996), the resolution correction introduced in Ohser and M¨ucklich (2000, Section 10.3.2) is used. For an evaluation of the method, the values are compared to the ones calculated from the analytic representation of the structure. The same is done for the Voronoi tessellation with respect to a Mat´ern hard core process with hard core parameterr=0.051. For the choice ofr see Ohser and M¨ucklich (2000, Section 10.3.2). Since the Weaire-Phelan partition is deterministic, only one image has to be analyzed for this model. Again, the edge system is drawn to a 5123 binary image. Then
we proceed as described above. For comparison, the theoretical values of the cell characteristics are used.
In order to test the reconstruction method, it is applied to the images of the edge systems of one of the Poisson Voronoi realizations and of the Weaire-Phelan foam. Since we already start with binary images, there is no need for a binarization step. To avoid oversegmentation, superfluous local minima have to be removed from the inverted distance image. This is particularly important for irregular structures like the Poisson Voronoi tessellation. Smoothing filters are a fast and simple possibility. However, their disadvantage is that, up to a certain degree, they remove all local minima, including relevant ones. Geodesic transformations are better adapted to this problem. Here, the h-minima function (Soille, 1999, Section 6.4.4) is used. This transformation fills basins containing local minima until either the value of the minimum is increased by a given value h or the value of the closest local maximum is reached. Thus, by the parameter h, the suppression of superfluous local minima can be controlled without influence on relevant local extrema. The value of h is chosen according to the expected distance of the cell centers to the boundaries. We usedh=1400 (65536 gray values) for the Poisson Voronoi tessellation and h=25 (256 gray values) for the Weaire-Phelan foam.
The other method uses the 13 directions given in a cubic grid, namely three coordinate directions, six face diagonals and four space diagonals of the unit cell. The diameters of a given cell in each of these 13 directions are determined. Their mean is used as an estimator for the mean breadth of the cell. Usually, the first method is the better choice. Since periodic boundary conditions are used, all cells can be included in the statistics and there is no need for any boundary corrections. Results are summarized in the next section.
(a) (b)
(c) (d)
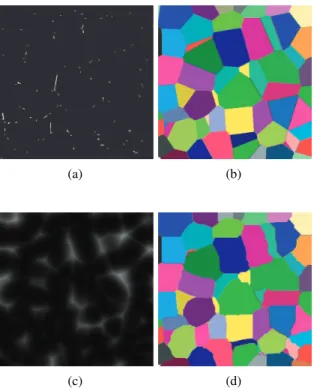
Fig. 2. 2D sections of the edge system of a Poisson Voronoi tessellation (a), its cells (b), the distance image (c) and the reconstructed cells (d).
RESULTS
The cell characteristics measured for the PV, HCV resp. WP structures are shown in Tables 1, 2 and 3, respectively. As expected, for the PV and the WP model the best results are obtained using the correct model assumptions. However, in the WP case the deviations are higher than in the PV case. For the HCV model the values obtained with the PV model assumptions are closest to the true ones. This can be explained as follows. A resolution correction has been used to avoid underestimation ofLV, which obviously works well for the PV model. For more regular structures such as the HCV and the WP model, this
correction tends to overcorrect the values. Therefore, the value ofLV is overestimated, but still closer to the true value than without resolution correction. A choice of a lower resolution of the images would have led to better results in these cases. In simulations it turned out that the error due to an inappropriate choice of model assumptions is smaller than the error caused by resolution effects.
(a) (b)
(c) (d)
Fig. 3. 2D sections of the edge system of a Weaire Phelan foam (a), its cells (b), the distance image (c) and the reconstructed cells (d).
Table 1.Results for Poisson Voronoi tessellation (PV) using PV, HCV and WP model assumptions. The mean values of 30 realizations are given. The length unit s is the side length of the cubical observation window.
True
value PV Dev.[%] HCV Dev.[%] WP Dev.[%]
Mean number of cells per volume unit
216 214.70 -0.60 220.68 +2.17 244.34 +13.12
Mean cell
volume[(0.1s)3] 4.630 4.658 +0.60 4.532 -2.12 4.093 -11.60 Mean cell
diameter[s] 0.2431 0.2435 +0.16 0.2384 -1.93 0.2405 -1.07
Mean area
of faces[s2] 0.01042 0.01045 +0.29 0.01018 -2.30 0.01009 -3.17
Table 2.Results for hard core Voronoi tessellation (HCV) using PV, HCV and WP model assumptions. The mean values of 30 realizations are given.
True
value PV Dev.[%] HCV Dev.[%] WP Dev.[%]
Mean number of cells per volume unit
215.83 214.56 -0.58 220.55 +2.19 244.19 +13.14
Mean cell
volume[(0.1s)3] 4.649 4.675 +0.56 4.548 -2.17 4.108 -11.64 Mean cell
diameter[s] 0.2431 0.2437 +0.25 0.2386 -1.85 0.2407 -0.99
Mean area
of faces[s2] 0.01044 0.01047 +0.29 0.01020 -2.30 0.01011 -3.16
Table 3.Results for Weaire-Phelan foam (WP) using PV, HCV and WP model assumptions.
Theor.
value PV Dev.[%] HCV Dev.[%] WP Dev.[%]
Mean number of cells per volume unit
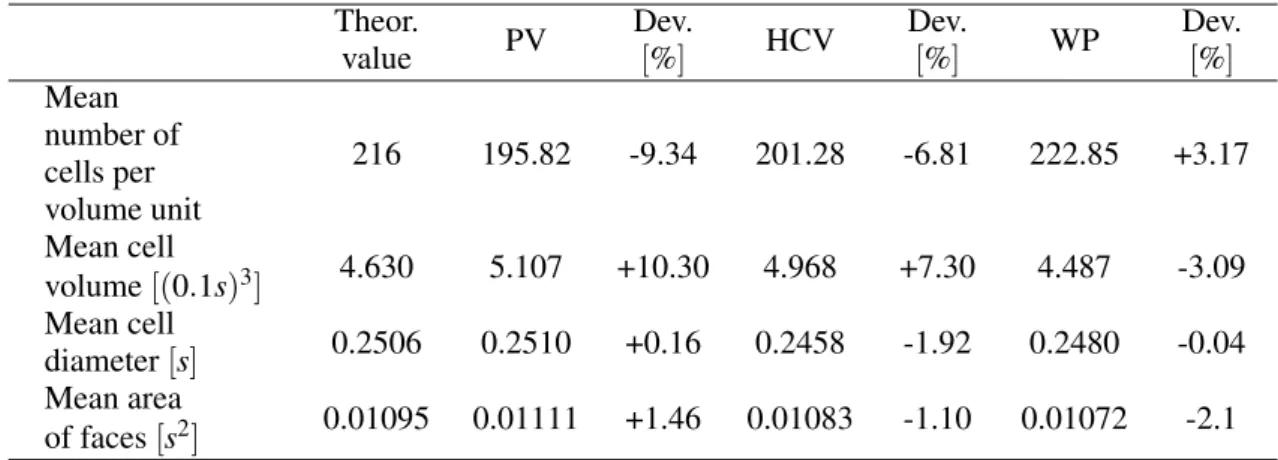
216 195.82 -9.34 201.28 -6.81 222.85 +3.17
Mean cell
volume[(0.1s)3] 4.630 5.107 +10.30 4.968 +7.30 4.487 -3.09 Mean cell
diameter[s] 0.2506 0.2510 +0.16 0.2458 -1.92 0.2480 -0.04
Mean area
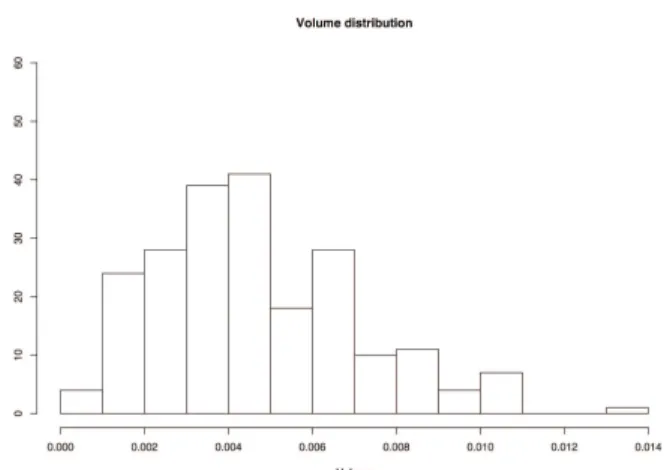
Fig. 5. Volume distribution of reconstructed Poisson Voronoi cells, volume unit is s3.
Fig. 6. Diameter distribution of original Poisson Voronoi cells, length unit is s.
Fig. 7.Diameter distribution of reconstructed Poisson Voronoi cells, length unit is s.
Table 4. Results from 3D cell reconstruction of PV tessellation compared to analysis using Minkowski functionals.
True
value Mink.funct. reconstr.Cell Mean cell
volume[s3] 0.0046 0.0046 0.0046 Mean cell
diameter[s] 0.2435 0.2425 0.2431
Table 5.Results from 3D cell reconstruction of Weaire-Phelan foam compared to analysis using Minkowski functionals.
Theor.
value Mink.funct. reconstr.Cell Mean cell
volume[s3] 0.00463 0.00448 0.00462 Mean cell
diameter[s] 0.2506 0.2480 0.2514
Hence, this result can be considered optimal, since a change of parameters in the reconstruction procedure would increase the number of either smaller or bigger cells. The spread of distributions is a natural effect of cell reconstruction and has to be taken into account when evaluating results.
DISCUSSION
Volume image analysis is a promising tool for gaining insight into the microstructure of foams. In this paper, methods for measuring cell characteristics of an open foam from a three-dimensional image have been described and evaluated. Both methods yield satisfying results for the cell characteristics of the model structures under consideration. However, several fields for further research arise. As expected, image resolution is an important factor for the quality of the results. A better understanding of resolution effects might lead to a recommendation concerning the choice of resolution or even a refined method for error correction. Since periodic boundary conditions have been used throughout this paper, there was no need for any further edge treatment. When working with real data, one will have to provide an appropriate method to avoid edge effects. Finally, the field of model choice still holds several open questions. A model structure combining microscopic heterogeneity and regularity of the cells would be desirable. Possible candidates might be a random version of the Weaire-Phelan foam or random Laguerre tessellations. However, for the time being, formulas for the cell characteristics of those structures are not available.
ACKNOWLEDGEMENTS
The authors wish to thank Katja Schladitz for her advice and helpful discussions during the preparation of this paper. We also thank the MAVI team at the Fraunhofer ITWM Kaiserslautern for providing this software package. The tomographic images were taken by Sven Gondrom (Fraunhofer IZFP Saarbr¨ucken, nickel foam) and Bernhard Heneka (Micro & Analytic GmbH, polymer foam).
REFERENCES
Barber CB, Dobkin DP, Huhdanpaa HT (1996). The Quickhull algorithm for convex hulls. ACM Trans Math Soft 22(4):469-483, http://www.qhull.org
Brunke O, Odenbach S, Beckmann F (2004). Structural characterization of aluminium foams by means of micro computed tomography. In SPIE: Developments in X-Ray Tomography IV. Denver: SPIE Press. 5535.453-63.
Cuisenaire O (1999). Distance transformations: fast algorithms and applications to medical image processing, PhD thesis, Universit´e catholique de Louvain, Louvain, http://ltswww.epfl.ch/˜cuisenai. Fraunhofer ITWM, Department Models and
Algorithms in Image Processing (2005). MAVI – Modular Algorithms for Volume Images, http://www.itwm.fhg.de/mab/projects/MAVI/.
Godehardt M, Schladitz K, Sych T (2004). Analysis of volume images - a tool for understanding the microstructure of foams. In: Symposium Cellular Metals and Polymers, October 2004, F¨urth.
Lang C, Ohser J, Hilfer R (2001). On the analysis of spatial binary images. J Microsc 203:303-13.
Lautensack C, Sych T (2005). 3D image analysis of foams using random tessellations. In: Proceedings of 9th European Congress on Stereology and Image Analysis and 7th STERMAT International Conference on Stereology and Image Analysis in Materials Science, Volume I, May 2005, Zakopane, 147-53.
Ohser J, Nagel W (1996). The estimation of the Euler-Poincar´e characteristic from observations on parallel sections. J Microsc 184:117-26.
Ohser J, M¨ucklich F (2000). Statistical Analysis of Microstructures in Materials Science. Chichester: Wiley.
Okabe A, Boots B, Sugihara K, Chiu SN (2000). Spatial tessellations - Concepts and Applications of Voronoi Diagrams. 2ndedition. Chichester: Wiley.
Schneider R, Weil W (2000). Stochastische Geometrie. Stuttgart, Leipzig: Teubner.
Soille P (1999). Morphological image analysis. Berlin: Springer.
Stoyan D, Kendall WS, Mecke J (1995). Stochastic Geometry and its Applications. 2ndedition. Chichester: Wiley.
Sych T (2004). Estimation of Geometric Characteristics of Foam Structures. Diploma thesis. Technische Universit¨at Kaiserslautern, ITWM Kaiserslautern. Thieme L, Godehardt M (2003). Three-Dimensional
Images and their Analysis - A New Method for the Characterization of Open Foams. Imaging Microsc 5:32-3.
Weaire D (1996). The Kelvin Problem: Foam Structures of Minimal Surface Area. London, Bristol: Taylor & Francis.