Oviedo University Press 7
Economics and Business Letters 8(1), 7-16, 2019
Exchange rate pass-through to import prices:
Evidence from Serbia
Safet Kurtović*
Faculty of Management and Business Economics, University of Travnik, Bosnia and Herzegovina
Received: 12 May 2018 Revised: 19 November 2018 Accepted: 22 November 2018
Abstract
In this paper we estimated the degree of exchange rate pass-through (ERPT) into aggregate import prices in Serbia. ERPT was determined by application of single equation, cointegration approach (ARDL model), error correction term (ECM) and VAR Granger Causality tests. We based our research on data from 2008Q1 to 2014Q4. The results of our research show partial pass-through in the short run; in the long run pass-through was not observed. In addition to that, we found that appreciation of the nominal effective exchange rate (NEER) led to significant pass-through asymmetry in the short run.
Keywords: import prices; exchange rate pass through; import; long run
JEL Classification Codes: F3, F4, F31
1. Introduction
During the last few decades, investigation of relation between exchange rate fluctuations and import prices has been given considerable attention in international economics and macroeco-nomics, from both the theoretical and empirical aspect (Lopez-Villavicencio and Mignon, 2017). According to early research that was based on the law of one price, changes in exchange rate had direct impact on import prices. On the other hand, according to recent research import prices depend on manner of determining a pricing strategy on different markets, i.e. on price mechanism based on margin oscillations in relation to marginal costs and other factors (Beck-mann et al, 2014).
During the last three decades, decline of pass-through has been obvious in most of the ana-lyzed cases. The degree of ERPT depends on economic shocks, nominal exchange rate volatil-ity, inflation rate, change in importing country’s demand, product substitution, market structure,
* E-mail: safetkurtovic71@yahoo.com.
Citation: Kurtović, S. (2019) Exchange rate pass-through to import prices: Evidence from Serbia, Economics and Business Letters, 8(1), 7-16.
gate import (Campa and Goldberg, 2002; Campa et al., 2005, Byrne et al., 2010;
Lopez-Villav-icencio and Mignon, 2017, Kurtovic et al., 2018).
Campa and Goldberg (2002; 2005) estimated transmission degree of ERPT into import prices of Euro Area countries. They came to a conclusion that ERPT was high and incomplete in the short run and that it was different from one country to another and from one industry to another. Barhoumi (2006) and Byrne et al., (2010) estimated the degree of ERPT into import prices of emerging and developing countries. They found the developing countries, emerging and Asian economies to have higher EPRT than in the developed ones. Jabar (2009) estimated the degree of ERPT into import prices of the USA in bilateral trade with the EU, Asian countries and Canada. He determined that ERPT was partial for all countries. María-Dolores (2010), Ben Cheikh and Rault (2017) estimated the degree of ERPT into import prices of 12 Euro Area countries and new member states of the EU and Turkey. They found higher ERPT only for the Slovenia and Cyprus.
The main objective of our research is to measure the effect of ERPT on Serbia's import prices.The problem of pass-through is especially important for small open economies that are import-dependent in international exchange. In that sense, Serbia is ranked among transition countries that have traditionally had negative trade balance and are import dependent (Figure 1). Serbia imports the most crude materials, inedible, except fuels, miscellaneous manufactured articles, chemicals and related products, machinery and transport equipment, while most ex-ported miscellaneous manufactured articles, machinery and transport equipment, manufactured goods and animal and vegetable oils (Figures 2-3). In terms of import, the leading trade partners are Italy, Germany, Bosnia and Herzegovina, Romania and the Russian Federation, whilst in terms of export the trade partners are Germany, Italy, the Russian Federation, China and Hun-gary. Being faced with trade imbalance, Serbian economy lacks competitiveness. Serbia often resorts to currency fluctuation in order to restore its trade balance. It is hence exceptionally important to measure the effect of ERPT into import prices. A low ERPT leads to low inflation. On the other hand, a low ERPT could also cause trade imbalance when there is a requirement to change the import or export composition and impair competitiveness in the international trade exchange. A high ERPT works in the opposite direction. Finally, the evaluation of ERPT is important for restraining inflation pressures and trade imbalance caused by currency fluctu-ations.
Figure 1. Trade balance of Serbia.
Note: Figure 1 presents data obtained on the basis of data made available by Statistical office of the Republic of Serbia. Source: Author compilation.
-15000 -10000 -5000 0 5000 10000 15000 20000 25000 30000
Figure 2. Imports of product by SITC 4.
Note: Figure 2 presents data obtained on the basis of data made available by Statistical office of the Republic of Serbia. Source: Author compilation.
Figure 3. Exports of product by SITC 4.
Note: Figure 3 presents data obtained on the basis of data made available by Statistical office of the Republic of Serbia. Source: Author compilation.
The paper has the following structure: part 2 presents some stylized facts; part 3 gives infor-mation on applied methodology and database; part 4 presents empirical results; part 5 is a con-clusion.
0 5000 10000 15000 20000 25000 30000
2008 2009 2010 2011 2012 2013 2014 2015 2016 2017
9 - SMTK Rev. 4
8 - Miscellaneous manufactured articles
7 - Machinery and transport equipment
6 - Manufactured goods
5 - Chemicals and related products
4 - Animal and vegetable oils,fats and waxes
3 - Mineral fuels,lubricants and related materials
2 - Crude
materials,inedible,except fuels 1 - Beverages and tobacco
0 2000 4000 6000 8000 10000 12000 14000 16000
18000 9 - SMTK Rev. 4
8 - Miscellaneous manufactured articles
7 - Machinery and transport equipment
6 - Manufactured goods
5 - Chemicals and related products
4 - Animal and vegetable oils,fats and waxes
3 - Mineral fuels,lubricants and related materials
2 - Crude
2. Some stylized facts
Prior to and following the great economic crisis in 2007, Serbia had a high inflation rate, a high trade balance deficiency and frequent exchange rate fluctuations. In the period analysed (2008 -2014), the average inflation rate amounted to 6.9%. The highest inflation rate - 12.2% was recorded in 2012.
With a view to decrease its trade imbalance, Serbia has frequently resorted to exchange rate depreciation policies (Figure 4). In the period between 2008 and 2014, Serbia's national cur-rency, the dinar, has depreciated by 27% against the US dollar.
The highest decrease in import prices was recorded in the period of economic crisis (2007-2009), which was also the case with other transitional economies of Southeastern Europe. Ac-cordingly, Serbia used NEER depreciation measures so as to reduce the import of goods. Changes in import prices were directly related to the changes in the NEER (Figure 5). Addi-tionally, the decreased domestic production had an impact on the oscillations in import prices, i.e. on the decline of the GDP.
Figure 4. Exhcange rate and inflation of Serbia.
60 70 80 90 100 110
2008 2009 2010 2011 2012 2013 2014
Exchange rate Rate of Inflation
Note: Figure 4 presents data obtained on the basis of data made available by Statistical office of the Republic of Serbia. Source: Author compilation.
Figure 5. NEER and import prices of Serbia.
4.2 4.4 4.6 4.8 5.0 5.2
2008 2009 2010 2011 2012 2013 2014
NEER Import prices
3.Methodology and data
3.1. Empirical model
The empirical assessment of the ERPT is based widely-used model by Goldberg and Knetter (1997), Campa and Coldber (2002, 2005) and Bailliu and Fujii (2004) (Kurtovic et al., 2018):
𝑙𝑛𝑚𝑝𝑡𝑥,𝑗 = 𝛼0+ 𝛼1𝑙𝑛𝑚𝑐𝑡𝑥,𝑗+ 𝛼2𝑙𝑛𝑒𝑖𝑡+ 𝛼3𝑙𝑛𝜇𝑡+ 𝜀𝑡, (1)
where 𝑙𝑛𝑚𝑝𝑡𝑥,𝑗 represents import prices in the local currency and is a function of 𝑙𝑛𝑒𝑖𝑡 - the nominal effective exchange rate 𝑙𝑛𝑚𝑐𝑡𝑥,𝑗- marginal foreign costs of production, 𝑙𝑛𝜇𝑡 - domestic
demand, 𝜀𝑡 - the error disturbance term and 𝛼0- a constant.
Bearing in mind that depreciation and appreciation cause pass-through fluctuations, we shall introduce a 𝑑𝑢𝑚𝑚𝑦 variable and mark the period of appreciation as 1 and the period of depre-ciation as 0 (Kurtović et al., 2018):
𝑑𝑢𝑚𝑚𝑦𝐴 = 1 if ∆𝑒𝑖𝑡 < 0 𝑎𝑛𝑑 𝑑𝑢𝑚𝑚𝑦𝐷 = 𝑂 if ∆𝑒𝑖𝑡 > 0, (2)
where 𝐷𝑢𝑚𝑚𝑦𝐴- stands for the exchange rate appreciation, 𝐷𝑢𝑚𝑚𝑦𝐷 is the exchange rate depreciation and ∆𝑒𝑖𝑡 the exchange rate fluctuation.
By incorporating the 𝑑𝑢𝑚𝑚𝑦 variables into the equation (1), we obtain the equation (3) that reflects the asymmetry in fluctuations of currency exchange rates (Kurtovic et al., 2018):
𝑙𝑛𝑚𝑝𝑡𝑥,𝑗= 𝛼0+ 𝛼1𝑙𝑛𝑒𝑖𝑡+ 𝛼2𝑙𝑛𝑒𝑖𝑡 𝑥 𝑑𝑢𝑚𝑚𝑦𝑡+ 𝛼3𝑙𝑛𝑚𝑐𝑡𝑥,𝑗 + 𝛼4𝑙𝑛𝜇𝑡+ 𝜀𝑡. (3) If the 𝛼2 coefficient has a positive sign, then the exchange rate depreciation has a greater effect on import prices. Conversely, if 𝛼2 has a negative sign, then the exchange rate appreciation has a greater effect on import prices (Byrne et al., 2010; Kurtović et al., 2018).
We present the ARDL model using the equation (4):
∆𝑙𝑛𝑚𝑝𝑡𝑥,𝑗 = 𝛼0+ ∑𝑙𝑖=1𝛼1,𝑖∆𝑙𝑛𝑚𝑝𝑡−1𝑥,𝑗 + ∑𝑙𝑖=0𝛼2,𝑖∆𝑙𝑛𝑒𝑖𝑡−1+ ∑𝑙𝑖=0𝛼3,𝑖∆𝑙𝑛𝑒𝑖𝑡−1𝑥 𝑑𝑢𝑚𝑚𝑦𝑡−1+ ∑𝑙𝑖=0𝛼4,𝑖∆𝑚𝑐𝑡−1𝑥,𝑗 + ∑𝑙𝑖=0𝛼5,𝑖∆𝜇𝑡−1𝑥,𝑗 + 𝛽1,𝑖∆𝑙𝑛𝑚𝑝𝑡−1𝑥,𝑗 + 𝛽2,𝑖∆𝑙𝑛𝑒𝑖𝑡−1+ 𝛽3,𝑖∆𝑙𝑛𝑒𝑖𝑡−1𝑥 𝑑𝑢𝑚𝑚𝑦𝑡−1+𝛽4,1∆𝑚𝑐𝑡−1𝑥,𝑗+𝛽5,1∆𝜇𝑡−1𝑥,𝑗 +
𝜀𝑡.
(4)
3.2. Data
4. Empirical results
Table 1 shows the results for ADF and PP unit root tests. All variables are stationary at level I(1), i.e.by introduction of the first difference at 1% and 5% statistics significance level. Based on our results, we dismiss the null hypothesis that data are not stationary, i.e. that data series are integrated at level I(0) and I(1), which means that we can apply ARDL approach.
Table 1. Unit Root Test.
Note: *, **, and *** show significance levels at 1%, 5% and 10% respectively. Source: Author compilation.
Table 2 presents the results of F-statistics. We obtained the optimal number of lags from 1 to 3 based on selection of Akaike Information Criterion (AIC) and Schwarz Bayesian Criterion (SBC) values. F-statistics is 5.88% and it is above Bounds (upper bounds) statistics, which means that we dismiss the null hypothesis that there is no cointegration among variables.
Table 2. The results of the F-test.
Lag length F-statistics AIC SC
1 3.21 -19.15 -13.19
2 1.61 -20.59 -17.91
3 5.88 -21.99* -18.09*
Source: Author compilation.
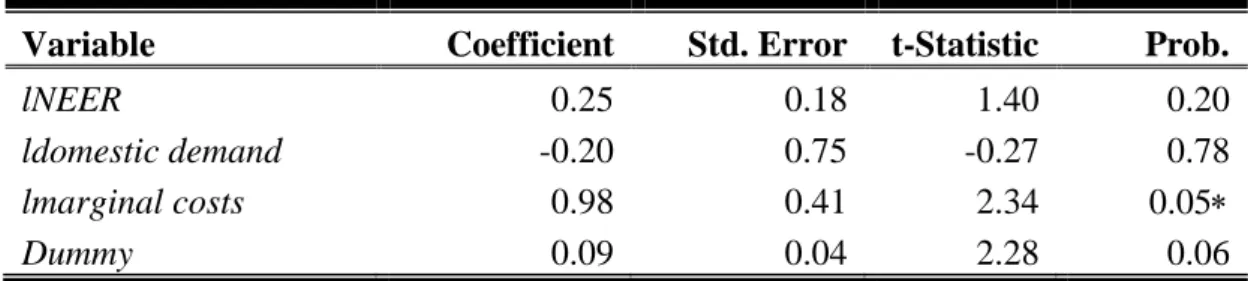
Table 3 presents the results of long-run elasticity of variables. Nominal effective exchange rate (NEER) is not significant and does not influence the increase of aggregate import prices, i.e. there is no pass-through. Finally, exchange rate asymmetry is significant at 10% level, i.e. it appeared based on appreciation of NEER.
Table 3. Long-run estimates
Variable Coefficient Std. Error t-Statistic Prob.
lNEER 0.25 0.18 1.40 0.20
ldomestic demand -0.20 0.75 -0.27 0.78
lmarginal costs 0.98 0.41 2.34 0.05
Dummy 0.09 0.04 2.28 0.06
Note: *, **, and *** show significance levels at 1%, 5% and 10% respectively. Source: Author compilation.
Variable
ADF PP
c c, t First Diff.(1) c c, t First Diff.(1)
Import
prices -3.09 -3.29 -6.68 -1.47 -2.37
-6.37 -6.65
NEER -1.43 -4.30 -1.32 -2.05
Marginal
costs -2.04 -2.32 -8.13 -2.03 -2.32 Domestic
demand -2.70 -2.47
-5.78
Table 4 presents the results of short-run elasticity of variables. NEER is significant in the
short run, on the second lag, at 5% level, i.e. it influences the decrease of aggregate import prices in Serbia. NEER coefficient in the short run equals -0,31%, which is a low value, smaller than 1%, which means that there is a partial pass-through in the short run. The LCP (local cur-rency pricing) strategy hypothesis cannot be rejected. The import prices are denominated in the currency of the importing country and hence the ERPT is low and the changes of the exchange rate have no effect on import prices. Each NEER apreciation above 1% leads to -0,31% decrease of aggregate import prices. Partial pass-through occurs because import prices are denominated in importer currency so that each 1% change of nominal exchange rate affects the change of import price denominated in importer currency.
Table 4. Short-run estimates and ECM (-1) - ARDL (3, 1, 3, 3)
Variable Coefficient Std. Error t-Statistic Prob.
∆𝑙 (NEER) 0.01 0.07 -0.22 0.82
∆𝑙 (NEER(-1)) 0.07 0.07 0.96 0.36
∆𝑙 (NEER(-2)) -0.31 0.09 3.31 0.01
∆𝑙 (domestic demand) 1.22 0.30 4.06 0.00
∆𝑙 (marginal costs) 0.37 0.07 4.83 0.00
∆𝑙 (marginal costs (-1)) -0.32 0.07 -4.22 0.00
∆𝑙 (marginal costs (-2)) -0.22 0.06 -3.75 0.00
∆ (dummy) 0.01 0.01 1.61 0.15
∆ (dummy(-1)) -0.04 0.01 -4.72 0.00
∆(dummy(-2)) -0.01 0.01 -1.36 0.21
C 0.44 0.06 6.81 0.00
ECM(-1) -0.85 0.12 -6.79 0.00
Wald test 3.48
0.00
LM 𝑥𝑆𝐶2 3.389
Heteroscedasticity𝑥𝑁2 2.998 0.07
Normality 𝑥𝐹𝐶2 0.274
0.87
RESET test 0.235
0.812
CUSUM Stable
CUSUMSQ Stable
Adjusted R-squared 0.79 S.D. dependent var 0.07
F-statistic 76.37 Durbin-Watson stat 2.06
Prob(F-statistic) 0.00
*, **, and *** show significance levels at 1%, 5% and 10% respectively. Source: Author compilation
Figure 6).
Figure 6. Plot of CUSUM and CUSUMSQ for Serbia.
-8 -6 -4 -2 0 2 4 6 8
III IV I II III IV
2013 2014
CUS UM 5% S ignific anc e
-0.4 0.0 0.4 0.8 1.2 1.6
III IV I II III IV
2013 2014
CUS UM of S quares 5% S ignific anc e
Source: Author compilation.
Table 5 presents the conclusion that, based on VAR argumented Granger causality test, there is no long-run causality among variables. However, in the short run there is causality only be-tween marginal costs and import prices, NEER and domestic demand. VAR argumented Granger causality confirms a one-way relationship between marginal cost and import prices, NEER and domestic demand, while there is no two-way causality.
Table 5. VAR Granger Causality/Block Exogeneity Wald Tests.
Note: *, **, and *** show significance levels at 1%, 5% and 10% respectively. Source: Author compilation. Dependent
variable
∆ lImport
prices
∆ lNEER ∆ lDomestic
demand
∆lMarginal
costs
∆Dummy
∆ lImport prices
- 2.19 (0.53) 0.52 (0.91) 0.40 (0.94) 2.49 (0.47)
∆ lNEER 2.45
(0.48)
- 0.53
(0.91)
1.54 (0.67)
0.94 (0.81)
∆ lDomestic demand
2.26 (0.51)
0.13 (0.98)
- 1.39
(0.70)
0.36 (0.94)
∆ lMarginal costs 49.90 (0.00) 53.18 (0.00) 8.28 (0.04)
- 6.04
(0.10)
∆Dummy 3.35
Table 6 lists the results of the Chow and Andrews tests providing a verification of
exoge-nously and endogeexoge-nously determined breakpoints. The results of both tests have shown that there was a breakpoint and that all the assessed coefficients were statistically significant. Hence, the structural stability hypothesis can be rejected. The exogenous and endogenous factors af-fecting the occurrence of the breakpoint are the great economic crisis of 2007 and negative structural problems Serbia's economy is facing.
Table 6. Breakpoint tests.
F-statistic Prob.
Chow Breakpoint 3.32 0.05
Quandt-Andrews 27.42 0.00
Break point 2008:3
Note: *, **, and *** show significance levels at 1%, 5% and 10%, respectively. Source: Author compilation.
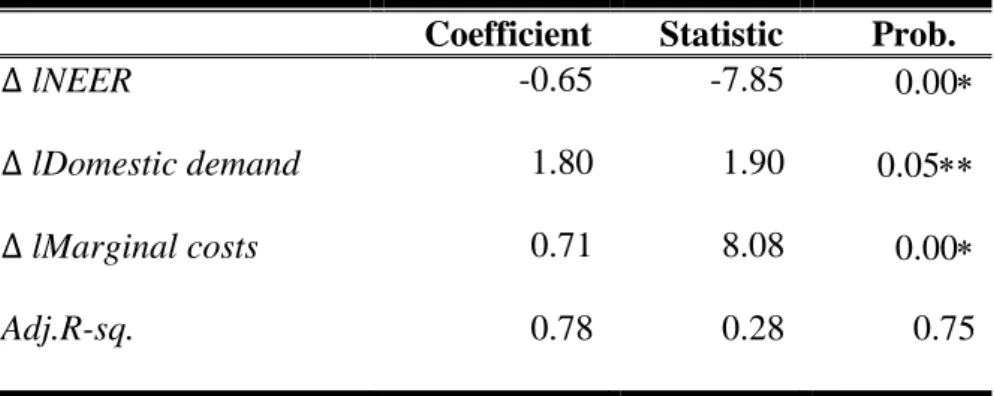
Table 7 presents the results of the robustness regression. The results of assessed coefficients show that there is a cointegration between the variables and robustness results, i.e. the statistical significance is determined at 1% and 5% levels.
Table 7. Robustness check.
Coefficient Statistic Prob.
∆ lNEER -0.65 -7.85 0.00
∆ lDomestic demand 1.80 1.90 0.05
∆ lMarginal costs 0.71 8.08 0.00
Adj.R-sq. 0.78 0.28 0.75
Note: *, **, and *** show significance levels at 1%, 5% and 10%, respectively. Source: Author compilation
5. Concluding remarks
Serbia's monetary strategy is to use the managed floating exchange rate and inflation targeting. Monetary authorities intervene on the currency market in order to maintain stability from short-term currency fluctuations, the level of currency reserves and financial and price stability. On the other hand, the nominal effective exchange rate represents the weighted average of the bi-lateral nominal exchange rate of the dinar against the currency basket comprised of dollars and Euros. The main factors leading to the changes in the nominal effective exchange rate are caused by the fluctuation of the euro and the dollar against the dinar.
Measuring results have shown that in the short run there is a partial pass-through that equals -0,31%, while long-run pass-through was not confirmed. In the short run, partial pass-through is the result of exchange rate appreciation leading to a decrease in import prices. Foreign ex-porters use the LCP strategy which leads to incomplete or low pass-through as the import prices are denominated in the currency of the importer.
understanding of the transmission mechanism. The exchange rate appreciation leads to a
de-crease in inflation and import prices. The application of the LCP strategy means that the prices are denominated in the importing country's currency and that the ERPT is therefore low and the exchange rate oscillations have no effect on import prices. Frequent currency fluctuations are not recommended as they lead to the deviation from the law of one price. It is therefore that the policy makers should re-examine their monetary policies and the exchange rate regime as in-struments used to suppress inflation and trade imbalance.
Moreover, this paper represents a good basis for future research that will include macroeco-nomic factors that explain ERPT into import and consumer prices in Serbia, and also into ap-plication of Johnsen cointegration, VECM and Impulse Response Function.
References
Bailliu, J. and Fujii, E. (2004) Exchange Rate Pass-Through and the Inflation Environment in Industrialized Countries: An Empirical Investigation, Staff Working Paper No. 2004-21.
Bank of Canada.
Barhoumi, K. (2006) Differences in long run exchange rate pass-through into import prices in developing countries: An empirical investigation, Economic Modelling, 23, 926-951. https://doi.org/10.1016/j.econmod.2006.04.006
Ben Cheikh, N. and Rault, C. (2017) Investigating First-Stage Exchange Rate Pass-Through: Sectoral and Macro Evidence from Euro Area Countries, IZA Discussion Paper No. 10555.
Institute for the Study of Labor (IZA), Bonn.
Byrne, P. J., Chavali, A. S. and Kontonikas, A. (2010) Exchange Rate Pass Through To Import Prices: Panel Evidence From Emerging Market Economies, SIRE Discussion Papers No. 2010-46, Scottish Institute for Research in Economics (SIRE).
Campa, J. and Goldberg, L. S. (2002) Exchange Rate Pass-Through into Import Prices: A Macro or Micro Phenomenon?, Working Paper No. 8934, National Bureau of Economic Research, Cambridge, MA.
Campa, J., Goldberg, L. S. and González-Mínguez, J. M. (2005) Exchange-Rate Pass-Through to Import Prices in the Euro Area, Working Paper No. 11632, National Bureau of Economic Research, Cambridge, MA.
Goldberg, P. K. and Knetter, M. M. (1997) Goods Prices and Exchange Rates: What Have We Learned?, Journal of Economic Literature, 35(3),1243-1272.
Jabara, C. L. (2009) How Do Exchange Rates Affect Import Prices? Recent Economic, Working Paper No. ID-21. Washington, DC.
Kurtovic, S., Siljković, B., Denić, N., Petković, D., Mladenović, S. S. and Milovančević, I. (2018) Exchange rate pass-through and Southeast European economies, Statistical Mechanics and its Applications, 3, 400-409. DOI 10.1016/j.physa.2018.03.005
Lopez-Villavicencio, A. and Mignon, V. (2017) Explaining exchange rate pass-through to import prices: Does globalization matter?. http://crief.labo.univ-poitiers.fr/wp-content/uploads/sites/127/2017/04/Lopez_papier.pdf (Accessed December 12, 2017). María-Dolores, R. (2010) Exchange rate pass-through in New Member States and candidate
countries of the EU, International Review of Economics and Finance, 19, 23–35. https://doi.org/10.1016/j.iref.2009.02.009