INTERACTIONS BETWEEN THE SOWING DATES, PLANT DENSITY
AND THE YIELD FOR THE SUNFLOWER AND CORN CROPS
C.V. POPESCU, C. BORA
Keywords: sunflower, corn, sowing date, plant density, yields
ABSTRACT
Within the ADER 1.2.1. project’s multifactorial trials established at A.R.D.S. Simnic – Craiova for the sunflower and corn crops, there were studied the yield’s interrelations between three hybrids for each one of the cultivars (Sandrina, Fundulea 911 and Fundulea 708 for the sunflower crop and Mostistea, Iezer and F 475 M for the corn crop), three different sowing periods (early period 31.03.2014, optimum 15.04.2014 and late period -08.05.2014) and three plant densities (30.000; 50.000 and 70.000 plants/ha).
INTRODUCTION
Sunflower and corn are grown in Romania under different climatic conditions. As a result, there is a wide range of sunflower and corn cultivars present in Romania, their production behavior research under various conditions being very necessary.
MATERIALS AND METHODS
The multifactorial trials were established in 2014 for the sunflower and corn crops and there were observed within the vegetation period three hybrids for each one of the cultivars, three different sowing periods and three plant densities for each one of the hybrids. The trials were established at the Agricultural and Development Research Station Simnic - Craiova in 2014 on a reddish preluvosoil, pseudogleic in its depth, low in humus (only in the first 25 cm the humus percentage is 2, 35), medium supplied with phosphorus and potassium, with a moderate calcium and sodium content, without being endangered by alkalization or salinization (C.V. Popescu., C. Bora, 2009).
RESULTS AND DISCUSSIONS
The cultivars and the technologies used for the establishment of these experimental fields were those recommended within the frame of the ADER 1.2.1. project.
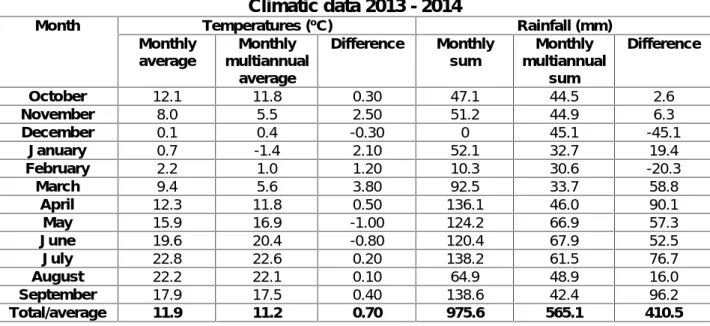
The climatic data registered in 2014 are presented in table 1.
Table 1 Climatic data 2013 - 2014
Month Temperatures (oC) Rainfall (mm)
Monthly average
Monthly multiannual
average
Difference Monthly sum
Monthly multiannual
sum
Difference
October 12.1 11.8 0.30 47.1 44.5 2.6
November 8.0 5.5 2.50 51.2 44.9 6.3
December 0.1 0.4 -0.30 0 45.1 -45.1
January 0.7 -1.4 2.10 52.1 32.7 19.4
February 2.2 1.0 1.20 10.3 30.6 -20.3
March 9.4 5.6 3.80 92.5 33.7 58.8
April 12.3 11.8 0.50 136.1 46.0 90.1
May 15.9 16.9 -1.00 124.2 66.9 57.3
June 19.6 20.4 -0.80 120.4 67.9 52.5
July 22.8 22.6 0.20 138.2 61.5 76.7
August 22.2 22.1 0.10 64.9 48.9 16.0
September 17.9 17.5 0.40 138.6 42.4 96.2
708, established as follows: early period - 31.03.2014, optimum - 15.04.2014 and late period - 08.05.2014. The plant densities were: 30.000; 50.000 and 70.000 plants/ha.
There were used as fertilizers NPK (20.20.0) - 250 kg/ha and, as herbicide after the establishment of the crop - Dual Gold 1.2 l/ha.
In the tables below (table 2 and table 3) there are presented the results of the trials for the conditions registered in 2014:
A – Sowing period (A1 – early, A2 – optimum, A3 – late);
B – Plant density (B1 – 30.000 plants/ha, B2 – 50.000 plants/ha, B3 – 70.000 plants/ha);
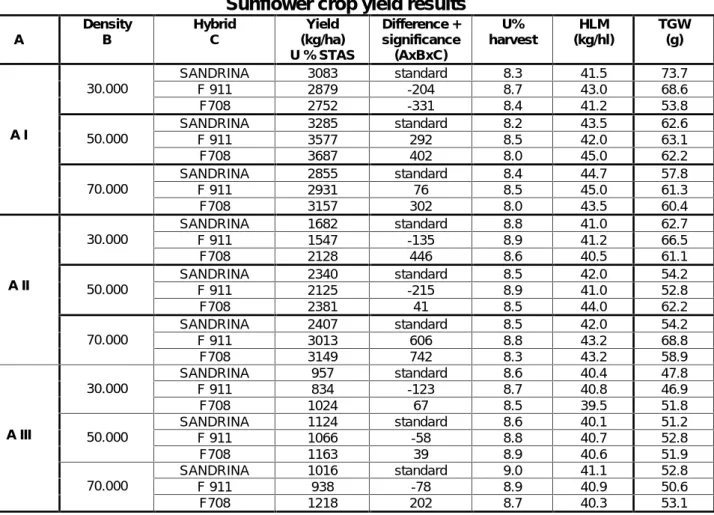
C – Hybrid (C1 – Sandrina, C2 – F 911, C3 – F708) Harvest date: 25.09.2014. As observed, by analyzing the behavior of the hybrid x density x sowing period, none of the hybrids performed, differences in yields not being statistically assured.
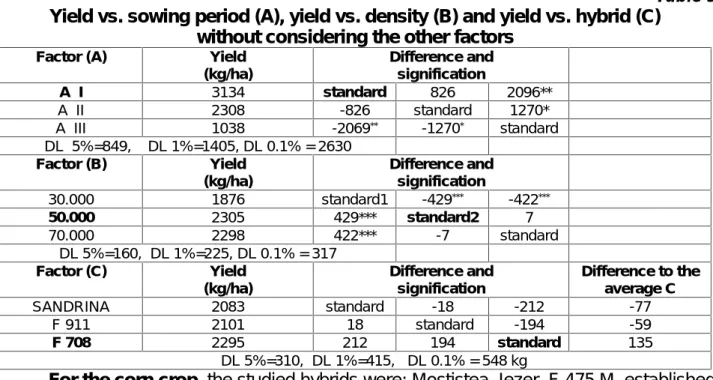
The analysis of the results considering each one of the involved factors is showing that the early sowing determined a yield increase of de 826 kg/ha related to the second sowing period, not statistically assured.
When the sunflower was established within the third period, the yield was distinctly statistically lower compared to the crop established within the early period and significantly reduced compared to the crop established within the second period (optimum).
The plant densities 50.000 and 70.000 plants/ha were net superior to the 30.000 plants/ha density, but the yield differences between 50.000 and 70.000 plants/ha were practically inexistent.
For the 2014 conditions, the most productive hybrid was F708, but there were not registered statistically assured differences according to the hybrids.
Table 2 Sunflower crop yield results
A
Density B
Hybrid C
Yield (kg/ha) U % STAS
Difference + significance (AxBxC)
U% harvest
HLM (kg/hl)
TGW (g)
A I
30.000
SANDRINA 3083 standard 8.3 41.5 73.7
F 911 2879 -204 8.7 43.0 68.6
F708 2752 -331 8.4 41.2 53.8
50.000
SANDRINA 3285 standard 8.2 43.5 62.6
F 911 3577 292 8.5 42.0 63.1
F708 3687 402 8.0 45.0 62.2
70.000
SANDRINA 2855 standard 8.4 44.7 57.8
F 911 2931 76 8.5 45.0 61.3
F708 3157 302 8.0 43.5 60.4
A II
30.000
SANDRINA 1682 standard 8.8 41.0 62.7
F 911 1547 -135 8.9 41.2 66.5
F708 2128 446 8.6 40.5 61.1
50.000
SANDRINA 2340 standard 8.5 42.0 54.2
F 911 2125 -215 8.9 41.0 52.8
F708 2381 41 8.5 44.0 62.2
70.000
SANDRINA 2407 standard 8.5 42.0 54.2
F 911 3013 606 8.8 43.2 68.8
F708 3149 742 8.3 43.2 58.9
A III
30.000
SANDRINA 957 standard 8.6 40.4 47.8
F 911 834 -123 8.7 40.8 46.9
F708 1024 67 8.5 39.5 51.8
50.000
SANDRINA 1124 standard 8.6 40.1 51.2
F 911 1066 -58 8.8 40.7 52.8
F708 1163 39 8.9 40.6 51.9
70.000
SANDRINA 1016 standard 9.0 41.1 52.8
F 911 938 -78 8.9 40.9 50.6
F708 1218 202 8.7 40.3 53.1
Table 3 Yield vs. sowing period (A), yield vs. density (B) and yield vs. hybrid (C)
without considering the other factors
Factor (A) Yield (kg/ha)
Difference and signification
A I 3134 standard 826 2096**
A II 2308 -826 standard 1270*
A III 1038 -2069** -1270* standard
DL 5%=849, DL 1%=1405, DL 0.1% = 2630
Factor (B) Yield (kg/ha)
Difference and signification
30.000 1876 standard1 -429*** -422***
50.000 2305 429*** standard2 7
70.000 2298 422*** -7 standard
DL 5%=160, DL 1%=225, DL 0.1% = 317
Factor (C) Yield (kg/ha)
Difference and signification
Difference to the average C
SANDRINA 2083 standard -18 -212 -77
F 911 2101 18 standard -194 -59
F 708 2295 212 194 standard 135 DL 5%=310, DL 1%=415, DL 0.1% = 548 kg
For the corn crop, the studied hybrids were: Mostistea, Iezer, F 475 M, established as follows: 31.03.2014, optimum - 15.04.2014 and late period - 08.05.2014. The plant densities were: 30.000; 50.000 and 70.000 plants/ha.
There were used as fertilizers NPK (20.20.0) - 250 kg/ha and, as herbicide after the establishment of the crop - Dual Gold 1.2 l/ha.
In the tables below (tables 4 to 7), there are presented the results of the trials for the conditions registered in 2014:
A – Sowing period (A1 – early, A2 – optimum, A3 – late);
B – Plant density (B1 – 30.000 plants/ha, B2 – 50.000 plants/ha, B3 – 70.000 plants/ha);
C – Hybrid (C1 – Mostistea, C2 – Iezer, C3 – F 475 M)
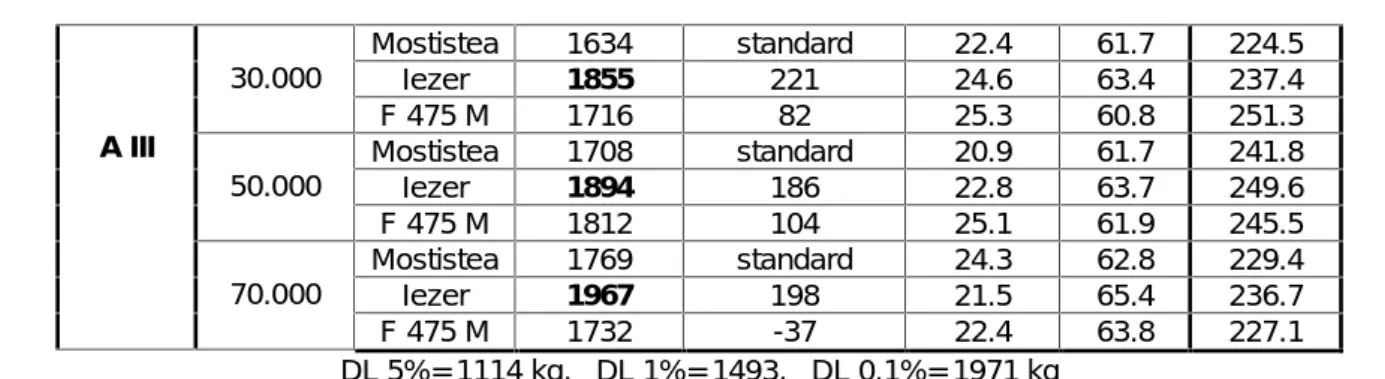
Table 4 Corn crop yield results
A
Density B
Hybrid C
Yield (kg/ha)
U % STAS
Difference + significance
(AxBxC)
U% harvest
HLM (kg/hl)
TGW (g)
A I
30.000
Mostistea 2345 standard 19.5 77.0 330.6
Iezer 3890 1545** 25.1 67.8 363.0
F 475 M 3959 1614** 23.2 70.9 318.5
50.000
Mostistea 2368 standard 20.7 76.7 238.1
Iezer 3856 1488* 26.3 69.5 327.4
F 475 M 3428 1060 24.4 68.8 300.6
70.000
Mostistea 3685 standard 20.8 77.3 236.3
Iezer 4586 901 26.9 68.5 330.5
F 475 M 4112 427 25.5 70.5 300.5
A II
30.000
Mostistea 3692 standard 19.7 76.3 274.8
Iezer 4902 1210* 25.7 68.8 341.0
F 475 M 4651 959 23.1 67.1 300.8
50.000
Mostistea 3339 standard 20.7 76.1 255.5
Iezer 4697 1358* 27.5 68.7 318.1
F 475 M 4857 1518** 26.7 67.9 295.5
70.000
Mostistea 3576 standard 21.5 74.9 243.7
Iezer 5989 2413*** 21.1 67.7 327.3
A III
30.000 Iezer 1855 221 24.6 63.4 237.4
F 475 M 1716 82 25.3 60.8 251.3
50.000
Mostistea 1708 standard 20.9 61.7 241.8
Iezer 1894 186 22.8 63.7 249.6
F 475 M 1812 104 25.1 61.9 245.5
70.000
Mostistea 1769 standard 24.3 62.8 229.4
Iezer 1967 198 21.5 65.4 236.7
F 475 M 1732 -37 22.4 63.8 227.1
DL 5%= 1114 kg, DL 1%= 1493, DL 0.1%= 1971 kg
The Iezer hybrid registered statistically assured increase in production for the 30.000 and 50.000 plants/ha densities within limits of 1210-1545 kg/ha compared to Mostistea hybrid. In addition, for the second sowing period the same hybrid registered a very significant yield increase of 2413 kg/ha at 70.000 plants/ha compared to Mostistea hybrid. The F 475 M hybrid registered statistically assured yield increase compared to Mostistea for all the plant densities but for different periods – for the early period, at 30.000 plants/ha (+1614 kg/ha), second period, at 50.000 plants/ha (+1518 kg/ha) and at 70.000 plants/ha (+1456 kg/ha).
For the third sowing period, there were not registered statistically assured results between hybrids and densities, which suggest that delaying the sowing date uniformed the yield capacity in the climatic conditions of 2014.
Table 5 Yields vs. sowing period (A)
Factor A
Average
yield Difference and significance
A I 3581 standard -945*** 1794***
A II 4526 945*** standard 2739***
A III 1787 -1794*** -2739*** standard DL 5%=124 kg, DL 1%=205, DL 0.1%=384 kg
The best results were registered when corn was established at the middle of the month of April. At the second sowing date, the yield was significantly higher than the other two sowing dates - 945 and respectively 2739 kg/ha. Seeding at the early period determined a very significant yield increase (1794 kg/ha) related to the third period.
Table 6 Yield vs. density (B)
FACTOR B Plants/ha
Average
yield Difference and significance
30.000 3183 standard1 76 -423
50.000 3107 -76 standard2 -499o
70.000 3605 423 499* standard3
DL 5%=477 kg, DL 1%=669 , DL 0.1%=945 kg
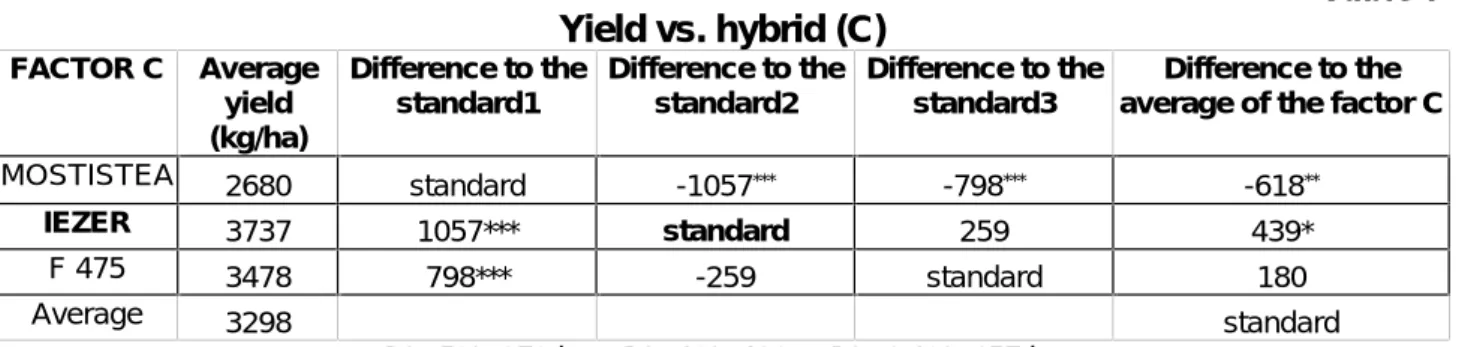
Table 7 Yield vs. hybrid (C)
FACTOR C Average yield (kg/ha)
Difference to the standard1
Difference to the standard2
Difference to the standard3
Difference to the average of the factor C
MOSTISTEA 2680 standard -1057*** -798*** -618**
IEZER 3737 1057*** standard 259 439*
F 475 3478 798*** -259 standard 180
Average 3298 standard
DL 5%=372 kg, DL 1%=498 , DL 0.1%=657 kg
The Mostistea hybrid registered inferior results then the other hybrids and the average. The Iezer hybrid was superior to the Mostistea hybrid and to the average with a statistically assured increase, while the F475 M hybrid was superior only to the Mostistea hybrid.
CONCLUSIONS
For the sunflower crop, by analyzing the behavior of the hybrid x density x sowing
period, none of the hybrids performed, differences in yields not being statistically assured. The analysis of the results considering each one of the involved factors is showing that the early sowing determined a yield increase of de 826 kg/ha related to the second sowing period, not statistically assured.
When the sunflower was established within the third period, the yield was distinctly statistically lower compared to the crop established within the early period and significantly reduced compared to the crop established within the second period (optimum).
The plant densities 50.000 and 70.000 plants/ha were net superior to the 30.000 plants/ha density, but the yield differences between 50.000 and 70.000 plants/ha were practically inexistent.
For the 2014 conditions, the most productive hybrid was F708, but there were not registered statistically assured differences according to the hybrids.
For the corn crop, the Iezer hybrid registered statistically assured increase in production for the 30.000 and 50.000 plants/ha densities within limits of 1210-1545 kg/ha compared to Mostistea hybrid. In addition, for the second sowing period the same hybrid registered a very significant yield increase of 2413 kg/ha at 70.000 plants/ha compared to Mostistea hybrid.
The F 475 M hybrid registered statistically assured yield increase compared to Mostistea for all the plant densities but for different periods – for the early period, at 30.000 plants/ha (+1614 kg/ha), second period, at 50.000 plants/ha (+1518 kg/ha) and at 70.000 plants/ha (+1456 kg/ha).
The Mostistea hybrid registered inferior results then the other hybrids and the average. The Iezer hybrid was superior to the Mostistea hybrid and to the average with a statistically assured increase, while the F475 M hybrid was superior only to the Mostistea hybrid.
REFERENCES
1.Vranceanu A.V., 2000 -Floarea -soarelui hibrida. Editura Ceres. 2.Stefan V.si colab., 2008 -Floarea-soarelui. Editura Alpha MDN.
3. Popescu C.V., Bora C., 2009 - The rational use of water as a main method to combat drought, Analele Universităţii din Craiova, seria Agricultură – Montanologie – Cadastru. Vol. XXXIX, pag. 455 - 459.
4. Popescu C.V.,Bora C., 2009 -Oportunitatea irigării culturilor agricole in zona centrala a Olteniei, Editura SITECH, Craiova.
5.Dragan Skoricet all., 2012 -Sunflower Genetics and Breeding. Serbian Academy of