A NEW METHOD FOR QUANTIFICATION OF REGENERATED BONE
TISSUE ON X-RAY IMAGES OF ELONGATED BONES
A
NETAG
ĄDEK1, L
ESZEKW
OJNAR1, M
ACIEJT
ĘSIOROWSKI2 ANDB
ARBARAJ
ASIEWICZ21Institute of Computing Science, Krakow University of Technology, al. Jana Pawła II 37, 31-864 Krakow,
Poland, 2Jagiellonian University, University Orthopedics-Rehabilitation Hospital, ul. Balzera 15, 43-501 Zakopane
e-mails: lwojnar@m7.pk.edu.pl; tesior@klinika.net.pl
(Accepted November 6, 2003)
ABSTRACT
A new method for quantification of bone regenerate on the basis of computer-aided analysis of digitized X-ray images is presented and its applicability in bone lengthening using Ilizarov method is demonstrated. In contrary to classical methods the internal part of the bone image is taken into consideration instead of the bone edges. Theoretical background of this concept is presented and experimentally verified. Experimental results show that the method proposed allows us for assessment of the bone regenerate, precise choice of the moment of external fixator removal as well as prediction of abnormalities in the osteogenesis process (excluding overall decalcification). However, the rules of interpretation of the results are not discussed in details. Keywords: bone, image processing, osteogenesis, regenerate, X-ray.
INTRODUCTION
Computer-aided image analysis is widely used for medical purposes. Sophisticated monitoring and diagnostic systems using image data, neural networks or artificial intelligence are part of everyday practice in hospitals. Numerous problems are still far from a satisfactory solution because of the variety of diagnostic problems and the complexity of analyzed images. In this paper we present a new method for quantitative assessment of radiograms of limb elongated by Ilizarov method.
The disproportion of limbs is not only a cosmetic defect but can also lead to serious degenerative changes in hip joints of the healthy leg as well as to serious problems in everyday functioning of the patient. Satisfactory treatment is offered by distraction osteogenesis, one of the most popular limb lengthening methods, worked out by Ilizarov (Ilizarov 1989a,b; 1990). The first step in this process is putting on an external frame fixator. Next, the bone is cut and elongated by 1 mm per day in four steps (0.25 mm per each step). Elongation is followed by stabilization that is approximately two times longer. Proper control of the development of a new bone structure (usually called regenerate) is decisive for the success of the whole treatment. The crucial point in this
band or break. By contrast, too late a removal may lead to significant bone embrittlement.
X-ray images are the basic source of information on the course of regenerate development during the stabilization period (Moosley, 1978; Hangartner, 1986; Huurman et al., 1987; Moreland et al., 1987; Peterson and Rohr, 1987, Walker et al., 1991; Noveline, 1999; Erbe and Ross, 2000). Traditional, visual and subjective assessment is still used to determine the time of fixator removal. Therefore, objective assessment of the X-ray images of the regenerate is very important for a surgeon.
The above mentioned drawbacks are suppressed by a new method, proposed in this paper. This method allows for a more accurate assessment of the development in regenerate formation and, additionally, enables the surgeon to detect possible complications in the process earlier than it is possible using only the human visual system.
It should be stressed that the authors have not found in the literature any another quantitative and objective method for regenerate assessment.
PROPOSED METHOD FOR
REGENERATE QUANTIFICATION
General idea
The method proposed allows for quantitative comparison of the regenerate and elongated bone. It is postulated that the osteogenesis process allows for removal of the fixator when the mineral density of the regenerate reaches the mineral density of the remaining part of the bone. It should be noticed, however, that the method presented here is insensitive to overall bone decalcification that may accompany the osteogenesis process.
In order to demonstrate the principle of this new method, two test images have been generated. The first test image depicts the bone structure reduced to a
tube, that models the cortical bone as a part which absorbs the whole dose of X-ray radiation. The second test image depicts the structure of a bone as a homogeneous cylinder - in this case one assumes that all parts of the bone absorb a similar dose of radiation. Subsequently, the gray levels along an arbitrary chosen line (in test images and X-ray image of a bone) have been examined (Fig. 1). The analogy between gray levels’ distribution of the bone reduced to a tube and real one is well visible in figs 2a and 3c.Both of them have two extremes near the edges of analyzed objects.
This observation suggests that the bone structure is better approximated by a tube than by a cylinder. Therefore, its actual image mostly depends on its cortical parts, and the effect of the sponge bone is rather weak.
In order to verify the above described concept, the next two images were compared (Fig. 3a and 3b). They have been obtained under exactly the same conditions. The first image (Fig. 3a) presents the whole bone, whereas the second one (Fig. 3b) the same bone after mechanical removal of the sponge part. The differences between both images are practically insignificant, which is shown in the graph containing a comparison of the gray level distributions of both images (see Fig. 3c). The above described experiment validates the assumption that gray levels of the bone image are determined mainly by its cortical part.
a) initial image of the
bone with regenerate b) Sobel edges c) morphologicalgradient edges I d) morphologicalgradient edges II
a) bone structure reduced to a tube profile
b) bone structure reduced to a cylinder profile
Fig. 2.Gray level distribution of the test images presenting a tube a) and cylinder b).
a) X-ray image of the bone with the sponge
part and location of gray level profile b) X-ray image of the bone with the sponge partmechanically removed and location of gray level profile
As already mentioned, the traditional method of assessment of the regenerates maturity is based on the bone edge continuity (Minty et al., 1994; Maffuli et al., 1996). Such a method reflects our intuitive interpretation of X-ray images of the bone. It has to be noted that the X-ray image is a projection of a 3D object on a 2D surface and not a section of the analyzed object. If we assume that the bone structure can be reduced to a tube, as it is shown in Fig. 2a, its edges are the lightest areas because they absorb the highest dose of X-ray radiation (see Fig. 4).
The information obtained from the bone edges only cannot be treated as representative for the whole bone, as in this method only part of the bone is considered. Thus, it can be claimed that the traditional method is insufficient for reliable assessment of
changes occurring during the stabilization process and the diagnosis based on this data may not be accurate enough. Additionally, as shown in Fig. 1, objective quantification of the bone edges was practically impossible. It is proposed in this work to take into consideration the internal part of the bone image as is determined predominantly by the cortical bone structure (see Fig. 5).
So, the essential novelty of this method of regenerate assessment lies in the fact that the middle part of the bone image instead of its edges is chosen for final analysis. In this way (Fig. 5), the analysis of the images of both projections (lateral and fore-back) yields information about changes in the whole distraction space. In other words, the whole volume of the regenerate is analyzed instead of its apparent edges.
Fig 4. The bone edges constitute the lightest part of the object because mainly thicker layer of the tissues absorbs X-ray radiation
.
ALGORITHM
The main idea of the algorithm analyzing the regenerate is based on an experimental observation that the gray levels of the ideal bone structure change approximately in linear way along the bone axis (Fig. 6). Comparing (by dividing images) the real bone structure with a simulated one (generated by a computer) allows us to assess the extent of the regenerate development.
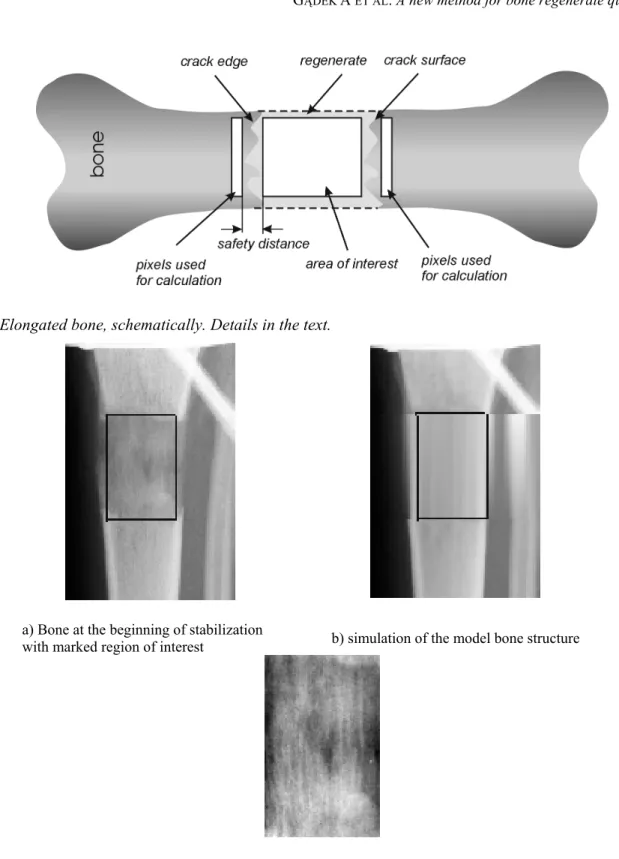
The simulated image of the bone is generated by the algorithm on the basis of pixel values representing the initial bone, lying outside the regenerate (Fig. 7). First, the image is median filtered in order to minimize the effect of possible artifacts. Next, the area of interest is chosen (in the current version of the method this step is performed in an interactive way) in such a way that its edges touch the bone-regenerate interface. New pixel values are computed on the basis pixels located at the safety distance form the area of interest (see Fig. 7 and 8a). This 2 mm distance has been experimentally determined and prevents the analysis of pixels belonging to the regenerate.
Let us denote the bone axis as X. In such a case pixels lying on o line parallel to this axis can be described as follows: the first pixel used for calculation has the abscissa equal to x1 and the gray
level value of P1, whereas the second pixel the
abscissa equal to x2 and the gray level value of P2. If
x2 > x1 than the pixel value Ps located at x in the
simulated image (see Fig. 8b) can be computed as follows: 2 1 2 2 1 1 2 1 P x x x x P x x x x
Ps ⋅
− − + ⋅ − − = (1)
As the result of dividing the real and simulated images (see Fig. 8c) the coefficient of regenerate development CRD is obtained:
n
i
P
i
P
C
n i s r RD∑
==
1(
)
)
(
(2)
where: CRD – coefficient of regenerate development,
n – number of analyzed pixels in the area of interest,
Pr(i) –value of the i-th pixel in the image of
regenerate, Ps(i) – value of the i-th pixel in the
simulated image.
Possibly the use of subtraction of the images instead of division for calculation of the CRD coefficient
Fig. 7. Elongated bone, schematically. Details in the text.
a) Bone at the beginning of stabilization
with marked region of interest b) simulation of the model bone structure
c) Final image – result of dividing the initial image and the model one
Fig. 8. Steps of the computer analysis of the regenerate at the beginning of stabilization.
ILLUSTRATIVE RESULTS
Numerous X-ray images illustrating the process of regenerate stabilization of bones lengthened by Ilizarov method were investigated. Only a small part of the results obtained will be presented below as the aim of this paper is to present the method itself and its applicability. Precise description of the rules of
position of the wedge depending on the regenerate position. Such guidelines are necessary to standardize the results achieved in assessment of bone regenerate. In most cases X-ray images have been taken at four-week internals.
The main result of the analysis of a single image is a value of CRD coefficient, which informs us about
the degree of bone maturity. A CRD value close to 1
indicates that the calcification level is similar to that of the healthy bone. It is essential to remember that
CRD is not sensitive to the process of overall
decalcification, which may accompany the osteo-genesis. This process can be detected using densito-metric analysis, but usually can be neglected.
Currently the algorithm is semi-automatic (it is necessary to specify the test area prior to analysis) and
therefore all the images were analyzed independently by a surgeon and a non-medical scientist in order to assess the effect of personal bias. The illustrative results of such simultaneous analysis are presented in Fig. 9. The observed deviations in results are the consequence of a purely independent (and, consequently, different) choice of the analyzed area. The scatter is not significant and the correlation between the results of two measurements is very high (r = 0.98).
In some cases the changes in regenerate, recorded in the images as darker or brighter areas, are invisible to a human eye (compare small images at the top of graph in Fig. 9). For example, the image corresponding to the 16-th week in Fig. 8 suggests significant drop in calcification, as the regenerate area is darker. In spite of this, the value of the coefficient of regenerate development is almost stable.
Fig. 9. Exemplary result of analysis for one patient. The fixator should be removed after 22 weeks.
a) Mean coefficients’ values for regenerate
X-ray pictures X-ray pictures
a) Regenerates’ development coefficient value in case of too slow distraction osteognensis course (thigh lengthening).
b) Regenerates’ development coefficient value in the case of too slow distraction osteognensis course and cysts in the regenerate.
Fig. 11. Examples of stabilization with complications (AP – X-ray images in the fore-back position, L – X-ray images in the lateral projection).
The method described has been verified by clinical examination. Retrospective analysis of accessible medical data has shown a lack of complications in cases that have been independently assessed as successful by the computer method (compare Figs. 10 and 11). It has also been shown that real complication would have been detected earlier if the proposed computer-aided analysis was applied instead of traditional (visual or based on the edge detection) method. In the case of complications the coefficient of regenerate development takes values lower than the average for correct osteogenesis. However, formulation of appropriate standards requires more data than currently available. For example, there is a lack of standards for CT examination of the bone regenerate.
The research has been conducted in cooperation with a team of surgeons that are very experienced in lengthening bones using the Ilizarov method. As the risk of false diagnosis based on traditional method is higher in the case of less experienced teams, the proposed method may be particularly useful for them. Presented results of analysis shown only usefulness of the proposed method. The way of the interpretation of obtained results and clinical verification overstep the bounds of this paper.
CONCLUSIONS
1. Objective, quantitative information about the degree of regenerate calcification obtained by computer-aided analysis is helpful in taking diagnostic decisions by a surgeon.
2. In contrast to traditional, visual assessment, computer aided image analysis of the regenerate
image is more sensitive to subtle changes in the new bone structure that are invisible to a human eye. Consequently, this should be possible to detect significantly earlier any complications that appear in the process of stabilization.
3. Taking into account the internal part of the bone image simplifies quantification of the regenerate in comparison with the analysis of apparent bone edges.
ACKNOWLEDGEMENTS
Financial support from the State Committee for Scientific Research, grant No 7 T11E 032 20 is gratefully acknowledged.
REFERENCES
Erbe MA, Ross PJ (2000).A technique for lower limb lengthening. Radiol Technol 71(5):497-9.
Hangartner TN (1986). The radiological measurement of bone. Can Assoc Radiol J 37:143-52.
Huurman WW, Stig FS, Anderson JC, Chu W (1987). Limb-Length discrepancy measured with computerized axial tomographic equipment. J Bone Joint Surg 67A(5):699-705.
Ilizarow GA (1989a). The tension-stress effect on the genesis and growth of tissues. Part 1. The influence of stability of fixation and soft-tissue preservation. Clin Orthop 238:249-81.
Ilizarow GA (1989b). The tension-stress effect on the genesis and growth of tissues. Part 2. The influence of the rate and frequency of distraction. Clin Orthop 239:263-85.
Maffulli N, Lombari C, Matarazzo L, Nele U, Pagnona G, Fixsen JA (1996). A review of 240 patients undergoing distraction osteogenesis for congenital, posttraumatic or post-infective lower limb length discrepancy. J Am Coli Surg 182:394-402.
Minty I, Maffulli N, Hughes TH, Shaw DG, Fixsen JA (1994). Radiographic features of limb lengthening in children. A Radiol 35:555-9.
Moreland JB, Bassett LW, Hanker GJ (1987). Radiographic analysis of the axial alignment of the lower extremity. J Bone Joint Surg 69A(5):745-9.
MoosleyCF (1978). A Straight Line Graph for Leg Length Discrepancies. Clin Orthop 136:33-40.
Novelline RA (1999). Squire’s fundamentals of radiology. Harvard: University Press.
Paley D (1990). Problem, obstacles and complications of limb lengthening by Ilizarov technique. Clin Orthop 250:81-104.
Petersen TD, Rohr W (1987). Improved assesment of lower extremity alignment using new roentgenographic techniques. Clin Orthop 219:112-9.
Walker CW, Aronson J, Kaplan PA, Molpus WM, Seibert JJ (1991). Radiologic evaluation of limb lengthening procedures. AJR 156:353-8.
Wojnar L, Tęsiorowski M, Gądek A, Zarzycka M, Jasiewicz B, Kącki W (2002). Zastosowanie kliniczne ilościowej oceny regeneratu kostnego na zdjęciach rentgenowskich. Przegląd Lekarski 59(supl. 4):120-2. Wojnar L, Kurzydłowski KJ, Szala J (2002). Praktyka analizy