Tracing and
Debugging in
ASP.NET
Objectives
• Learn how to set up traces in Visual Studio .NET.
• Configure tracing and debugging in Visual Studio .NET.
• Step through code written in Visual Basic .NET, C#, and Transact-SQL.
Tracing in ASP.NET
ASP.NET supports tracing at the page level and at the application level. Tracing provides an easy way to include “debug” statementsno more messy Response.Write() calls. Instead, you add Trace.Write statements to your code. You only see these statements if debugging is turned onthey are ignored if debugging is turned off.
The Visual Studio .Net environment supports both local and remote tracing and debugging. Tracing allows you to collect details about your running application, such as the server control tree, server variables, headers, cookies, and Querystring parameters.
Page Level Tracing
You can enable tracing at the page level by inserting a Trace directive at the top of an aspx page:
<%@ Page Trace="True" %>
You can then add Trace.Write calls throughout the page: Page.Trace.Write("Your message here.")
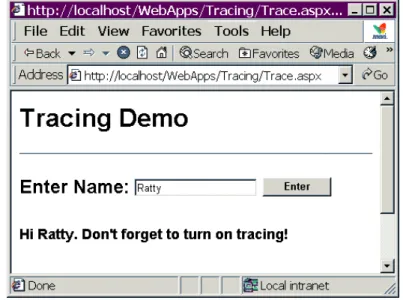
The Trace.aspx page consists of a simple Textbox control for a user to enter a name, a Button control to post back to the server, and a Label control to display the name entered along with a message, as shown in Figure 1.
Figure 1. The Trace.aspx page without tracing turned on.
If you look at the code behind the page, you will see that there are
Trace.Write statements and a Trace.Warn statement in the Page_Load and Button event handlers. However, you never see the results because tracing hasn’t been activated.
Private Sub Page_Load( _
ByVal sender As System.Object, _ ByVal e As System.EventArgs) _ Handles MyBase.Load
If Not IsPostBack Then
Page.Trace.Write("In Page_Load event")
Else
Page.Trace.Write("In PostBack event")
End If End Sub
Private Sub btnEnter_Click( _ ByVal sender As System.Object, _ ByVal e As System.EventArgs) _ Handles btnEnter.Click
Page.Trace.Write("In btnEnter_Click event.")
' Trace.Warn shows up in red
Page.Trace.Warn("The current time is: " &
Now().ToString)
lblMessage.Text = "Hi <b>" & txtName.Text _ & "</b>. Don't forget to turn on tracing!"
Page.Trace.Write("Name entered = " & txtName.Text)
End Sub
Activating Tracing for the Page
To activate tracing and view trace output, you need to set the Tracing="true" directive at the top of the aspx page.
<%@ Page Language="vb" AutoEventWireup="false"
Codebehind="Trace.aspx.vb" Inherits="Tracing.Trace" Trace="true"%>
When you load the page in the browser, you see tracing information displayed with the page, as shown in Figure 2.
Figure 2. Trace.Write entries are circled.
Interpreting Trace Output
In addition to your own tracing output, you can see information about your page. The Control Tree section shows you information about the controls on the page, as shown in Figure 3.
The Cookies Collection gives you the names and values of cookies, as shown in Figure 4.
Figure 4. The Cookies Collection section.
The Headers Collection displays information about messages being sent between the Web server and the client, as shown in Figure 5.
Figure 5. The Headers Collection section.
The Form Collection displays values from the page, as shown in Figure 6.
The Server Variables section displays information about your Web server, as shown in Figure 7.
Figure 7. The Server Variables section.
Application Tracing Steps
If you want to turn on tracing for the entire application, you need to revise the entry in the application’s web.config file, setting the trace element’s enabled property (attribute) to “true”. The requestLimit is the number of requests to save on the serverthe default is 10:
<configuration> <system.web>
<trace enabled=“true” requestLimit=“10”/>
</system.web> </configuration>
Save the file and turn off tracing in Trace.aspx. Choose Build and Browse from the right-click menu and put the Trace page through its paces. Now that tracing is turned off, you won’t see any information listed at the bottom of the page.
See Web.config in Tracing.sln
With the browser still open, load
http://localhost/WebApps/Tracing/Trace.axd.
This output file is always named Trace.axd. The Trace.axd file is a magic URL that points to a page that doesn’t actually exist on disk. Your browser will look like that shown in Figure 8.
Figure 8. The Trace.axd page.
Click on View Details, and you’ll see the same information that you saw when you had page-level tracing activated.
You can also modify the web.config file to add parameters. Changing the pageOutput property to “true” causes the output to display at the bottom of the current page, instead of in the Trace.axd page:
<configuration> <system.web>
<trace enabled="true" requestLimit="10" pageOutput="true" traceMode="SortByTime" localOnly="true" />
</system.web> </configuration>
Writing to the Windows Event Log
Instead of writing to a text file on disk, you can also write information to the Windows Event Log. The class imports the System.Diagnostics namespace to create an EventLog object variable and then uses its WriteEntry method to insert text into the log:
Imports System.Diagnostics
See
The click event handler writes to the log: Private Sub btnEnter_Click( _ ByVal sender As System.Object, _ ByVal e As System.EventArgs) _ Handles btnEnter.Click
Dim Log As New System.Diagnostics.EventLog() Log.Source = "Tracing Demo-OutputNTlog"
Log.WriteEntry(txtName.Text & " Entered at " _
& Now().ToString(), EventLogEntryType.Information)
End Sub
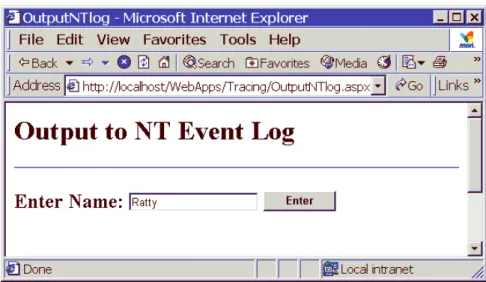
Set the OutputNTLog.aspx page as the start page and press F5 to view the page in browser mode. Type in a name and click the ENTER button, as shown in Figure 9.
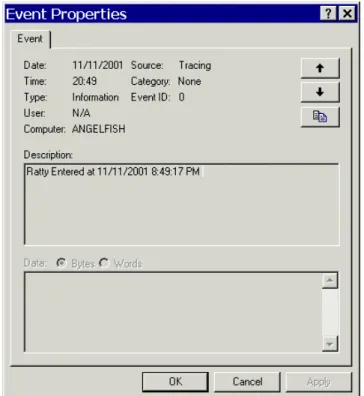
Select Administrative Tools|Event Viewer from the Windows Start menu and double-click the Tracing Demo-OutputNTlog event. You will see the name entered on the page along with the time, as shown in Figure 10.
Figure 10. Viewing event information in the Windows Event Log.
Instrumenting Your Application
Displaying all available trace information is all well and good if you’re running and debugging your ASP.NET application interactively. However, once you distribute your application, you don’t want your users to see trace or error messages. In ASP.Net you have the option of implementing
instrumentation, which involves placing trace statements at strategic locations in your code. These statements can then be activated selectively based on entries in your Web.config file.
Trace Listeners
A trace listener is an object that can receive and process messages. The DefaultTraceListener is automatically created and initialized whenever you enable tracing or debuggingthis is the trace information that appears on your Web page or Trace.axd file. There are also two other listeners, the
EventLogTraceListener and the TextWriterTraceListener. The EventLogTraceListener can insert entries in the Event log, and the TextWriterTraceListener can write entries out to a text file.
A trace switch then controls whether or not trace listeners actually output any information to their designated destinations.
Trace Switches
Trace switches allow you to set the granularity of the messages you receive when you configure them in the Web.config file. The .NET Framework provides two types of trace switches:
• The BooleanSwitch class acts as a toggle, either enabling or disabling a variety of trace statements.
• The TraceSwitch class allows you to enable a trace switch for various tracing levels, so that the trace messages specified for that level and all levels below it appear. If you disable the switch, the trace messages do not appear.
The default for a deployed application is to have all trace switches disabled. If you have a problem, you can configure and activate a trace switch that allows you to change the values of switch objects by changing entries in the
Web.config file. This means that you don’t have to recompile your code to turn tracing on and off after the application is distributed. When your code executes and creates an instance of a switch object for the first time, it checks the Web.config file to see the level of trace information you have configured (if any), then conditionally produces output based on the settings it finds there. When you create an instance of a switch, you specify a displayName argument, which is the name used in the Web.config file, and description argument, which describes the switch and the messages it controls. You also need to specify the following integer values:
• For a BooleanSwitch, the values are Off (0), which is the default, and On (1 or any non-zero value).
• For a TraceSwitch, the values are Off (0), Error (1), Warning (2), Info (3), and Verbose (4 or any value greater than 4).
The Web.config file shows the switching in the <configuration> section. Note that you need to name and add the switchesATraceSwitch for a trace switch, and ABooleanSwitch for a Boolean switch. When you refer to the switches in your code, you must use the names defined here.
<!--turn on trace switches Boolean switch values: Off=0, On=1
Trace switch values:
Off=0, Error=1 Warning=2 Info=3 Verbose=4 !-->
<system.diagnostics>
<switches>
<add name="ATraceSwitch" value="0" />
<add name="ABooleanSwitch" value="0" />
</switches>
</system.diagnostics>
Throwing the Switches and Activating the Listeners
You can configure your trace listeners in your Global.asax file so that they are activated for the entire application.The Systems.Diagnostic class allows you to programmatically configure the trace listeners. Note that you can use an abbreviation Diags so that you don’t need to spell out System.Diagnostics every time you use it in your code: Imports System.Diagnostics
Imports Diags = System.Diagnostics
The trace listeners are defined at the class level:
Private twtl As Diags.TextWriterTraceListener
When the application starts, you can write code in the Application_Start event handler in Global.asax to both fire off an entry to the Windows Application Event Log to that effect and to configure the trace listeners you want to use in the application.
Sub Application_Start( _ ByVal sender As Object, _ ByVal e As EventArgs)
' Fires when the application is started
' Fire off to Windows Application Event Log Dim Log As New Diags.EventLog()
Log.Source = "DotNetLogDemo"
Log.WriteEntry("Logging Application_Start event at " _ & Now().ToString(), EventLogEntryType.Information)
'Configure listeners for the application Call SetupListeners()
End Sub
The SetupListeners procedure handles configuring the listeners. This example writes trace information to three locations: the Output window, a text file, and the Windows event log.
Sub SetupListeners()
Diags.Trace.Listeners.Clear()
' Write trace info to the Output window. Diags.Trace.Listeners.Add( _
New TextWriterTraceListener(Console.Out))
' Write trace info to DotNetLogDemo.txt twtl = New
TextWriterTraceListener("c:\DotNetLogDemo.txt")
Diags.Trace.Listeners.Add(twtl)
Dim eLog As New EventLog() eLog.Source = "DotNetLogDemo"
Diags.Trace.Listeners.Add( _ New EventLogTraceListener(eLog)) End Sub
NOTE In real life you wouldn’t define so many listeners. You’d choose a listener that is most suitable for your application.
The Application_End event handler contains cleanup code so that the listeners are available for the duration of the application and for garbage collection at the end of it. If you clean up your listeners too early, you could generate an exception if a listener is called and is not available.
Sub Application_End( _ ByVal sender As Object, _ ByVal e As EventArgs)
' Fires when the application ends CleanupListeners()
End Sub
Sub CleanupListeners()
' Flush and close the text file trace listener. twtl.Flush()
twtl.Close()
End Sub
The OutputFile.aspx page displays information about which listeners are active. It also imports the System.Diagnostics namespace.
Imports System.Diagnostics
Imports Diags = System.Diagnostics
A TraceSwitch and BooleanSwitch object are declared at the class level: Private traceSwitch As TraceSwitch
Private boolSwitch As BooleanSwitch
See
The load event handler creates objects to point to the TraceSwitch and BooleanSwitch objects:
Private Sub Page_Load( _
ByVal sender As System.Object, _ ByVal e As System.EventArgs) _ Handles MyBase.Load
TraceSwitch = _
New TraceSwitch("ATraceSwitch", _
"Demo trace switch")
boolSwitch = _
New BooleanSwitch("ABooleanSwitch", _
"Demo boolean switch")
End Sub
The click event handler writes to the Windows application event log and the text file, depending on which levels are configured in Web.config:
Private Sub btnEnter_Click( _ ByVal sender As System.Object, _ ByVal e As System.EventArgs) _ Handles btnEnter.Click
Dim strTrace As String
' Write to all listeners, depending on how the various ' switches are set.
Debug.WriteLineIf(boolSwitch.Enabled, _
"You will see this if ABooleanSwitch is enabled-" _ & Now().ToString())
Diags.Trace.WriteLineIf(traceSwitch.TraceError, _
"You will see this if traceSwitch.TraceError(1) is set" _ & Now().ToString())
Diags.Trace.WriteLineIf(traceSwitch.TraceWarning, _ "You will see this if traceSwitch.TraceWarning(2) is set" _
Diags.Trace.WriteLineIf(traceSwitch.TraceInfo, _
"You will see this if traceSwitch.TraceInfo (3) is set-" _ & Now().ToString())
Diags.Trace.WriteLineIf(traceSwitch.TraceVerbose, _ "You will see this if traceSwitch.TraceVerbose(4) is set-" _
& Now().ToString())
If traceSwitch.TraceError = True Then strTrace = strTrace & " TraceError(1) " End If
If traceSwitch.TraceWarning = True Then strTrace = strTrace & " TraceWarning(2) " End If
If traceSwitch.TraceInfo = True Then strTrace = strTrace & " TraceInfo(3) " End If
If traceSwitch.TraceVerbose = True Then strTrace = strTrace & " TraceInfo(3) " End If
If boolSwitch.Enabled = True Then
strTrace = strTrace & " boolSwitch(1) " End If
If Len(strTrace) > 0 Then
lblMessage.Text = "See the logs for trace messages.<br>" _
& "The following trace levels were enabled:<br><br><b>" _
& strTrace & "</b>" Else
lblMessage.Text = "No traces enabled in Web.config" End If
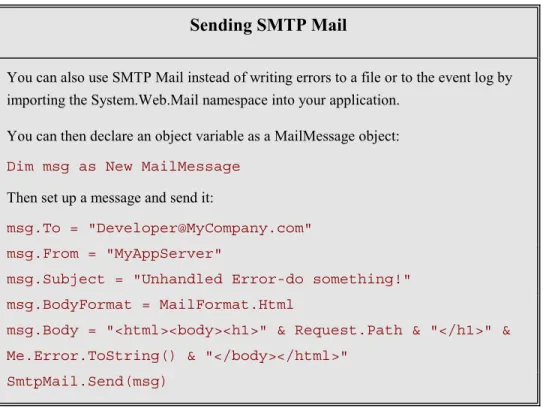
Sending SMTP Mail
You can also use SMTP Mail instead of writing errors to a file or to the event log by importing the System.Web.Mail namespace into your application.
You can then declare an object variable as a MailMessage object:
Dim msg as New MailMessage
Then set up a message and send it:
msg.To = "[email protected]" msg.From = "MyAppServer"
msg.Subject = "Unhandled Error-do something!" msg.BodyFormat = MailFormat.Html
msg.Body = "<html><body><h1>" & Request.Path & "</h1>" & Me.Error.ToString() & "</body></html>"
SmtpMail.Send(msg)
Redirecting Users When Errors Occur
One of the big improvements in .NET is its ability to provide a unified error handling architecture, which includes declarative custom error handling and works the same way in all .NET programming languages. For ASP.NET applications, this means that you can automatically log errors, write to the Windows NT event log, send e-mail, or redirect users to a custom error page whenever unhandled exceptions occur. Redirecting users to a specific Web page is a good way to prevent them from seeing error and exceptioninformation. It also allows you to control the message and display a friendlier page.
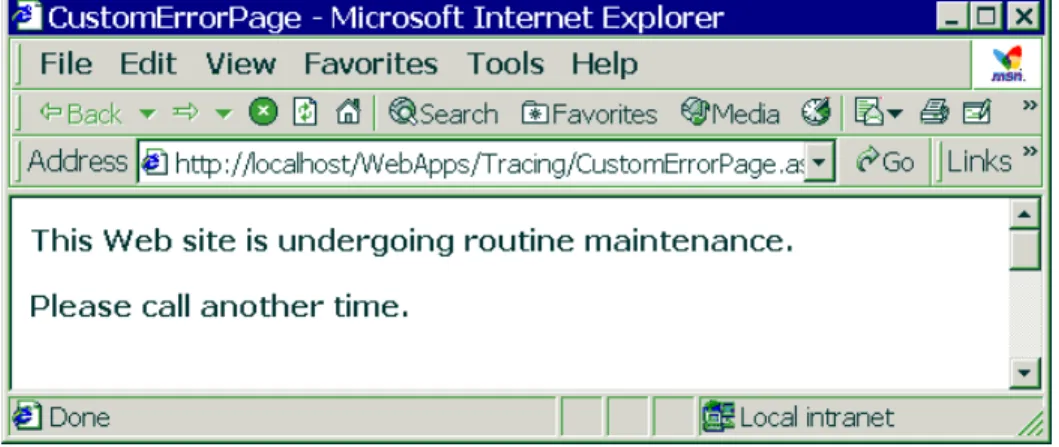
Figure 11 shows the CustomErrorPage.aspx page in browser mode, which was automatically displayed when an unhandled exception occurred in the
BlowUp.aspx page.
See
CustomErrorPage .aspx
Figure 11. You can display a custom page whenever an error occurs.
To redirect users, you need to set the customErrors mode to On and the defaultRedirect property to the name of a page you want to display in the Web.config file. This tells ASP.NET to display the page instead of any error messages that would otherwise be displayed.
<customErrors mode="On"
defaultRedirect="CustomErrorPage.aspx" />
The values you can set for customErrors are On, Off, or RemoteOnly. The CustomErrorPage loads on any unhandled exceptions if On is activated, and only for remote users if RemoteOnly is specified.
NOTE Redirecting to a custom error page does not disable writing to event logs or event files, so you can still capture information about any errors that occurred without displaying them to the users of your application.
The BlowUp.aspx page deliberately blows up at run time with the following code in the Page_Load event handler:
Private Sub Page_Load( _
ByVal sender As System.Object, _ ByVal e As System.EventArgs) _ Handles MyBase.Load
Dim foo As Object foo.ToString() End Sub
See Web.config
Set BlowUp.aspx as the start page and run the project. The CustomErrorPage.aspx page will display instead of Blowup.aspx.
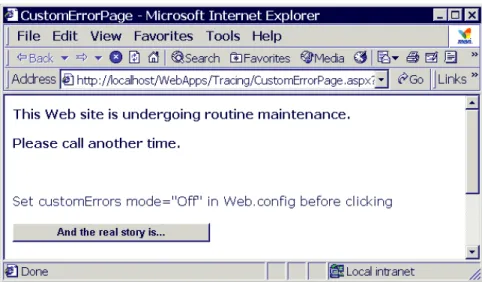
Now set the customErrors mode to Off in the Web.config file, save it, and click the And the real story is button shown in Figure 12.
<customErrors mode="Off"
defaultRedirect="CustomErrorPage.aspx" />
Figure 12. The custom error page button will attempt to reload Blowup.aspx
The event handler for the button simply attempts to reload the BlowUp.aspx page:
Response.Redirect("BlowUp.aspx")
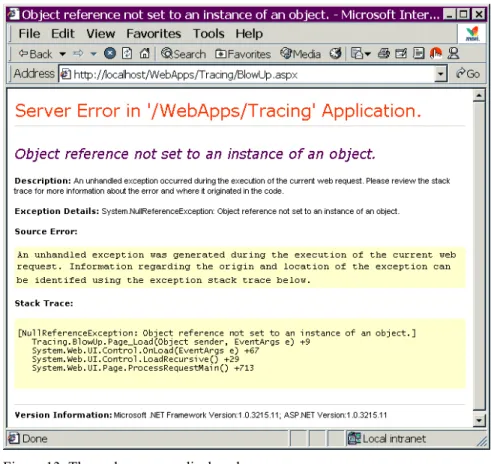
Because you have now set the customErrors option to Off, you will then see the actual error, as shown in Figure 13.
Figure 13. The real errors are displayed.
Using Custom Counters
You can create your own custom application performance counters, which then display in the Windows Performance Monitor (also known as the System Monitor). This allows you to monitor individual ASP.NET applications using your own application-specific performance data. You could see total orders, orders per second, or any other data you deem worthy of monitoring. You create your own custom counters in code using the System.Diagnostics namespace and add them manually to the Performance Monitor.
The class module’s declaration section imports System.Diagnostics: Imports System.Diagnostics
See
CustomCounter .aspx.vb
The code in the Page_Load event handler in CustomCounter.aspx creates a custom counter if it doesn’t already exist:
Private Sub Page_Load( _
ByVal sender As System.Object, _ ByVal e As System.EventArgs) _ Handles MyBase.Load
If Not IsPostBack Then
If Not PerformanceCounterCategory.Exists("CounterDemo") Then
PerformanceCounterCategory.Create( _
"CounterDemo", "Add me to the graph", _
"TotalOrders", "Add me to the graph")
End If End If End Sub
Set the CustomCounter.aspx page as the start page and press the F5 key to load it in the browser. The custom counter named CounterDemo is then created.
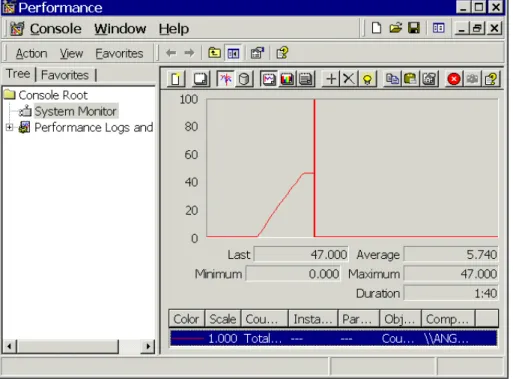
Launch the Performance Monitor from the Windows Start menu. Add the CounterDemo counter by right-clickingon the Performance Monitor graph, as shown in Figure 14.
You will then see a red line across the Performance Monitor graph screen. Resize the Performance Monitor and the browser window so that you can see both the browser and the Performance Monitor. Click the Do Counter button repeatedly. You will see the graph update with each click, as shown in Figure 15.
Figure 15. Each time you click the Do Counter button, the graph in the Performance Monitor updates.
The event handler code for the Do Counter button increments the counter in the Performance Monitor by 1:
Private Sub btnGo_Click( _
ByVal sender As System.Object, _ ByVal e As System.EventArgs) _ Handles btnGo.Click
Dim ctr As New PerformanceCounter("CounterDemo", _ "TotalOrders", False)
ctr.IncrementBy(1)
Debugging ASP.NET Applications
Visual Studio .NET supports a rich debugging environment with a common IDE, multiprocess, and cross-language debugging available. You can debug both local and remote applications in non-modal windows. You can step through code written in different languages without having to switch gears and migrate to another user interface. In addition, debugging doesn’t kill the process after it completes.
However, you must set some configuration options to enable debugging, or else breakpoints in your code will simply be ignored when you attempt to debug it.
Configuring Debugging in Visual
Studio .NET
You can customize Visual Studio .NET so that the keyboard shortcuts are familiar and consistent with the programming language of your choice. For example, if you are comfortable in Visual Basic 6, you can configure the environment so that the F8 key (and those other shortcut keys you memorized) will continue to work. However, it isn’t always easy to find out where to set options in Visual Studio .NETseemingly related options are often buried in different locations.
Configuring Your Profile
Your profile determines what you will see in Visual Studiothe shortcut keys and general programming environment. This is a good starting point for setting options that will help you become comfortable with debugging in Visual Studio .NET.
Try It Out!
1. Select View|WebBrowser|Home from the menu to load your custom Start page.
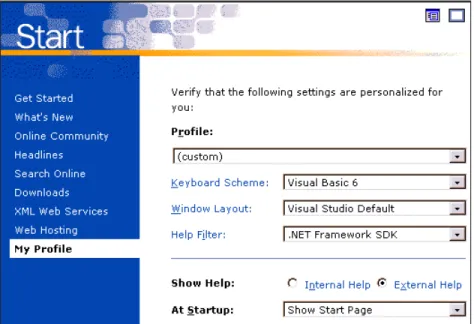
2. Click the My Profile hyperlink at the lower-left section of the page. This loads your Start page, as shown in Figure 16.
Figure 16. Your Start page is where you configure general options for Visual Studio .NET.
3. The Keyboard Scheme determines which shortcut keys will appear on the Visual Studio .NET menus. Choose one of the options shown in Figure 17.
Figure 17. The options for setting up shortcut keys.
4. Choose one of the Window Layout options shown in Figure 18.
5. Choose a Help Filter option as shown in Figure 19.
Figure 19. Help Filter options.
6. The last option you’ll set determines what happens when Visual Studio .NET starts up; choose one of the At Startup options shown in Figure 20.
Figure 20. Startup options for Visual Studio .NET.
Setting Tracing and Debugging Properties
The next step is to set properties in your project so that you can debug and step through code.
Try It Out!
Follow these steps to set up your project so that you can debug your ASP.NET and Transact-SQL code.
1. Right-click on the Tracing project and choose Properties, then select Configuration. Turn on ASP.NET debugging and SQL Server debugging as shown in Figure 21 so that the program stops when it hits breakpoints.
2. Click the Build node and set the conditional compilation constants shown in Figure 22.
Figure 22. Defining DEBUG and TRACE constants in the project Properties dialog box.
Here’s what the various options mean:
• When you check the option Generate debugging information, debugging information will display during compilation. By default debugging information is turned on for the Debug configuration and off for the Release configuration.
• The Warnings option determines whether warnings will be raised during compilation and how they will be treated.
• The Enable build warnings option emits build warnings to the Task List during compilation.
• When you check the Treat warnings as errors option, a build warning won’t cause an output file to be produced.
• The Conditional compilation constants section determines whether tracing and debugging statements should be compiled into the assembly. You can activate DEBUG, TRACE, and your own custom constants.
You can also set these options in the Web.config file, as shown here where the default language is set to Visual Basic and the debug option is set to true: <compilation defaultLanguage="vb" debug="true" />
Setting Breakpoints and Stepping
through Code
Once you’ve configured your debugging options, you can then step through code. Open TraceDemo.aspx.vb and place a breakpoint in the Page_Load event handler, as shown in Figure 23.
Figure 23. Setting a breakpoint in the “If Not Page.IsPostback Then” statement.
Set the TraceDemo.aspx page as the Start page and press F5. The page will start to load, and then you will be bumped into debug mode where you can explore the available options.
See
Debug Options
Choose Debug from the menu so that you can see the available options shown in Figure 24. There are shortcut keys for setting breakpoints and stepping through code.
Setting Up a Watch Expression
The QuickWatch dialog box enables you to get information about the currently running project. Choose the QuickWatch option and type
“Me.btnEnter.Text” in the Expression box. Click the Recalculate button and the current value is displayed, as shown in Figure 25.
Figure 25. Using the QuickWatch dialog box.
Now type Me.txtName.Text <> "" into the Expression text box and click Add Watch. The expression will be added to the Watch window. You can view the Watch window by choosing Debug|Windows|Watch|Watch1 from the menu. Your expression appears in the Watch window, as shown in Figure 26.
Figure 26. The Watch window.
Unlike the QuickWatch dialog box, the Watch window is non-modal. You can set up watch expressions and view the contents while your code executes.
Debugging Windows
Choose Debug|Windows from the menu to see the list of available debugging windows shown in Figure 27.
Figure 27. Available windows in break mode.
The Immediate Window (Command Window)
The Immediate window is also known as the Command window and is
available while you’re in break mode. This window allows you to interactively enter expressions, which are then evaluated. Choose
Debug|Windows|Immediate from the menu and type ? Page.IsPostBack. Press the ENTER key, and the results of the expression are evaluated and the results returned, as shown in Figure 28.
The Locals Window
The Locals window displays a wealth of information, which is accessible by expanding the plus sign (+) next to each item, as shown in Figure 29 where “Me” is expanded.
Figure 29. The Locals window.
You can drill down to the JavaScript level as shown in Figure 30, where the postBackFunctionName property is exposed.
The Me Window
The Me window is similar to the Locals window, but with a more restricted scope. It shows values for the current page only, as shown in Figure 31.
Figure 31. The Me window.
The Breakpoints Window
The Breakpoints window shown in Figure 32 displays the breakpoints that have been previously set. The breakpoint in DebugTest.aspx is highlighted an additional breakpoint has been set in the Ten Most Expensive Products stored procedure in the SQL Server Northwind database. Setting breakpoints in stored procedures and stepping through Transact-SQL code are covered later in this chapter.
The Modules Window
The Modules window shows you all the modules (DLLs or EXEs) that your program uses, as shown in Figure 33. You can sort them by clicking the column header for each column.
Figure 33. The Modules window.
The Call Stack
The Call Stack window shows you the names of functions on the call stack, as well as their parameter types and values, as shown in Figure 34.
The Disassembly Window
The Disassembly window shows you the assembly code that corresponds to the instructions the compiler creates, as shown in Figure 35. Note that the breakpoint is currently on the If Not Page.IsPostBack Then statement.
Figure 35. The Disassembly window.
The Registers Window
The Registers window shown in Figure 36 displays register contents. If you keep the Registers window open as you step through your code, you can see register values change as your code executes. Values that have changed recently appear in red.
Press the F8 key to step to the next statement, and you’ll see the values change, as shown in Figure 37.
Figure 37. Stepping through code shows the changed register values in red.
You can explore the other debugging windows and press the F5 key to end debugging.
Remote Debugging
If you wish to set up debugging on a remote machine, you must have administrative privileges on that machine. You can install either the full Visual Studio .NET or install only the debug components on that machine with the Remote Components Setup option in the Visual Studio .NET setup CD. You will then be automatically added to the Debugger group on that machine and have access to the remote debugging components). The .NET Framework online Help fully documents setting up and configuring remote debugging.
Debugging Multiple Languages
One of the most interesting and powerful new features in Visual Studio .NET is the ability to debug and step through code in any .NET language and beyond. Here’s a list of some of the other platforms that Visual Studio .NET supports:
• Debug from .NET to C++
• Debug into Platform Invocation Services (P/Invoke)
• Debug COM Interoperability
• Debug IJW for Managed Extensions for C++
• Debug into Transact-SQL
SQL Server Debugging
You can step through your Transact-SQL code contained in stored procedures, user-defined functions, and triggers in Visual Studio .NET by setting up a Data Connection in the Server Explorer and setting breakpoints in your stored procedures.
Try It Out!
Follow these steps to debug from a Visual Basic .NET procedure into a C# class and then into a stored procedure:
1. Choose View|Server Explorer from the menu.
2. Right-click on Data Connections and choose Add Connection from the menu.
3. This loads the Data Link Properties dialog box, where you can set up connection information to the Northwind database in SQL Server, as shown in Figure 38.
Figure 38. Setting up a link to the Northwind SQL Server database.
4. Expand the server name and stored procedure nodes and double-click the Ten Most Expensive Products stored procedure shown in Figure 39.
5. This loads the stored procedure into Visual Studio .NET, where you can set a breakpoint in your Transact-SQL code, as shown in Figure 40.
Figure 40. Setting a breakpoint in a stored procedure.
6. If you right-click in the stored procedure, you will see the available options shown in Figure 41.
7. Double-click on DebugText.aspx.vb in the Solution Explorer and set a breakpoint on the line of code highlighted in Figure 42. This line of code sets the DataSource property of a DataGrid control to the results returned from a C# method named RunProc (which executes the Ten Most Expensive Products stored procedure). The C# class is named CSharpDemo and is included in the Tracing solution.
Figure 42. Setting a breakpoint to step into a C# class.
8. Set DebugText.aspx as the Start page and press F5 to start debugging. Click the Start Debugging button shown in Figure 43.
9. This will drop you into the event handler for the button. Press the F8 key to step into the C# class, as shown in Figure 44.
Figure 44. Stepping through C# code.
10. Continue pressing the F8 key to step into the stored procedure, as shown in Figure 45.
11. When you reach the end, the data returned from the stored procedure is displayed, as shown in Figure 46.
Summary
• ASP.NET supports page-level and application-level tracing.
• You can enable page-level tracing by inserting a Trace directive in an aspx page.
• Trace statements display in the page if tracing is enabled.
• You can display custom messages by using the Trace.Write and Trace.Warn statements in your code.
• Trace.Warn statements are displayed in red.
• To configure application tracing, set the trace enabled property to true in the Web.config file.
• If the pageOutput property is set to false, then trace information is displayed in the Trace.axd file.
• You can write trace information to the Windows Event Log by importing the System.Diagnostics namespace into your class module.
• You can instrument your application to display trace information as necessary by writing code and then activating it via entries in the Web.config file.
• Trace listeners receive and process messages when you activate trace switches in your Web.config file.
• You can create a custom error page to display whenever an unhandled exception or other error occurs by setting the CustomErrors mode to on and specifying the error page in the defaultRedirect property in the Web.config file.
• You can create your own custom counters to be displayed in the Windows Performance Monitor graph.
• You need to configure your profile and project debugging options to activate debugging if you want to be able to step through code.
• When you are in break mode, many debugging options and windows are available through the Debug menu, including setting watch expressions, viewing variable and page values, and displaying all breakpoints as well as all procedures in the call stack.
• The Disassembly window shows you assembly code.
• The Registers window shows you changing register values.
• You can step through your code written in any .NET language as well as languages such as Transact-SQL.
• To step through stored procedure code, you must first set up a Data Connection in the Server Explorer to the database in which the stored procedure resides.
Questions
1. How can you set up page-level tracing?
2. When you set up application-level tracing, where does the output display if the pageOutput property is set to false in the Web.config file?
3. Which namespace allows you to write trace information to the Windows Event Log?
4. How do you activate a trace listener?
5. What error messages does a user see if you set the CustomErrors mode to On and the outputRedirect property to a custom error page in your Web.config file?
Answers
1. How can you set up page-level tracing?
By inserting the page directive Page Trace="True"
2. When you set up application-level tracing, where does the output display if the pageOutput property is set to false in the Web.config file?
Output displays in the Trace.axd file
3. Which namespace allows you to write trace information to the Windows Event Log?
The System.Diagnostic namespace
4. How do you activate a trace listener?
By activating a Trace Switch in the Web.config file
5. What error messages does a user see if you set the CustomErrors mode to On and the outputRedirect property to a custom error page in your Web.config file?
Nonethe custom error page will be displayed instead.
6. What do you need to do to step through stored procedure code?
Set up a Data Connection in the Server Explorer to the database in which the stored procedure resides.
Lab 5:
Tracing and
Debugging in
Tracing and Debugging in ASP.NET
Lab 5 Overview
In this lab you’ll learn how to configure and activate tracing in ASP.NET. You’ll also learn how to use the debugging features in Visual Studio .NET. To complete this lab, you’ll need to work through three exercises:
• Turn on Tracing in ASP.NET
• Redirect Users on any Errors
• Debug Code in Visual Studio .NET
Each exercise includes an “Objective” section that describes the purpose of the exercise. You are encouraged to try to complete the exercise from the
information given in the Objective section. If you require more information to complete the exercise, the Objective section is followed by detailed step-by-step instructions.
Turn on Tracing in ASP.NET
Objective
In this exercise, you’ll activate tracing for a page by setting a page directive. You’ll then activate tracing for the entire application.
Things to Consider
• How do you activate tracing for a single page?
• How do you activate tracing for an entire application?
• How do you redirect users to another page if an error occurs?
Step-by-Step Instructions
1. Set the TraceLab.aspx page as the start page. Click F5 to display the page in the browser. At this point tracing is turned off, and clicking the Enter button will not display any tracing information. Close the browser. 2. Open TraceLab.aspx and click the HTML tab.
3. Set the page directive Trace="true":
<%@ Page Language="vb" AutoEventWireup="false" Codebehind="TraceLab.aspx.vb"
Inherits="TracingLab.TraceLab" Trace="true"%>
4. Open TraceLab.aspx.vb and uncomment the code in the Page_Load and btnEnter_Click event handlers.
5. Save your work and click F5. You will now see tracing information in the browser.
6. Scroll down the page and look at the various sections. Enter your name and click the Enter button. Note the new tracing information displayed.
Tracing and Debugging in ASP.NET
7. Close the browser. Delete the page directive Trace="true": <%@ Page Language="vb" AutoEventWireup="false" Codebehind="TraceLab.aspx.vb"
Inherits="TracingLab.TraceLab"%>
8. To set application-wide tracing, you need to modify the Web.config file. Double-click Web.config to open it.
9. Turn on tracing by setting the enabled attribute to true and the pageOutput attribute to true:
<trace enabled="true" requestLimit="10" pageOutput="true" traceMode="SortByTime" localOnly="true" />
10. Save your work and click F5. You will now see tracing information in the browser, as in the first example.
11. Now set the pageOutput attribute to false:
<trace enabled="true" requestLimit="10" pageOutput="false" traceMode="SortByTime" localOnly="true" />
12. Save your work and click F5. You will not see any tracing information on the page this time.
13. While in the browser, fill in your name and click the ENTER button. Then type in the following URL and press ENTER:
14. You will now see trace information in a separate page, as shown in Figure 47.
Figure 47. Viewing the Trace.axd page.
15. Click one of the View Details hyperlinks on the page. You will see detailed trace information displayed.
16. Close the browser and turn off tracing in the Web.config file: <trace enabled="false" requestLimit="10" pageOutput="false" traceMode="SortByTime" localOnly="true" />
Tracing and Debugging in ASP.NET
Redirect Users on any Errors
Objective
In this exercise, you’ll create a custom error page and redirect users to it on any unhandled errors.
Things to Consider
• How do you create a custom error page?
• How do you redirect users when errors occur?
Step-by-Step Instructions
1. Right click on the TracingLab project and choose Add|Add Web Form from the menu. Name the form Custom.aspx.
2. Add a Label control and set its Text property to “Custom Error form”. 3. Save the form.
4. Open the Web.config file and set the customErrors mode attribute to “On” and the defaultRecirect attribute to “Custom.aspx”.
<customErrors mode="On"
defaultRedirect="Custom.aspx" />
5. Open TraceLab.aspx.vb and write the following code in the Page_Load event handler:
Dim int As Integer int = 1
int = int / 0
6. Save your work and run the project. The Custom.aspx page will be displayed instead of TraceLab.aspx.
Debug Code in Visual Studio .NET
Objective
In this exercise, you’ll step through code written in Visual Basic .NET, C#, and Transact-SQL.
Things to Consider
• Activate debugging by setting the appropriate properties in your project.
• Set breakpoints when you want to start debugging.
• Set up a database connection in the Server Explorer and set a breakpoint in your Transact-SQL stored procedure.
Step-by-Step Instructions
1. Right-click on the TracingLab project and choose Properties, then select Configuration Properties. Turn on ASP.NET debugging and SQL Server debugging as shown in Figure 48.
Tracing and Debugging in ASP.NET
2. Choose View|Server Explorer from the menu to bring up the Server Explorer window.
3. Right-click on Data Connections and choose Add Connection from the menu.
4. Set the connection to point to the Northwind database on SQL Server. 5. Expand the Stored Procedures node under the new connection and
double-click the Ten Most Expensive Products stored procedure. 6. Set a breakpoint on the first line, as shown in Figure 49.
Figure 49. Setting a breakpoint in the stored procedure.
7. Open DebugTest.aspx.vb and set a breakpoint on the first line of code in the btnGo_Click event handler, as shown in Figure 50.
Figure 50. Setting a breakpoint in Debug.Test.aspx.vb.
8. Set DebugTest.aspx as the start page and press the F5 key. 9. Click the Start Debugging button and step through the code.
10. As you step through your code, choose Debug|Windows from various points and examine the debugging windows.