Department of Mechanical Engineering
Kara Mackay
MSc Energy Systems and the Environment
Energy Efficient Cooling
Solutions for Data
Centres
Submitted in partial fulfilment with the requirements of the degree: MSc in Sustainable Engineering - Energy Systems & the Environment
Department of Mechanical Engineering Energy Systems Research Unit (ESRU)
Declaration of Author’s Rights
The copyright of this thesis belongs to the author under the terms of the United Kingdom Copyright Act as qualified by University of Strathclyde Regulation 3.50. Due acknowledgement must always be made of the use of any
Acknowledgements:
I would like to thank WSP and Mr Ken McLean for providing me with this project and for the resources and support that they gave to me.
I would also like to thank Dr Michaël Kummert for supervising the study, his guidance and support, and especially for his help with the TRNSYS 16 models. Without which this project would not have been possible.
Abstract
The Data Centre industry has become essential in modern day society and is currently experiencing a major growth period. Found in nearly every sector of the economy, data centres house electronic equipment that provide communications networking, processing and storage of data. Working twenty four hours a day, seven days a week they consume up to 25 to 50 times more electricity than a standard office space. It is desirable to reduce this energy consumption so as to save on energy costs and CO2 emissions.
Removing the heat produced by the IT equipment inside a data centre is a very high priority for a data centre, and it was found that cooling the data centre uses nearly as much power as the IT equipment itself. It is the intention of this project to investigate different methods of reducing the power consumption of data centres by reducing the power consumption of the cooling equipment supporting them.
To begin with an assessment of the cooling system currently used in data centres was carried out and an investigation into the effects of increasing chilled water setpoints from 7°C to 11°C in 2°C increments showed that small amounts of energy savings were made. It was also found that when the chilled water setpoint was 11°C the heat transfer wasn’t sufficient enough to maintain the inside of the data centre at 24°C so this temperature had to be raised to 26°C.
A further study introducing free cooling into the conventional cooling system of a data centre, using the same chilled water setpoints, showed that further energy savings could be made, but only if free cooling is enabled at an optimum temperature, which was found to be 10°C for all chilled water setpoints.
An initial investigation of using combined heating, cooling and power with and without free cooling was performed showing that there is potential for energy savings and cost savings to be made by using CCHP with no free cooling.
Table of Contents
Abstract... 4 Table of Contents... 5 Table of Figures ... 8 Table of Tables ... 10 Nomenclature... 11Nomenclature for Equations ... 12
1 Introduction ... 13
2 Background... 17
2.1 The Building Regulations ... 17
2.2 Changes to Part L of the Building Regulations ... 18
2.3 Background Data Centres... 20
2.4 Inside a Data Centre ... 21
2.5 Energy Use inside a Data Centre... 24
2.6 Energy Problems Faced by Data Centres ... 29
2.7 Opportunities for Energy Efficiency ... 30
3 Description of some of the systems used in a “Typical” Data Centre ... 32
3.1 Chillers... 33
3.1.1 Basic Principles of Chillers... 33
3.1.2 Carnot Cycle ... 34
3.1.3 Reverse Carnot Cycle ... 35
3.1.4 Vapour Compression Chillers... 36
3.1.5 Cooling Towers and Dry Coolers ... 38
4 Case Study – Non Free Cooling and Free Cooling... 39
4.1 Brief Outline of Case Study Data Centre... 39
4.2 Description of the Case Study model ... 39
4.2.1 The Chillers used in the Case Study ... 40
4.3 TRNSYS 16 ... 42
4.4 The TRNSYS 16 Model ... 43
4.4.1 The Building in TRNSYS 16 ... 43
4.4.2 The Chillers in TRNSYS 16... 43
4.4.3 The Chiller and Dry Cooler in TRNSYS 16... 43
4.4.4 The Room Air Conditioning Unit in TRNSYS 16 ... 45
5.1 Model of full system with and without free cooling... 47
6 Results Analysis for Full System with no Free Cooling Allowance ... 50
6.1 COP analysis for system with no free cooling ... 50
6.2 Power breakdown and CO2 analysis of the systems with no free cooling. 52 6.3 Comparison of winter and summer days for systems with no free cooling 55 7 Results for Full System with free cooling ... 56
7.1 Energy Consumption and CO2 Emissions Comparison ... 56
7.2 COP variation over the year for the system with free cooling ... 62
7.3 Comparison of winter and summer days for systems with free cooling .... 65
8 Case Study – Non Free Cooling and Free Cooling - Conclusion ... 66
8.1 Full System with Non Free Cooling ... 66
8.2 Full System with Free Cooling ... 66
9 Improvements to the Data Centre ... 68
9.1 Thermal Energy Storage Using Phase Change Materials ... 68
9.2 CCHP ... 71
9.2.1 Basic CCHP Calculations... 72
9.3 Biodiesel ... 73
9.3.1 Bio-Diesel Supply Options for the UK... 74
9.3.2 Methodology to calculate the CO2 savings possible with bio-diesel ... 75
9.3.3 Results and Analysis... 77
10 Combined Cooling Heat and Power (CCHP)... 78
10.1 Background CCHP... 78
10.2 CHP Package Components ... 78
10.3 Absorption Chillers... 79
10.3.1 Vapour Absorption Cycle... 82
10.3.2 Combining CHP with Absorption Chillers... 83
11 Case Study - CCHP... 84
11.1 Description of the Case Study - CCHP model ... 84
11.2 The CHP unit and Absorption Chillers used in the Case Study -CCHP .... 85
11.3 The TRNSYS 16 Model ... 86
11.3.1 The Absorption Chillers in TRNSYS 16 ... 87
11.3.2 The Generator in TRNSYS 16... 87
12 Methodology for Investigating CCHP in Data Centres... 89
13 Results Analysis for CCHP ... 90
13.1 Results with no free cooling ... 90
13.2 Results with free cooling ... 92
13.3.1 Typical winter and summer day – No free cooling ... 94
13.3.2 Typical winter and summer day – Free cooling ... 95
13.4 Energy Consumption and CO2 Emissions Comparison ... 96
13.5 Electrical Power Produced by CCHP ... 101
14 Case Study- CCHP- Conclusion ... 103
15 Results Comparison – An Overview ... 104
16 Conclusion... 107
References... 111
Appendix 1- Chiller Performance... 114
Appendix 2- Dry Cooler ... 116
Appendix 3- Design Parameters used in TRNSYS 16 ... 117
Appendix 4- Energy Consumption and CO2 Emissions Comparison for Chilled Water Setpoint = 11°C... 118
Appendix 5- Preliminary Comparison Calculations for CCHP ... 120
Appendix 6- Potential Suppliers of Biodiesel ... 121
Appendix 7- Generator in put information for TRNSYS 16... 124
Table of Figures
Figure 1: Hot aisle/ cold aisle rack configuration showing air flow. Source: Pacific Gas & Electric Company, 2006, High Performance Data Centres. 23
Figure 2: N+1 Cooling Plant 25
Figure 3: 2N cooling plant 25
Figure 4: Data Centre Energy Consumption. Source: The Green Grid, 2007.
Guidelines for Energy-Efficient Data Centres. 26
Figure 5: Model entered into TRNSYS for producing Energy Breakdown 27 Figure 6: Data Centre Energy Breakdown based on Case Study 27 Figure 7: "Typical" HVAC system for a Data Centre 32 Figure 8: The Carnot Cycle for power generation. Source: Herold et al, 1996.
Absorption Chillers and Heat Pumps. 34
Figure 9: Refrigeration Cycle diagram & Reverse Carnot Cycle Diagram. Source: Herold et al, 1996. Absorption Chillers and Heat Pumps. 35 Figure 10: Refrigeration Cycle Diagram. Source: McLean R.C., 2006 36 Figure 11: Initial system entered into TRNSYS showing power consumption 40 Figure 12: Diagram showing how chillers are connected to dry coolers 41
Figure 13: Basic diagram of Dry Cooler and Condenser 44
Figure 14: RACUs and RACU fans inside the data centre 45
Figure 15: Simple model of data centre with chillers and free cooling 49 Figure 16: COP variation of full system with no free cooling 50
Figure 17: COP Diagram of System 51
Figure 18: Annual Energy Consumption of system with no free cooling 52 Figure 19: Annual Energy Consumption with free cooling, Chilled Water Setpoint =
7°C 57
Figure 20: Annual Carbon Emissions with free cooling, Chilled Water Setpoint = 7°C 58 Figure 21: Annual Energy Consumption with free cooling, Chilled Water Setpoint =
9°C 59
Figure 22: Annual Carbon Emissions with free cooling, Chilled Water Setpoint = 9°C 60 Figure 23: COP variation over the year for system with free cooling, TChW = 7°C 62 Figure 24: COP variation over the year for system with free cooling, TChW = 9°C 63 Figure 25: COP variation over the year for system with free cooling, TChW = 11°C 63
Figure 27: Sankey diagrams showing primary usage for conventional and combined heat and power applications. Source: Maidment, G.G., Prosser, B. 2000, The Use of
CHP & Absorption Cooling in cold storage. 71
Figure 28: World Production of Biodiesel. Source:
(www.esru.strath.ac.uk/EandE/Web_sites/06-07/Biodiesel/biodiesel2.htm) 74 Figure 29: CO2 production of diesel when using blends of biodiesel 77
Figure 30: Electric Chiller Heat Rejection 81
Figure 31: Absorption Chiller Heat Rejection 81
Figure 32: Vapour Absorption Cycle. Source: McLean R.C., 2006 82 Figure 33: Carnot Cycles for a combined power- generation/heat-pumping facility such as an absorption heat pump. Source: Herold et al, 1996. Absorption Chillers
and Heat Pumps. 83
Figure 34: CCHP model 84
Figure 35: CCHP diagram of TRNSYS 16 Model with no free cooling 86 Figure 36: CCHP diagram of TRNSYS 16 Model with free cooling 87 Figure 37: Generator & Absorption Chiller Interaction 88 Figure 38: PLR variation over the year of CHP unit - no free cooling 90 Figure 39: CCHP no free cooling - Energy Produced - Energy Required 91 Figure 40: PLR variation over the year of CHP unit with free cooling 92 Figure 41: CCHP with free cooling – Energy Produced - Energy Required 93
Figure 42: Annual Gas Consumption 96
Figure 43: Annual Energy Consumption 97
Figure 44: Total Annual Energy Consumption 98
Figure 45: CCHP Annual Carbon Emissions 99
Figure 46: Annual Energy Consumption – Overview 104
Figure 47: Annual Carbon Emissions – Overview 105
Figure 48: Schematic Diagram of a Single Stage Water Cooled Chiller. Source:
TRNSYS 16 Manual 114
Figure 49: Annual Energy Consumption with free cooling, Chilled Water Setpoint =
11°C 118
Figure 50: Annual Carbon Emissions with free cooling, Chilled Water Setpoint = 11°C 119 Figure 51: Annual Energy Consumption and Carbon Emissions for Chilled Water
Table of Tables
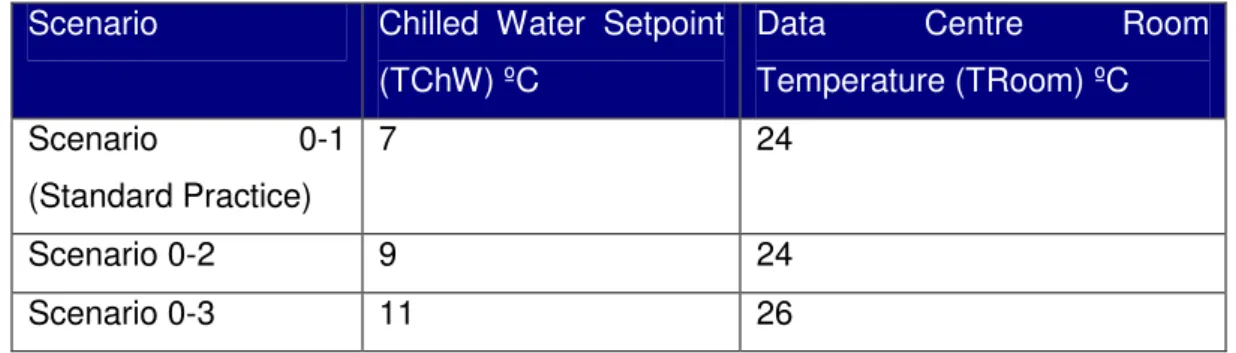
Table 1: List of temperatures used in TRNSYS 16 simulations... 48
Table 2: Chiller CO2 savings for system with no free cooling ... 52
Table 3: CO2 savings for system with no free cooling... 53
Table 4: Cost Analysis of System with no free cooling Energy Use ... 54
Table 5: Winter and Summer Comparison of no free cooling... 55
Table 6: Annual Energy Consumption and Carbon Emissions for Chilled Water Setpoint = 7°C... 58
Table 7: Energy consumption of chiller and dry cooler at 7°C... 59
Table 8: Annual Energy Consumption and Carbon Emissions for Chilled Water Setpoint = 9°C... 60
Table 9: Winter and Summer Comparison of free cooling ... 65
Table 10: Preliminary Cost and CO2 Calculations CCHP... 72
Table 12: Typical Summer & Winter Day - CCHP no free cooling... 94
Table 13: Typical Winter & Summer Day- CCHP with free cooling ... 95
Table 14: Annual Carbon Emissions ... 100
Table 15: Power Produced-Power Required ... 101
Nomenclature
AC Alternating Current
AHU Air handling Unit
ATS Advance 3/single transformer
CCHP Combined Cooling, Heating and Power
CO2 Carbon Dioxide
COP Coefficient of Performance
CPU Central Processing Unit
DC Direct Current
EPBD European Directive of Energy Performance in
Buildings
GHG Green House Gas
HVAC Heating Ventilation and Air Conditioning
kW Kilowatts
kWh Kilowatt hours
LTHW Low temperature hot water
MTHW Medium temperature hot water
PDU Power Distribution Unit
PLR Part Load Ratio
PSU Power Supply Unit
Tec Temperature entering compressor
Tee Temperature entering evaporator
Tlc Temperature of water leaving compressor
Tlc Temperature of water leaving evaporator
UPS Uninterruptible Power Supply
Nomenclature for Equations
pC [kJ/kgK] Constant pressure specific heat nom
COP [-] Chiller nominal Coefficient of Performance at current conditions.
rated
COP [-] Chiller rated Coefficient of Performance at current conditions. ratio
COP [-] Chiller ratio at current conditions divided by the rated COP.
Capacity [kJ/hr] Chiller capacity at current conditions. rated
Capacity [kJ/hr] Chiller rated capacity. ratio
Capacity [kJ/hr] Chiller capacity at current conditions divided by the rated capacity.
h [kJ/kg] Specific enthalpy
m
[kg/s] Mass flow rateη
[-] EfficiencyQ [kJ] Heat transfer
load
Q& [kJ/hr] Current load on the chiller.
met
Q& [kJ/hr] Load met by the chiller.
rejected
Q
&
[kJ/hr] Energy rejected by the chiller to the ambient. chwm& [kg/hr] Flow rate of fluid entering the chilled fluid stream.
chw
Cp [kJ/kg.K] Specific heat of fluid entering the chilled fluid stream. cw
m& [kg/hr] Flow rate of fluid entering the cooling fluid stream.
cw
Cp [kJ/kg.K] Specific heat of fluid entering the cooling fluid stream. set
chw
T , [°C] Desired outlet temperature of fluid in the chilled fluid stream. in
chw
T , [°C] Temperature of fluid entering the chilled fluid stream.
out chw
T , [°C] Temperature of fluid exiting the chilled fluid stream.
PLR [0..1] Chiller Part Load Ratio (the ratio of the current load to the rated load.
P [kJ/hr] Power drawn by the chiller at current conditions.
1 Introduction
The Data Centre industry is currently experiencing a major growth period and has been made essential in modern day society because of the shift in information management from being paper based to being electronic. Found in nearly every sector of the economy, from businesses to government and non government organisations, data centres house electronic equipment that provide communications networking, processing and storage of data. The requirement for data centres to work twenty four hours a day, seven days a week means that they are massive consumers of power and studies have shown that over the past five years there has been a significant growth in the number of data servers, along with an estimated doubling in the energy used by these servers and the power and cooling infrastructure that supports them.
Due to climate change Britain, and the World, are making great efforts to reduce Carbon dioxide (CO2) and Green House Gas (GHG) emissions and much legislation
has been introduced setting targets to be met by governments in the UK and abroad. The UK alone is committed to reducing carbon emissions by 20%, from the 1997 levels, by the year 2010 and on March 13 2007, a draft Climate Change Bill was published aiming to put in place a framework to achieve a mandatory 60% cut, from the 1990 levels, by 2050. Buildings are considered large consumers of energy and the building industry is seeing the impacts of such bills and legislations, as this is the area where it is seen that a significant amount of CO2 and GHG emissions savings
can be made. Because of this, new and refurbished buildings now have to comply with Part L (in England and Wales) or Section 6 (in Scotland) of the Building Regulations, which stipulates efficient energy use in buildings. As such, new and refurbished data centres need to take action now to reduce their energy consumption so as to be in line with current legislation, and to reap the benefits it incurs such as reduced energy costs and carbon emissions.
This report can be considered as four main sections. The first section constitutes the literature review and gives a general background of data centres and their systems. Firstly Part L of the Building Regulations for England and Wales is described, and the changes that have been introduced to help tackle climate change are detailed along with how data centres will be affected by these changes. Secondly a background of data centres, explaining the reasons why they have become critical to modern day
how and where the energy is required and distributed amongst the data centre systems, which not only includes the IT equipment but also the infrastructure systems that support the IT equipment. This section uses a diagram, specific to the case study used in the project, to show that a majority of the power consumed by the IT equipment is matched by the power consumed by the cooling equipment. Therefore, if the power consumed by the IT equipment increases, so too does the power consumed by the infrastructure supporting it. Also acknowledged in this section is the fact that electrical power consumption comes secondary to ensuring reliability, and satisfying performance requirements is the primary requirement when designing a data centre. The large power consumption by data centres makes them ideal for investigating energy efficient design measures that can save on electricity use and money, and opportunities for energy efficiency within data centres is also covered in this section. A detailed diagram of a “typical” data centre HVAC system is given in order to understand the systems analysed in this project. The basic principles of chillers are explained using the Carnot and Reverse Carnot Cycles and the Coefficient of Performance is derived. This first section aims to explain the current status of data centres and the technologies used in “typical” data centres.
The second section outlines the case study and introduces the program TRNSYS 16, which was used to investigate how to make a data centre more energy efficient using current technology practices within data centres.
A description of the case study model is given and the systems used within the TRNSYS 16 model are looked at in detail. The methodology used for investigating the impacts on energy efficiency is implemented in this section. The methodology looked at different scenarios of increasing the data centre chilled water temperature leaving the chillers, and of incorporating free cooling. The results for the system with and without free cooling are analysed, showing the COP of the chiller and the COP of the full system, and how it varies throughout the year. A comparison of the energy consumption of the different scenarios is given along with a CO2 analysis. Lastly a
comparison of the best case scenario and base case scenario performance of the system during a winter and summer day is given, demonstrating why increasing the chilled water setpoint leaving the chillers from 7°C to 9°C saves on power consumption and hence CO2 emissions.
The third section looks at improvements that could be made to the data centre that can help further reduce energy consumption and CO2 emissions. Suggestions made
combined cooling heat and power (CCHP) and fuelling this with bio diesel. Firstly an overview of energy storage is provided and the use of phase change material in thermal storage is discussed. A diagram helping to describe how phase change materials work and a brief explanation of how they could be of benefit in a data centre is given. CCHP is then discussed briefly as it is covered in more detail in the following section. Rough calculations were performed to demonstrate the savings in CO2 emissions and cost benefits of using CCHP instead of electric chillers. The last
part of this section investigates the savings in CO2 that can be made if bio diesel
were to be used to fuel CCHP. A brief study of the supply of bio diesel found that only 3% of the world’s production is in the UK, and a list of potential suppliers in the UK is provided in the appendices. The methodology of how the CO2 is calculated for
bio diesel is given and the results are presented, showing that using high blends of bio diesel for the case study will give CO2 savings.
The fourth section is concerned with combined cooling heat and power (CCHP) and gives a general background of CCHP followed by a description of the components that make up a combined heat and power unit. A brief history of absorption chillers followed by a diagram demonstrating the differences in the amount of heat rejection between electric chillers and absorption chillers, is provided. This diagram is important in understanding that the heat rejection by absorption chillers is larger than that of electric chillers and this has an effect on the performance of the dry coolers in the system. A quick explanation of the vapour absorption cycle is also provided followed by a description of how the CHP unit and the absorption chillers are combined in terms of the Carnot and Reverse Carnot Cycle.
The CCHP case study is presented in this section, which builds on the previous models built in TRNSYS 16. The new TRNSYS 16 model replaces the previous electric chiller, in the original TRNSYS 16 model, with a high temperature and a low temperature absorption chiller connected to an internal combustion generator. It was at this stage the decision was made to control the heat output of the generator to meet the cooling load of the absorption chillers. This was because it was undesirable to have excess heat produced by the generator, which would require a means of cooling before being rejected to the atmosphere. Two simulations were then run in order to get results for the CCHP system with and without free cooling and the term Part Load Ratio (PLR) is introduced and used to compare the two systems. The last part of this section provides graphs showing the power produced by the CCHP unit,
The final section is an overview of results for non free cooling, free cooling and CCHP without free cooling, for a chilled water setpoint of 7°C and indoor data centre temperature of 24°C. These scenarios were chosen because current practices in data centres use these temperatures.
2 Background
This project is concerned with increasing the energy efficiency of Data Centres, whilst decreasing their carbon emissions. Presently Britain, and the World, are making great efforts to reduce Carbon dioxide (CO2) and Green House Gas (GHG)
emissions, and much legislation, such as the Kyoto Protocol, has been introduced, which sets targets to be met by governments in the UK and abroad. The UK alone is committed to reducing carbon emissions by 20%, from the 1997 levels, by the year 2010 and on March 13, 2007, a draft Climate Change Bill was published aiming to put in place a framework to achieve a mandatory 60% cut, from the 1990 levels, by 2050.
The building industry is seeing the impacts of such bills and legislations, as this is the area where it is seen that a significant amount of CO2 and GHG emissions savings
can be made. The Building Regulations for England and Wales, in particular Part L, have been modified and it is important to outline these modifications for this project so as to see the standards expected of the Data Centre Building. There are different Regulations for Scotland, which will not be covered in this project, as the case study for this project is based in Wales.
2.1 The Building Regulations
The Building Regulations apply to most new buildings, and many alterations of existing buildings, in England and Wales. They also apply to domestic, commercial and industrial buildings and are made under powers provided in the Building Act 1984. Their primary purpose is to ensure the health and safety of people in and around buildings and they promote: (Communities and Local Government, Building Regulations Overview, 2007)
• Standards for most aspects of a building's construction, including its structure, fire safety, sound insulation, drainage, ventilation and electrical safety. Electrical safety was added in January 2005 to reduce the number of deaths, injuries and fires caused by faulty electrical installations.
• Energy efficiency in buildings. The changes to the regulations on energy conservation proposed on 13 September 2005 will save a million tones of carbon per year by 2010 and help to combat climate change.
The current edition of the regulations is ‘The Building Regulations 2000’ (as amended) and the majority of building projects are required to comply with them (Office of the Deputy Prime Minister, creating sustainable communities, 2003).
2.2 Changes to Part L of the Building Regulations
Part L of the Building regulations for England and Wales is concerned with conservation of heat and power within domestic and commercial buildings and applies to both existing and new builds. Changes to Part L have arisen because of the UK Governments legal commitment to implement the European Directive of energy performance in buildings (EPBD). The EPBD requires that all new and existing buildings are given an energy rating, and that all new buildings meet a minimum standard of energy efficiency. These new measures are intended to reduce carbon emissions by one million tonnes per year by 2010, equivalent to the emissions from more than one million semi-detached homes (Barbour Index, 2006).
The final versions of the new Part L Approved Documents of the Building Regulations were published in March 2006 and took effect in April 2006. The four new approved documents are focused on the key goal of reducing CO2 emissions from buildings.
The new approved documents subdivide dwellings and non dwelling buildings into new and existing buildings categories as follows: L1A, New dwellings; L1B, Existing dwellings; L2A, New Buildings other than dwellings; L2B, Existing buildings other than dwellings.
The previous Requirements L1 and L2 have been consolidated in Part L, Schedule 1 to cover 3 distinct requirements: (Barbour Index, information services, 2006). 1. Limiting heat gains and losses: through thermal elements and other parts of the
building fabric; and from pipes, ducts and vessels used for space heating.
2. Providing and commissioning energy efficient fixed building services with effective controls.
3. Providing sufficient information to the owner about the building, the fixed building services and their maintenance requirements so that the building can be operated in a way that will use no more fuel and power than is reasonable in the circumstances.
Also contained in the regulations are two new requirements, regarding thermal elements and a change to energy status, as laid out in Regulation 4. Regulation 4A covers the replacement and renovation of thermal elements in existing buildings and
Regulation 4B covers changes in a buildings energy status, and requires buildings to comply with the applicable clauses of Part L of Schedule 1. (Barbour Index, information services, 2006)
Included in the Part L Approved Documents are five new Regulations, which implement the Directive covering Articles 3-6 of the EPBD, grouped under Part VA of the regulations listed below: (Barbour Index, information services, 2006)
• Regulation 17A defines the methodology for calculating the energy performance of buildings (EPBD, Article 3).
• Regulation 17B sets a minimum energy performance requirement for buildings based on a target CO2 emission rate (EPBD, Article 4).
• Regulation 17C is about new buildings meeting the target CO2 emission rate
(EPBD, Article 5).
• Regulation 17D covers consequential improvements to buildings which are being extended, or which are having fixed building services installed for the first time or extended (EPBD, Article 6); this means that the energy performance of the whole building is upgraded. The Regulation applies to existing buildings with a total useful floor area over 1000m2.
• Regulation 17E gives the interpretation of the term ‘building’ as either a whole building or parts of it that have been designed or altered for separate use.
The means of checking that a building meets the required CO2 emission rate is
covered by three new Regulations grouped in Part VI: (Barbour Index, information services, 2006)
• Regulation 20B covers air pressure testing of buildings.
• Regulation 20C describes ways of confirming that the fixed building services have been commissioned correctly.
• Regulation 20D requires written evidence that the actual building’s CO2 emission
rate has been calculated correctly for the building, as constructed, and thus that it complies with Regulation 17C.
The Approved Documents for new dwellings and buildings, L1A and L2A are similar to each other, containing sections on design standards, quality of construction and commissioning, providing information, model designs and definitions.
normally go or only go intermittently to inspect plant and machinery. The exemption applies only if the building is sited at least one and a half times its heights either from the boundary or from any point of a building into which people normally go”. (London Borough of Richmond Upon Thames).
From this it is presumed that if a data centre were to be built with office spaces attached, the building regulations would have to be adhered to. However, if the data centre is a stand alone data centre then the building regulations may not necessarily apply to it. Another factor to remember with a data centre is that the computers have very high energy requirements, when compared to a standard building, therefore, the building may be required to meet building regulation standards, but the computers (i.e., the activity) inside the room may be exempt from Part L of the building regulations. For best practices it would be recommended that energy efficient measures be taken during the design phase of any data centre in order to make the data centre more economical and to reduce green house gas emissions.
2.3 Background Data Centres
Data centres are facilities that primarily house electronic equipment that provide communications networking, processing and storage of data for companies. Data centres are found in nearly every sector of the economy, from businesses to government and non governmental organisations, and are essential to modern day society especially since the World’s economy has seen a shift in its information management from being paper based to being electronic. Presently the data centre industry is experiencing a major growth period. This has been stimulated by an increase in demand for data processing and storage of which some reasons for this are listed below;
• The financial services are seeing an increase in use of electronic transactions such as online banking and electronic trading on the stock market.
• There is a growth of internet services such as music downloads and online communications.
• There has been a growth of global commerce and services. • The adoption of satellite navigation.
• Electronic tracking in the transportation industry.
• The transition of records keeping from paper based to electronic, for example medical records are all saved in a database, businesses now save employee
records electronically, and often companies are required by law to hold records electronically for a set amount of years.
Data centres have become common and critical to the functioning of businesses as they are relied on for information management, aiding business processes and communication. It is therefore a requirement that data centres work 24 hours a day, 7 days a week. Because of this they are massive consumers of power, up to 25 to 50 times more electricity is required than a standard office space (Pacific Gas & Electric Company, 2006). A study carried out in the United States by the Environmental Protection Agency (U.S EPA, 2007) has shown that over the past five years, the demand for computer resources has led to significant growth in the number of data servers, along with an estimated doubling in the energy used by these servers and the power and cooling infrastructure that supports them. This statement can be supported by the findings of Dr Koomey (2007), who found that in 2005, total data centre power consumption, including servers, cooling and auxiliary equipment, amounted to 1.2% of total US electricity consumption, US $2.7 billion and in 2006, U.S EPA (2007) found that the power consumed by data centres was 1.5% of total U.S electricity consumption costing $4.5 billion. In his studies Dr Koomey (2007) also noted that World wide data centre electricity consumption amounted to US $7.2 billion in 2005. One of the reasons for the increase in energy consumption by data centres, between 2000 and 2006, can be attributed to one type of server, the volume server, whose energy use more than doubled in this period, and is now responsible for 68% of the electricity consumed by IT equipment (U.S EPA, 2007). In the United Kingdom it was found that the average energy costs of running a corporate data centre is currently around £5.3 million a year and this figure is set to double over the next five years to £11 million (Barker, 2006). Not only has the energy consumed by the IT equipment risen over the past few years, but so has the power and cooling infrastructure that supports the data centre, which in itself consumes a significant amount of energy.
2.4 Inside a Data Centre
In order to understand the energy requirements of a data centre a description of the standard layout of a data centre will first be given. Firstly, data centres are not designed for humans but for computers, and as a result typically have minimal circulation of fresh air and no windows. They can be housed in either an existing building that has been retrofitted or a new building specifically constructed for the
conventional building to a large building purpose built to house IT equipment and supporting infrastructure.
Data centre rooms contain rows of racks containing IT equipment. The IT equipment consists of servers, storage devices and network equipment. A data centre also houses the relevant infrastructure equipment that supports the IT equipment such as the power delivery systems, which provide backup power, regulate voltage and convert alternating and direct current (AC/DC), and the cooling equipment such as Room Air Conditioning Units (RACUs), also known as Computer Room Air Conditioning (CRAC) units.
The electricity supplied to the IT equipment follows the path described; Electricity is supplied to an uninterruptible power supply unit (UPS).
The UPS acts as a battery backup. This is to ensure that the IT equipment does not experience any power disruptions, which would cause disruption to businesses or loss of important data, both of which are very costly to businesses.
Electricity is converted from AC to DC in the UPS to charge the batteries.
The power from the batteries is then converted from DC to AC before leaving the UPS.
Power enters the power distribution unit (PDU) and is sent to the IT equipment in the racks.
In the servers the server power supply unit (PSU) converts electricity from AC to low voltage DC power.
Low voltage DC power is used by the servers’ internal components (central processing unit (CPU), disk drives, memory, fans).
Storage devices and network equipment, facilitating the storage and transmission of data, also receive electricity.
Data centres are operated continuously and modern IT equipment generates high, concentrated heating loads that must be removed so the equipment can operate properly. It is therefore important, when designing a data centre that careful consideration is given to the control of the air flow. In most data centres, RACUs meet the cooling requirements and the entire air handling unit (AHU) is situated on the data centre floor. The AHU is responsible for conditioning and distributing the air throughout the data centre and consists of fans, filters, and cooling coils. The aim of an air management system is to reduce or eliminate mixing between the cold air supplied to the IT equipment and the hot air rejected from the IT equipment. There
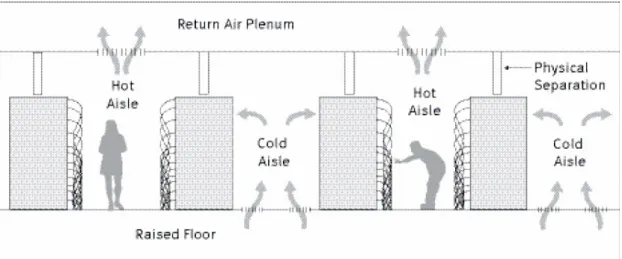
are many designs and methods available to achieve a good air management system, such as hot aisle, cold aisle rack layouts, ventilated racks, flexible barriers, optimised supply and return grills/ floor tiles. However, the hot aisle, cold aisle configuration is becoming more widely used due to its ability to serve high density racks better than previous, more mixed flow configurations (Pacific Gas & Electric Company, 2006). Figure 1 shows a basic hot aisle cold aisle rack layout and also shows where the cold air enters and the hot air exits.
Figure 1: Hot aisle/ cold aisle rack configuration showing air flow. Source: Pacific Gas & Electric Company, 2006, High Performance Data Centres.
It can be seen from the diagrams that the data centre IT equipment is laid out in rows of racks separated by cold and hot aisles. Isolation barriers (the physical separation), which prevent the hot air and cold air mixing and reduce air recirculation are also shown in Figure 1. The cold aisle is placed on the rack air intake side and the hot aisle is placed at the rack exhaust side. The cold air is drawn into the racks by the equipment from the front and the hot air produced by the equipment is rejected into the hot aisle where it is removed, thus achieving a front to back air flow pattern. When properly installed, with isolation barriers, the temperature from the hot aisle does not impact upon the temperature of the racks and hence the operation of the data centre. The system is designed to only supply cold air to the cold aisles and remove hot air from the hot aisles. Cold air is blown up through floor grills/ tiles/ vents to the cold aisle. The floor is raised and serves as both a duct and a wiring chase. Therefore, consideration must be taken to ensure that the air flow is not blocked by electrical equipment. The placing of floor grills or tiles supplying the cold air to the aisles is also of importance so that ‘hot’ spots do not occur and grills are not
pumped from chillers located outside the data centre room. The air is re-circulated internally in this manner and only a small percentage of outside air is admitted to the room to keep the zone positively pressurized. When designed correctly the air management system can reduce initial start up costs, operating costs and increase the data centres density capacity as well as reducing failure of equipment due to heat related processes.
2.5 Energy Use inside a Data Centre
Data centres are designed for a specific power density, watts per square foot (or meter). In the U.S a typical cabinet of equipment occupies 14 square feet (1.3 m²) of space and over the past several years power consumption in a rack has steadily increased. This is due to the replacement of pedestal servers, drawing 1 kW/rack, with 1U/2U pizza box servers at 3.5 kW/cabinet and blade implementations at 10 kW/cabinet (Data Centre Energy Dynamics, 2007). In addition to this, faster CPU’s and larger memory chips contribute towards increasing power demands. The number of racks a data centre can support is limited by the power required per rack. A typical data centre measuring 10,000-20,000 sq.ft (square feet) (1860 m²) is designed for 50-100 watts/sq.ft (540-1080 W/m²), thus requiring 0.5 MW to 2 MW of power. As all the energy entering the data centre is converted to heat, cooling is required for the IT equipment, and as IT loads and hence heat loads increase, so does the floor space required for cooling equipment and the cost of cooling. This large amount of power is costly and difficult to obtain, and supporting the infrastructure needed, such as generators, ATS, UPS, and distribution equipment adds to this expense.
Another expense is also accrued through the backup equipment that is in place for power delivery and cooling. Figure 2 below shows this, using Chillers as an example. A typical data centre may have a load of 900 kW and use three chillers of 300 kW to meet this load, often this system would be called “N” and in this example N=3, the number of chillers needed for the data centre to work correctly. If one of these chillers was to fail, there is a spare chiller available for use, this is termed a plus one, and the system is now an N+1 system.
Figure 2: N+1 Cooling Plant
Figure 3 shows two cooling plants, both of which are an N+1 system. The second cooling system is in place in case something should happen to the first system, making it unusable. These two systems are termed 2N, i.e., a duplicate has been made.
Figure 3: 2N cooling plant N +1 Chillers N +1 Chillers N +1 Chillers N N
Three key components are supplied with energy in a data centre; IT equipment, power delivery and cooling. If data centres were 100% efficient then all the power supplied would reach the IT loads. However, the two other components are also consumers of energy and the energy breakdown is shown in Figure 4. The diagram is based on a typical data centre with 2N power and N+1 cooling equipment, operating at about 30% of rated capacity, which makes this a conservative estimate.
Figure 4: Data Centre Energy Consumption. Source: The Green Grid, 2007. Guidelines for Energy-Efficient Data Centres.
Figure 4 illustrates that the power consumed by the IT equipment is matched by the power consumed by the cooling equipment and all the energy consumed by the data centre is rejected as waste heat into the atmosphere. Therefore, if the power consumed by the IT equipment increases, so too does the power consumed by the infrastructure supporting it.
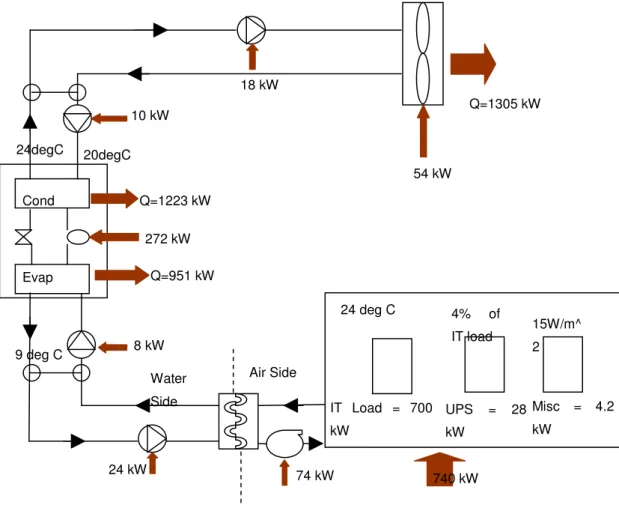
In order to relate this diagram to the project, a diagram specific to this project was made, using preliminary power results from TRNSYS 16, and used as a comparison. Figure 5 shows the power breakdown of the systems used, and the systems themselves, in the TRNSYS 16 model that gave rise to Figure 6. HVAC (Heating Ventilation and Air Conditioning) is the term used in this diagram for the Chillers and all the pumps required for circulating the chilled water.
Figure 5: Model entered into TRNSYS for producing Energy Breakdown Cond Evap 74 kW 24 kW 54 kW 8 kW 10 kW 18 kW 272 kW Q=951 kW Q=1223 kW 24degC 20deg IT Load = 700 kW UPS = 28 kW Misc = 4.2 kW 740 kW 4% of IT load 15W/m^2 9 deg C 24 deg C Q=1305 kW Air side Water side IT Equipment 58 % HVAC 32 % UPS 2%
Light & Miscellaneous 1 % RACU 7 % Inside Data Centre Heat Electrical Power Input
The power breakdown of Figure 5 and the assumptions used for lighting, miscellaneous and UPS input, is from initial facts and figures provided by WSP, for the case study used in this project. Although the electricity consumption between the case study data centre and the Green Grid data centre electricity consumption differ, it can still be seen that the Chillers and their accessories (water pumps, dry coolers, fans) and the IT equipment are the largest consumers of power entering a data centre.
There are many issues that can reduce the efficiency of data centres, these include: power distribution units and/or transformers operating below their full load capacities, air conditioners consuming extra power to drive air over long distances at high pressure or compensate for blockages under the floor, over sizing a UPS to avoid operating near its capacity limit, running a UPS system at low loads, reducing the efficiency of the equipment.
The primary requirement, when designing a data centre, has always been to ensure reliability and satisfy performance requirements. Electrical power consumption has been a secondary attribute, and equipment that could compromise the performance of the data centre will generally not be implemented. This is despite the fact that electrical energy costs over the life of a data centre may exceed the costs of the electrical power system, including the UPS, and even the cost of the actual IT equipment. The low priority given to the consumption of electrical power during the design phase, means that its management as an expense has also been of low priority, and as a consequence, few data centres are able to supply in depth information on the monitoring of their energy usage and costs. Some reasons for this are explained below (The Green Grid, 2007):
• Electrical bills are sent out long after charges are incurred and are seen as a necessary event that most people don’t consider trying to influence.
• Electrical bills for the data centre may be incorporated within a larger electrical bill and are often not within the responsibility or budget of the data centre operating group.
• There are no clear links existing between particular decisions such as installing a new zone of equipment in the data centre or operational practices, and the increased cost of electricity.
• Tools for modelling the electrical costs in data centres are not widely available or commonly used during the design phase.
• Often sufficient information regarding energy cost consequences is not given to decision makers during the planning and purchasing phase of the project.
In order to avoid the high consumption of electricity by data centres in the future, the use of best practices, such as correctly sizing the physical infrastructure system to the load and designing an energy efficient system, should be employed. For this to be successful a multi pronged approach, enforced throughout the lifecycle of the data centre is necessary, incorporating energy efficient strategy, engineering, deployment, operations and organisation.
2.6 Energy Problems Faced by Data Centres
The amount of electricity used by data centre servers and infrastructure is increasingly becoming an important issue as reliance upon data centre services have become more widespread. Data has to be available constantly in order to enable businesses to operate and data loss can cost a company thousands. Therefore, one of the major criteria when designing a data centre is its ability to be resilient. If there is a loss of power to the data centre, servers will stop working, and the rise in temperature, resulting from the RACUs not working, will cause a significant rise in temperature of the data centre, damaging servers and important data can be lost. It is imperative that energy systems for a data centre are designed with suitable back up. Another problem facing data centres are the cooling requirements. Data centre equipment racks can produce very concentrated heat loads and it is important that this waste heat is removed so servers do not overheat. Therefore, air flow management and cooling are very important factors in the design stage. It is also imperative that cooling is still available when changes to the power availability occur, or if there is a total loss of power. Because of this, cooling requirements for dense servers are driving up the power demand and nowadays increasing numbers of data centres are finding that they run out of power availability before they run out of floor space.
2.7 Opportunities for Energy Efficiency
Until recently there has been limited research carried out to ascertain energy reduction options available to data centres. Due to the growing concern for the environment and a desire to reduce CO2 emissions, as well as new legislation being
put into practice, such as changes to the building regulations, research into energy efficient data centres is becoming an increasingly important topic. The large power consumption by data centres makes them ideal for investigating energy efficient design measures that can save on electricity use and money. However, these measures are strongly dictated by the fact that the requirement for reliability and high power density outweighs that of energy efficiency.
Careful air management practices within a data centre can have a significant effect on energy efficiency. Some issues that are critical to the performance of a data centre include (Pacific Gas & Electric Company, 2006):
• Using best-practices air management, such as strict hot aisle/cold aisle configuration, can double the computer server cooling capacity of a data centre. • An airside economiser is part of the HVAC equipment, and uses controls and
supply and return air dampers to control outside air quantities. They are used in some applications to cool the indoor air temperature when the outdoor air temperature and humidity are sufficiently low enough to economically provide cooling without using the mechanical refrigeration cycle. Air management can reduce data centre cooling costs by over 60% when combined with an airside economiser.
• Removing hot air immediately as it exits the equipment allows for higher capacity and much higher efficiency than mixing the hot exhaust air with the cooling air being drawn into the equipment. Equipment environmental temperature specifications refer primarily to the air being drawn in to cool the system.
• A higher difference between the return air and supply air temperatures increases the maximum load density possible in the space and can help reduce the size of the cooling equipment required, particularly when lower-cost mass produced package air handling units are used.
• Poor airflow management will reduce both the efficiency and capacity of computer room cooling equipment. Examples of common problems that can decrease the usable capacity of a RACU by 50% or more are: leaking floor tiles/cable openings, poorly placed overhead supplies, under floor plenum obstructions, and inappropriately oriented rack exhausts.
Other considerations for increasing energy efficiency and ‘greening’ a data centre are: raising the temperature within the data centre room, in order to reduce the work having to be done by the chillers; using free cooling when available; energy storage facilities such as phase change materials for storage of coolth, or hydrogen fuel cells for storing electricity; procuring energy from a ‘green’ supplier; producing power and heat onsite (combined cooling heat and power) so as to save on electricity usage and costs.
This project intends to look at the options available for making data centres more energy efficient, whilst still maintaining high reliability within the data centre. Referring back to Figure 6 shows that the only variable capable of having a significant impact on energy use is the energy used for cooling the data centre, i.e., the performance of the chillers, as the IT loads cannot be changed without significant changes being made to servers, which are out with the scope of this project. Pumps, air conditioning units and UPS units are difficult to change without manufacturing redesign.
3 Description of some of the systems used in a “Typical”
Data Centre
Buildings that use full air conditioning require some means of cooling and dehumidification. This is usually provided by an HVAC system that consists of chillers, which provide chilled water to RACUs that condition the air, and all the corresponding pumps and pipes to enable air conditioning to occur. To gain an understanding of the systems analysed in this project, a diagram showing the components that make up the HVAC system of a “typical” data centre is provided. A more detailed description of the systems is given in the subsequent chapters of the project.
Figure 7: "Typical" HVAC system for a Data Centre
It can be seen in the diagram that the chillers are only one component of the overall HVAC system that is required for cooling a building. The dry coolers required for cooling the water exiting and entering the condenser of the chiller, are an important component, as are the components that make up the RACUs; RACU fans that
Data Centre RACU fan Condenser Evapaporator Evaporator Shunt Pump Condenser Shunt Pump Cooling Water Pump Dry Cooler Chilled Water Pump Chiller Compressor Air Side Water Side
circulate cool air around the room, and the heat exchanger that removes the heat from the air in the room. The performance of the HVAC system is largely reliant on the pumps in the system, as the flow rate of the water has an effect on the rate of heat transfer in the system. The shunt pumps of the system are necessary to facilitate the manufacturer of the chillers requirement for certain temperatures and flow rates to be passing through the evaporator and condenser of the chiller at all times.
3.1 Chillers
Chillers use a vapour compression or absorption refrigeration cycle to remove heat from a liquid. This liquid is usually water which may also contain a small amount (approximately 20%) glycol and corrosion inhibitors. In mid to large size businesses chilled water is used to cool and dehumidify air. Sometimes other fluids such as oil can be chilled, but for this project only chilled water is considered. This project will be analysing two types of chillers, vapour compression chillers and absorption chillers. In order to gain an understanding of how these work the basic principles of chillers will be outlined.
3.1.1 Basic Principles of Chillers
The Clausius statement of the Second Law of Thermodynamics indicates that “it is impossible to operate a cyclic device whose sole effect is the energy transfer of heat from a cooler body to a hotter body” (Herold, K.E, 1996). However, a net heat transfer from a cooler body to a hotter body is possible if a cyclic device receives an energy input, either in the form of work in a vapour compression cycle, or heat in an absorption cycle. Refrigeration is the process of moving heat from one location to another using this method. Applications of refrigeration include commercial and industrial refrigeration and air conditioning systems.
Because of this a common design of vapour compression chillers uses a modified reverse Rankine cycle, which is itself a modification of the theoretically ideal Carnot cycle for fluids and processes.
3.1.2 Carnot Cycle
The Carnot Cycle can be used as an idealized energy conversion cycle for a simple steam plant. The Carnot Cycle for power generation is shown in Figure 8 on a temperature- entropy diagram.
Figure 8: The Carnot Cycle for power generation. Source: Herold et al, 1996. Absorption Chillers and Heat Pumps.
All the energies are positive in the direction of the arrows, which is clockwise. Process 1-2 represents the isothermal addition of heat, which occurs in the boiler of the plant. Process 2-3 represents the isentropic production of work, which occurs in the turbine of the plant. Process 3-4 represents the isothermal rejection of heat Q1 at a temperature T1. Process 4-1 represents the isentropic, adiabatic input of work that occurs in the compressor of the plant. If all processes are assumed to be reversible then the area enclosed by 1234 represents the net amount of work produced (W) and the area enclosed by 3456 represents the amount of thermal energy Q1 rejected by the cycle, assuming that 5 and 6 are at temperature T= 0K. The sum of the two areas (1256) represents the amount of heat Q2 supplied to the
cycle as required by the first law.
W
Q
Q
2=
1+
Equation 1The efficiency is defined as the amount of work produced from a cycle divided by the
heat supplied to the cycle.
2 Q W
=
η
Equation 2For the Carnot Cycle shown in Figure 8, the Second Law of Thermodynamics states that for reversible operation the net entropy production is zero, so that;
0 1 1 2 2 − = T Q T Q Equation 3
The maximum efficiency, available in terms of temperature only, can be found by modifying Equation 2, and is given by;
2 1 1 T T − =
η
Equation 4Where T1=SinkTemperature and
T
2=
SourceTemp
erature
.Although the practical power cycle will always be less than this ideal, for any particular combination of source and sink, an indication of the importance of temperature at which heat is transferred to the working fluid is given. It can be seen from Equation 4 that the lower the ratio of sink temperature to source temperature the higher the maximum attainable thermal energy will be. The sink temperature is usually outside of the engineers control but is unlikely to be far outside the range of 280K-310K (7°C-37°C). The source temperature is dependent on the design of the heating plant so the engineer can exercise some control over it. In principle the Carnot Cycle could be used for a steam power plant but in reality this is not the case as it has serious disadvantages such as having a low work ratio due to the large work input to the compressor, having serious practical difficulties associated with the compression process, and being limited to having a moderate thermal efficiency value as the critical point for steam occurs at a temperature of only 374°C, which is well below the metallurgical limit of around 600ºC -650ºC. Therefore, the Carnot Cycle is not used in practise. However, if the Carnot Cycle is reversed the system will be working as a heat pump cycle.
3.1.3 Reverse Carnot Cycle
Figure 9 shows a Reverse Carnot Cycle.
Figure 9: Refrigeration Cycle diagram & Reverse Carnot Cycle Diagram. Source: Herold et al, 1996. Absorption Chillers and Heat Pumps.
It can be seen that the direction of all the processes is reversed when compared to the Carnot Cycle.
The Coefficient of Performance (COP) describes the performance of a heat pump (or refrigerator) and is the ratio of the benefit obtained (amount of heat (Q) available at the high temperature), divided by the expenditure (net work, W).
(
)
1 0 1 0 1 1 34 12 23 T T T s T T s T W W Q COPHP − = ∆ − ∆ = −= Equation 5: (Heat Pump)
(
)
1 0 0 0 1 0 34 12 41 T T T s T T s T W W Q COPR − = ∆ − ∆ = − = Equation 6: (Refrigerator)In both the heat pump and the refrigeration cycles it is desirable to have a high COP and the smaller the difference in temperatures between the reservoirs, the greater the COP will be.
3.1.4 Vapour Compression Chillers
Vapour Compression Chillers basically consist of a condenser, evaporator, compressor and expansion valve and a basic diagram of a refrigeration cycle used by a water cooled chiller is illustrated in Figure 10 along with a corresponding reverse Carnot Cycle.
Figure 10: Refrigeration Cycle Diagram. Source: McLean R.C., 2006
Processes 1-2 and 3-4 are reversible, adiabatic and isentropic. Processes 2-3 and 4-1 are reversible, isothermal and isobaric.
Throttle Valve Condenser Evaporator Compressor Chilled water stream Cooling water stream
The refrigerant at point 1 has been evaporated to saturation point. Then, because of the Clausius statement, a compressor has to apply work to the fluid to raise the temperature so that net heat transfer can occur. The refrigerant, now at point 2, then passes through the condenser, where it is condensed back to a saturated liquid, point 3, and heat is rejected. From points 3-4 the refrigerant is expanded in the throttling valve before passing through the evaporator where heat from the surroundings is exchanged enabling the refrigerant to evaporate to the saturated vapour line. The cycle then repeats itself.
The compressor work is calculated by:
1 2
12
h
h
W
=
−
Equation 7The condenser heating effect is:
3 2
23
h
h
Q
=
−
Equation 8And the evaporator refrigeration effect is given by:
4 1
41
h
h
Q
=
−
Equation 9Therefore the COP for a vapour compression refrigeration cycle is:
12 41
W
Q
COP
R=
Equation 10It is desirable to have the chillers be able to extract as much heat as possible from its low temperature heat source, in this project the data centre, for a certain expenditure of work.
There are many variations of each of the components within a vapour compression chiller, and also variations on how they are combined, how they are controlled and in some cases enhancements to the components, such as multistage compressors to increase efficiency. The types of compressors chosen vary depending on the range of capacity. Small capacity sized chillers tend to use reciprocating piston and scroll compressors, intermediate capacity chillers use screw compressors and large size chillers tend to use turbo compressors. Turbo compressors are generally radial designs, typically referred to as centrifugal compressors, although axial designs are in limited use and are used for refrigerants that need extreme mass flow rates. Centrifugal compressors, referred to often as centrifugal chillers, are prevalent in large systems such as central and district systems, hospitals, hotels.
3.1.5 Cooling Towers and Dry Coolers
Vapour compression chillers require some form of cooling; this can be either air cooled or water cooled. Water cooled chillers incorporate the use of cooling towers and have a better thermodynamic effectiveness than air cooled chillers. This is because the heat rejection is at, or near, the air wet bulb temperature instead of the dry bulb temperature. Although water cooled chillers have a better thermodynamic effectiveness, there are health and safety issues regarding air borne diseases, such as legionnaires disease, therefore, for smaller applications, such as in this project, air cooled chillers are used, which use dry coolers for cooling the water on the condenser side. Dry coolers consist of fans that are able to increase or decrease their speed to cool the ambient air which passes over the condenser water, thus cooling it.
4 Case Study – Non Free Cooling and Free Cooling
4.1 Brief Outline of Case Study Data CentreThe case study chosen for this project was based on information kindly provided by WSP. The Data Centre is to be situated in Wales and is currently undergoing substantial restructuring and refurbishment, thus making it ideal for investigating how to make data centres more environmentally friendly. The main aim of the Data Centre is to collect and maintain important data about its customers. It relies heavily on computer systems to input and store all of its data and also relies on the internet for their customer services. It is therefore important that the infrastructure supporting the Data Centre runs effectively.
The dimensions and power consumption of the data centre will be used as inputs for the simulations in TRNSYS 16.
The assumptions made about the Data Centre are: 25 m length x 11 m width x 6 m height
Volume = 1650 m3
Internal heat gains, excluding RACU fan power = All IT + lighting + miscellaneous = 740 kW.
4.2 Description of the Case Study model
Inside the Data Centre the electrical loads taken into account are made up of: 700 kW of IT, UPS losses of around 4% of the IT load (28 kW), and lighting and miscellaneous accounts for around 2% of the IT load (12kW).
All of these electrical loads are converted to heat within the data centre therefore the whole data centre produces 740 kW of heat, which is cooled by RACUs. Figure 11 shows the typical power consumption of all the systems used in the initial TRNSYS 16 model, with no free cooling.
Figure 11: Initial system entered into TRNSYS showing power consumption
4.2.1 The Chillers used in the Case Study
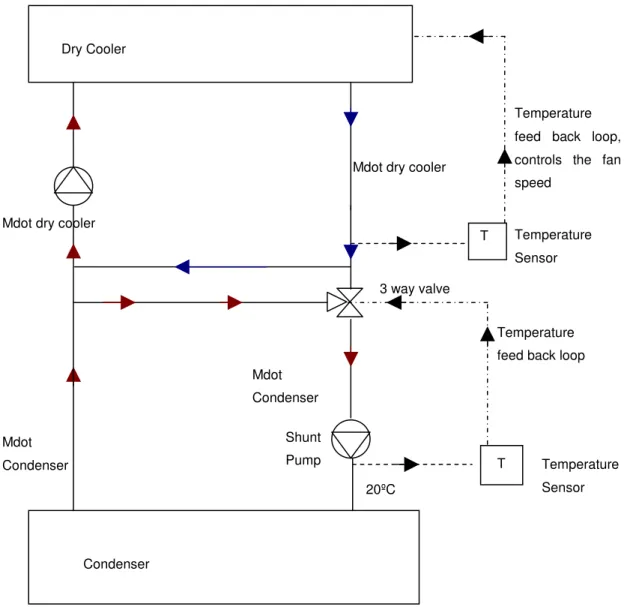
The chillers used for the case study are vapour compression chillers. The choice of chillers to cool 740 kW is to have three chillers, two of which are capable of meeting the load, so each chiller is sized at 370 kW, giving a total of 1110 kW of capacity. This configuration is termed N+1. It is presumed that each chiller is served by a dry cooler, and they are laid out in parallel (Figure 12).
Cond Evap 74 kW 24 kW 54 kW 8 kW 10 kW 18 kW 272 kW Q=951 kW Q=1223 kW 24degC 20degC IT Load = 700 kW UPS = 28 kW Misc = 4.2 kW 740 kW 4% of IT load 15W/m^ 2 9 deg C 24 deg C Q=1305 kW Air Side Water Side
Figure 12: Diagram showing how chillers are connected to dry coolers
The condenser water pump is a constant volume pump that serves multiple dry coolers. The condenser in each of the chillers draws its own cooled water from the cooled water loop. The fans in the dry coolers are variable speed and each dry cooler has its own temperature control. Because the temperature controls are dependent on the ambient temperature, it is expected that all the dry coolers will be running at the same speed at any given time. The amount of dry coolers necessary is N+1.
Before continuing further with an in depth description of the case study the program TRNSYS 16 will be explained.
Cond Evap Cond Evap Cond Evap Dry Coolers Condenser Water Pump Chillers 370 kW 370 kW 370 kW