Please cite this article as: F. Behnamfar,A. Moghtaderi Esfahani, R. Nikbakht, M. Ghandil, Analysis of Structural Vibrations due to Passage of Underground Trains, International Journal of Engineering (IJE), TRANSACTIONS C: Aspects Vol. 29, No. 6, (June 2016)
International Journal of Engineering
J o u r n a l H o m e p a g e : w w w . i j e . i r
Analysis of Structural Vibrations due to Passage of Underground Trains
F. Behnamfar*a,A. Moghtaderi Esfahania, R. Nikbakhtb, M. Ghandila
a Department of Civil Engineering, Isfahan University of Technology, Esfahan, Iran b Senior structural Engineer, Esfahan, Iran
P A P E R I N F O
Paper history: Received 04 May 2015
Received in revised form 02 June 2016 Accepted 02 June 2016
Keywords: Train Soil Underground Tunnel Structure Vibration Finite Elements
A B S T R A C T
During the last decades, the railway traffic in densely populated areas has increased. At the same time, passenger trains have become faster and freight trains have become heavier. Consequently, trains are an increasing source of ground vibration, which may be a nuisance to people, buildings and sensitive equipment. In this research, a two-dimensional dynamic system, including underground train, sleeper, rail pad, tunnel, soil and adjacent structure is analyzed implementing a linear time history dynamic analysis. The purpose is a parametric study about the factors affecting peak responses of structures (acceleration, velocity and displacement). The effects of train velocity, soil properties, natural period of structure and height of tunnel, are investigated. Train movement is modeled by a series of moving loads. The set of ballast, rail pads, sleepers and tunnel are modeled with appropriate elements. The surrounding soil and structure on the ground, are modeled with plane strain and frame elements, respectively. Behavior of the system is assumed to be linearly elastic. The time history analysis results in recognizing the critical cases of response and the factors important for it. The critical conditions for the vibrations of the ground surface, relief of the building occupants, and the structural behavior are determined.
doi: 10.5829/idosi.ije.2016.29.06c.00
NOMENCLATURE
m Mass Cn Damping coefficient of normal damper
V Locomotive speed Ct Damping coefficient of tangential damper
p
v Compression wave velocity Crp Damping coefficient of pads
s
v Shear wave velocity E Elasticity modulus
Mass density I Moment of Inertia
Poisson's ratio K Soil substrate stiffness Damping ratio of soil Krp Stiffness of pads
1. INTRODUCTION1
The underground vibrations when transmitted to surface might disturb people living near to railways or it may interrupt sensitive equipments. For the same reason, today study of environmental subsequences before construction of new railway system in populated areas has become conventional [1]. Such studies are
1*Corresponding Author’s Email:[email protected] (M.
Ghandil)
especially justified for sensitive locations like industrial centers, hospitals, historical sites, etc.
the tunnel’s axis. This type of analysis may be used for when the ground condition is uniform along the tunnel [3].
Johnson (2000) implemented theoretical and experimental studies on ground and structural vibration from passing trains. Out of a case study, it was concluded that only low-frequency waves are effectively transmitted to a structural foundation [1]. Gupta et al. (2007) studied the vibrations of the line 4 of Beijing’s subway that was under construction at the time. A combined FEM/BEM method was used to predict the responses. At the same time, the ambient vibrations were recorded at the laboratory building. Also, at a location nearby the working line 1 of the same subway, the vibrations due to the passing trains were both measured and calculated as a verification study. Then, a few methods were studied to reduce the vibration levels [4].
Xia et al. (2005) studied vibrations of a bridge and two buildings adjacent to a railway. They observed considerable increases in the response amplitude for train velocities larger than 80 km/h. Also, the amplitudes decreased rapidly with distance from the source. Heavier freight trains produced larger excitations at velocities similar to commute trains [5].
Galvin and Dominguez utilized a measurement and analysis approach to study the train induced vibrations of the Cordoba-Malaga railway of Spain inaugurated in 2007. The results of analysis were in good compliance with the recorded motions [6]. In another study, Shahmardani et al. studied floating tunnels under moving loads [7]. Length of tunnel was reported to be a decisive factor in extent of the dynamic response of the system.
In this paper the vibrations at the ground surface and in buildings adjacent to subway lines are studied. The main purpose is to implement a parametric study to investigate the relative effects of the above factors on the ground and building response (displacement, velocity, and acceleration) quantities. To make this end, a two-dimensional (2D) soil-tunnel-building system is modeled in SAP2000 software.
2. Standards for Relief against Vibrations
Human receives vibrations in two ways: either in the shape of vibrations felt by the part of the body in contact with vibrating surface, or in the form of an audible noise.
The ISO standards including ISO 14837 (2005) [7] and ISO 10815 (1996) [8] are respectively concerning train induced ground vibrations and measurement of such vibrations in railway tunnels. The main parameters cited in these standards are the duration of application of the dynamic load and the frequency content of excitation. The factors considered are building type,
natural frequencies and damping ratios, building dimensions and local soil type. ISO 2631-1 (1997) [9] recommends using RMS (Root-Mean-Square) of values to evaluate the human response to ground vibrations [10].
In addition, the Norwegian Standard Ns 8141 [11] has advised the maximum allowable vibrations for different buildings on various soils. Local soil conditions, type and material of building, distance from the source, and source type are the main parameters discussed in the above standards.
The threshold of comprehension of acceleration for an alert person at low frequencies (<1HZ) is 0.01 mm/s2. This quantity increases with frequency such that it reaches a value of 0.1 mm/s2 at 100 HZ [12]. If measurement of the vibration velocity is meant, the threshold is between 0.1-0.3 mm/s for the frequency range of 10-100 HZ. The threshold of comprehension is shown in Table 1 based on [1] for various cases.
The Department of Environmental Protection of Denmark [13, 14] and the Federal Transportation Administration (FTA) of the United States [15] has also recommended limitations for vibrations in buildings.
The potential for vibration damage in buildings depends on age, dimensions, decay, resonance frequency, and type of a building. In a study by Leventhall (1987), it was shown that the limit velocity safe against vibration damage in residential buildings is 50 mm/s. The damage threshold for historical buildings is much lower and is about 2 mm/s. It is seen that the vibration level for start of building damage even in old buildings is much larger than the threshold of relief for human. Therefore, the acceptable vibration limits for a building due to passing trains are determined by the allowable limits for human relief [16].
3. Modelling
3. 1. Material Characteristics and Elements Utilized
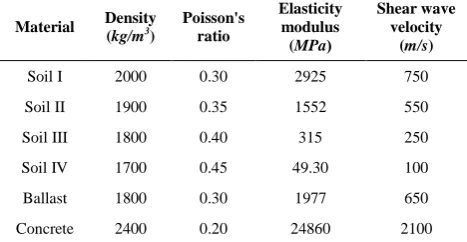
3. 1. 1. Soil Four types of soils labeled I to IV with the characteristics listed in Table 2 are selected. The above soil types represent very firm to very soft soils.
TABLE 1. Thresholds of human perception under vertical vibrations for a standing person [13].
Peak vertical velocity (mm/s) Peak vertical
acceleration (mm/s2)
Human feeling
0.5 34
Felt somewhat
1.3 100
Clearly felt
6.8 550
Annoying / undesirable
13.8 1800
The plane strain elements are used to model the soil. In all models, the ground is assumed to be consisting of a single homogeneous soil layer with a thickness of 70m on the bedrock, this is arbitrarily similar to the models investigated in [17]. In the horizontal direction, the soil model terminates at absorbing vertical boundaries accomodated with horizontal and vertical dampers. Such a simple absorbing boundary was first suggested by Lysmer and Kuhlemeyer [18], with the following damping coefficients Cn and Ct:
p
n v
C (Normal to the boundary) (1)
s
t v
C (Tangent to the boundary) (2)
in which is the mass density and vp and vsare the P- and S-wave velocities in soil.
Using the above boundary conditions results in a narrower model than a model with free (or constrained) vertical boundaries when assessing sensitivity of ground surface vibrations in the middle of the model to the transverse dimension of the model. The latter quantity proves to be 120 m, as a minimum value, for the above purpose through a trial process.
In the space between the rails and bottom of tunnel a layer of ballast 30 cm thick with the properties mentioned in Table 2 is placed.
3. 1. 2. The Structures The structure introduced in each model is a 2D single-bay frame ranging from 1 to 10 stories. The height of all stories is 3m and the span is 4m. The main variable of each structure is its fundamental period. The mass and stiffness of the structures are selected such that the natural period for the 1-story structure is 0.1 s, for the 2-story is 0.2 s, …, and for the 10-story structure is 1.0 s. The structural members are modelled using beam elements. The structural vibrations are assessed at two positions, once when centrally located over the tunnel, and once 10 m (center-to-center) from the vertical axis of the tunnel.
TABLE 2. Characteristics of materials used in the models.
Shear wave velocity
(m/s) Elasticity
modulus (MPa( Poisson's
ratio Density
(kg/m3)
Material
750 2925
0.30 2000
Soil I
550 1552
0.35 1900
Soil II
250 315
0.40 1800
Soil III
100 49.30
0.45 1700
Soil IV
650 1977
0.30 1800
Ballast
2100 24860
0.20 2400
Concrete
3. 1. 3. The Tunnel A tunnel with a concrete lining 0.2 m thick and with an internal diameter equal to 6m is introduced in each model. The compressive strength of the lining concrete is 28Mpa, with its other properties as mentioned in Table 2. To study the effect of depth, (distance of the
tunnel’s crest from the ground surface), three depths of 5, 10, and 15m as defined above, are considered. The tunnel’s section is modeled with frame elements.
3. 1. 4. Rail Pads At rail attachments usually rubber pads are used to reduce the impact effects of the train loads. The pads are modelled using the link elements with the stiffness and damping coefficients equal to
rp
K =153.4×10⁶ N/m and Crp=13.5×10³ Ns/m, respectively. These values correspond to UIC60 rails [19]. The transverse distance between the pads (equal to the rails spacing) is 1.435m.
3. 1. 5. Sleepers Sleepers are transverse beams perpendicular to rails. They act as bearings transferring the rail loads to the ground. Sleepers can be made of wood or concrete and are spaced based on the rail type. In this research, consistent with UIC60, use is made of concrete sleepers with a length of 2.5m, width of 0.235m, and thickness of 0.205m [20]. They are spaced at 0.65m beneath the pads, and modelled with beam elements. The schematic of the finite element model is shown in Figure 1.
3. 2. Loading X-2000, used in this research, is the common train utilized in railway studies. Characteristics of this train are shown in Figure 2 and Table 3. This train is about 112m in length and weighs 140 tons. It has four cars and one locomotive and possesses four axles at each car and the locomotive. As such, the weight of the train is shown as 10 pairs of forces. The first and last axles are spaced at 109m.
Figure 2. The geometry and axle loads of the X2000 train [19]
TABLE 3. Characteristics of the train X2000 [17]
5 4
3 2
1
Number of car, n
185.75 and 185.75 122.00
and 122.00 125.50
and 125.50 122.00
and 122.00 143.25
and 143.25 Pn1, Pn2
(kN)
2.90 2.90
2.90 2.90
2.90 an (m)
6.60 14.80
14.80 14.80
11.60 bn (m)
17.17 24.40
24.40 24.40
22.17 Ln (m)
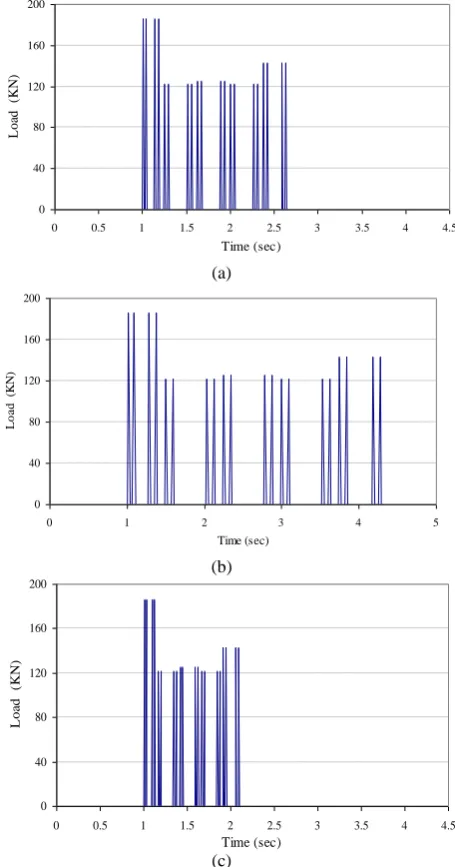
In this research only the main source of vibration that is due to weight and velocity of train is considered and other less important sources like various defects along the railway are disregarded. The procedure of dynamic loading in the system is such as each pad senses the coming wheel on the rail as an increasing load attaining its peak value when the wheel is exactly on the pad. Afterwards, the reaction on the pad decreases due to the outgoing wheel. This phenomenon repeats itself for the next coming wheel. The shape of the pad’s reaction time history depends on the train’s velocity. The velocities considered in this study are 60, 120, 180, 240, and 360 Km/h.
In Figure 3, the loading time history at a pad calculated from Figure 2 and Table 3 for three velocities of 120, 240, and 360 Km/h are shown. The duration of complete passing of a train over a single pad decreases from 3.3 s at 120 Km/h to 1.1 s at a velocity of 360 Km/h.
4. NUMERICAL RESULTS
4. 1. Verification Analysis At first, to check the accuracy of the developed model, an example is selected from the existing literature. This is taken from [18] that is a study on the Ledsgaard site. The soil consists of four layers with the properties mentioned in Table 4. The bedrock is at a depth of 70 m. A very long railway passes on an embankment constructed on the ground surface and the force induced by an X-2000 train and the vibration velocity of the some point are calculated. In the above reference, results of 2D, 3D, and field observations are presented.
(a)
(b)
(c)
Figure 3. Time history of loading for different velocities. (a)V=120 km/h (b) V=240 km/h (c) V=360 km/h.
According to an estimation by Kaynia et al. [20], for the embankment EI=200 MN.m2 and m=10800 kg/m, in which EI is the bending rigidity and m is the mass per unit length. In ref. [17] the load transferred from the embankment to the ground has been determined with multiplication of the ground displacement by the soil’s reaction factor K, with K=1.2E and E=430 Mpa where E is the elastic modulus of soil. For a velocity of V=120 Km/h, the loading and velocity time histories at the surface of embankment are as Figures 4-6.
In the above figures, the results of the analysis of this research using a similar model developed in SAP2000 are also shown. The accuracy is good especially at the point of loading that is far enough from the artificial model boundaries.
0 40 80 120 160 200
0 0.5 1 1.5 2 2.5 3 3.5 4 4.5 Time (sec)
L
oa
d
(
K
N
)
0 40 80 120 160 200
0 1 2 3 4 5
Time (sec)
Lo
a
d
(K
N
)
0 40 80 120 160 200
0 0.5 1 1.5 2 2.5 3 3.5 4 4.5
Time (sec)
L
oa
d
(
K
N
(a)
(b)
Figure 4. Time history of loading at the velocity V120km h/ .
a)Reference [17], b)present study
(a)
(b)
Figure 5. Time history of velocity at the loading point. (a) Reference [17], b) present study
(a)
(b)
Figure 6. Time history of velocity at 15 m from the loading
point. (a)Reference [17], (b)present study
According to [17], use of 2D models is warranted against 3D models for the points near to the axis of symmetry of the model (where the loads are applied). The accuracy diminishes for the points at farther distances from the center with more accuracy for larger train velocities.
4. 2. The Soil-tunnel Model (without Structure) The result of response analysis of this study are presented. The characteristics of the model are explained in Section 3. To begin the study, first the model is investigated under passage of the X2000 train at various velocities in the absence of the structure. The maximum vertical acceleration of the ground surface is shown in Figure 7 against distance from the tunnel axis for different soils.
Study of the diagrams of Figure 7 shows that the train induced accelerations are much less than the ground accelerations caused by strong earthquakes. Also, it is observed that the ground response reduces at a rapid rate with regard to distance from the source of vibration. The same applies also to the response velocity and displacement (not shown for brevity). Considering the face that in a two-dimensional modeling wave only propagates in the vertical plane, it can be expected that in reality the decay rate of the ground response would be even larger.
-100 -50 0 50
0 2 4 6 8
Time (s)
K
n
/m
-100 -50 0 50
0 2 4 6 8
Time (s)
K
n
/m
-200 0 200
0 2 4 6 8
Time (s)
V
el
oc
ity (
m
m
/s
)
-200 0 200
0 2 4 6 8
Time (s)
V
el
oc
ity (
m
m
/s
)
-50 0 50
0 2 4 6 8
Time (s)
V
el
oc
it
y (
m
m
/s
)
-50 0 50
0 2 4 6 8
Time (s)
V
el
oc
it
y (
m
m
/s
(a)
(b)
(c)
Figure 7. Change of maximum vertical surface ground acceleration with distance from axis of the tunnel located at a
depth of 5m at different velocities. a) V=120 km/h b) V=240
km/h c) V=360 km/h
In other words, the actual values of acceleration should be somewhat less than those presented in Figure 7 and the difference would be larger for farther distances.
In relation with the soil type effect, the graphs show that for a certain train velocity, the ground responses increase for softer soils at nearer distances to the tunnel axis where the general level of vibration is considerable. At the same time, the decay rate of vibration against distance is larger for softer soils due to a larger damping in such soils. At smaller train velocities, the graphs represent much larger responses for softer soils compared with other soil types. Therefore, areas with loose soils should be closely studied and in the case of
trains passing through such grounds, effective remedies for reduction of vibration should be considered.
Another interesting point observed in the diagrams, at the tunnel axis, is accelerations of the different soils being largest for a certain train velocity. In the soil type IV, acceleration of the ground surface at the tunnel axis is larger at the train velocity of 120 Km/h. For the soil type III, the corresponding velocity is 240 Km/h. For the other two soil types that are stiffer, the same acceleration is rising gradually apparently toward larger train velocities that are out of the practical range of velocities. Therefore, soft to intermediate soils can considerably amplify the accelerations of passing underground trains and this fact should be taken into account in the design of such systems.
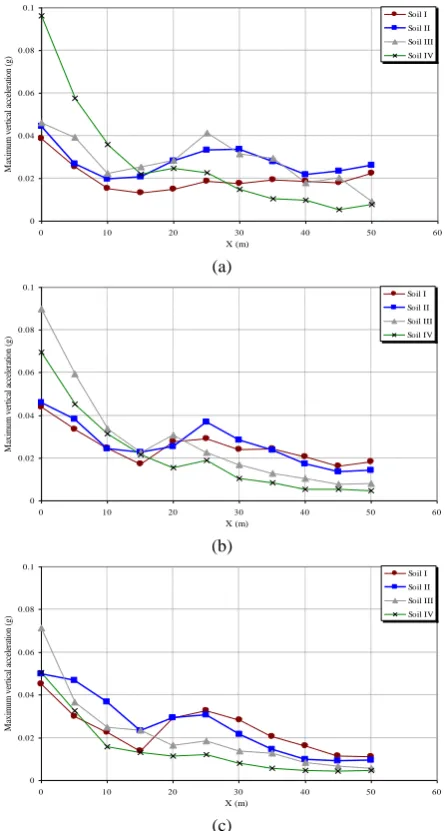
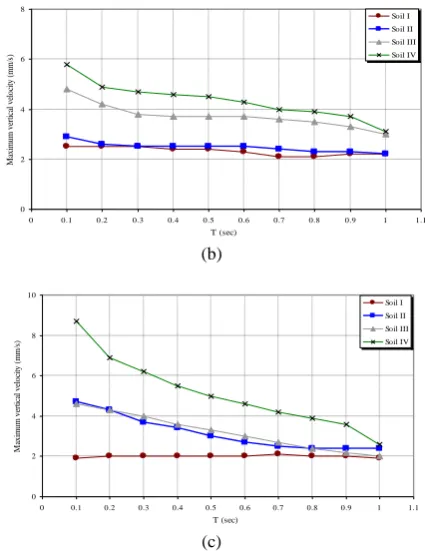
4. 3. The soil-tunnel-structure Model The results of vibration studies in the presence of structure are investigated in this section. The analytical model is shown in Figure 1. Referring to this figure, the structure under study once is located on the tunnel (a symmetric system) and the other time at 10m from the tunnel axis. For brevity, only the results for the symmetric problem will be presented. It should be mentioned that the structure on the axis of symmetry will have no horizontal response when the members are totally rigid in axial direction. For the unsymmetrical problem horizontal response would also be existing. For a better view due to larger responses, all of the diagrams of structural response have been extracted from the midspan of the last story. In these calculations, three different tunnel depths of 5,10, and 15m have been considered but only the results of the 5m depth will be presented and the other results will be briefly mentioned too. The comprehensive results are presented in ref. [20]. as stated in Section 4.6.2, the fundamental period of structure varies from 0.1 s for a single story structure to 1 s for a 10-story building. In Figures 8 and 9, respectively, variations of vertical acceleration and velocity of the roof are shown against building period for different soils. The displacement diagrams have not been presented since both they possess very small values being less than 1mm in all cases and they are not important for evaluation of relief according to Table 1. The diagrams are shown only for three velocities of 120, 240, and 360 Km/h that are enough for a general conclusion. Diagrams have also been calculated for 60 and 180 Km/h velocities and presented in [20]. It should be pointed out that Figures 8 and 9 are not response spectra, instead they show the total response considering all natural models for structures having the fundamental periods shown, which have been determined using the direct integration procedure.
A common point between Figures 8 and 9 is occurrence of peak responses at small periods and their gradual decrease for larger periods.
0 0.02 0.04 0.06 0.08 0.1
0 10 20 30 40 50 60
X (m)
M
axi
m
um
ve
rt
ic
al
a
cc
el
era
ti
on
(g)
Soil I Soil II Soil III Soil IV
0 0.02 0.04 0.06 0.08 0.1
0 10 20 30 40 50 60
X (m)
M
axi
m
um
ve
rt
ic
al
a
cc
el
era
ti
on
(g)
Soil I Soil II Soil III Soil IV
0 0.02 0.04 0.06 0.08 0.1
0 10 20 30 40 50 60
X (m)
M
axi
m
um
ve
rt
ic
al
a
cc
el
era
ti
on
(g)
(a)
(b)
(c)
Figure 8. Maximum vertical acceleration of the roof of structures vs their natural period, for a tunnel depth of 5m at
different train velocities. a) V=120 km/h b) V=240 km/h c)
V=360 km/h
(a)
(b)
(c)
Figure 9. Maximum vertical velocity of the roof of structures vs their natural period, for a tunnel depth of 5m at different
train velocities. a) V=120 km/h b) V=240 km/h c) V=360
km/h
Generally, it is exacted in soil-structure systems that largest responses occur at the fundamental period of site. This is especially true for sites consisting of a thick single layer, like that of the present study. On the other hand, according to the well known equation, the natural period of these sites equals four times the soil thickness divided by their shear wave velocity being equal to 0.4 to 2.8 s for the soil tyes I to IV. No resonance is observed in Figures 8 and 9 at this range of periods (larger periods are not shown in these figures because of negligible responses). The reason for this apparent contradiction is that the above expectation is only true for a seismic response since it usually covers small to medium periods and causes a resonance in sites with the same natural periods. But, in the present problem, the dynamic loading is due to passage of trains. Use of the Fourier analysis to determine the frequency content of such a loading encounters numerical problem because of the loading complexity (see Figure 3). On the other hand, a good estimation of the range of governing periods of the above loading can be fulfilled using a simple hand calculation. For this purpose, referring to Figure 3 makes it clear that the governing periods correspond to the time lapse between passage of two consecutive wheels over a certain pad. This value depends on the distance between wheels and the train
0 0.02 0.04 0.06 0.08 0.1 0.12 0.14
0 0.1 0.2 0.3 0.4 0.5 0.6 0.7 0.8 0.9 1 1.1 T (sec) M axi m um ve rt ic al a cc el era tion (g) Soil I Soil II Soil III Soil IV 0 0.01 0.02 0.03 0.04
0 0.1 0.2 0.3 0.4 0.5 0.6 0.7 0.8 0.9 1 1.1 T (sec) M axi m um ve rt ic al a cc el era tion (g) Soil I Soil II Soil III Soil IV 0 0.01 0.02 0.03 0.04 0.05
0 0.1 0.2 0.3 0.4 0.5 0.6 0.7 0.8 0.9 1 1.1 T (sec) M axi m um ve rt ic al a cc el era tion (g) Soil I Soil II Soil III Soil IV 0 5 10 15 20
0 0.1 0.2 0.3 0.4 0.5 0.6 0.7 0.8 0.9 1 1.1
T (sec) M axi m um ve rt ic al ve loc it y (m m /s ) Soil I Soil II Soil III Soil IV 0 2 4 6 8
0 0.1 0.2 0.3 0.4 0.5 0.6 0.7 0.8 0.9 1 1.1 T (sec) M axi m um ve rt ic al ve loc ity (m m /s ) Soil I Soil II Soil III Soil IV 0 2 4 6 8 10
velocity. According to the spacing mentioned in Table 3, it is calculated to be 0.03-0.44 s being centered at a small period of about 0.1 s because of repetition of smaller spacing (almost 2.5 times more compared to larger distances). It is interesting to note that the period corresponding to the maximum responses in Figures 8 and 9 is equal to the same quantity. It can be concluded from the above reasoning that, first, the dynamic loading of the underground trains is of high-frequency type, and second, the structural response due to passing trains is affected by the governing period of loading not the natural period of site.
Another important point to mention is determination of relief thresholds in the above diagrams. Referring to Figures 8 and 9 and comparing the peak acceleration and velocity with the values presented in Table 1, it is observed that regarding the vibration’s acceleration, except of the buildings having seven stories or more on soft soils, in other cases train induced vibrations are clearly sensible at least in the upper floors. At the train velocity of 120 Km/h and in the structures up to seven stories on hard soils and up to four stories on soft grounds, these vibrations reach disturbing levels. Regarding vibration velocity, oscillations due to trains are clearly sensible in all cases. At the same time, only for a velocity of 120 Km/h, vibrations can reach disturbing and even irritating levels. Disturbing vibrations are observed up to 8-story buildings on soft or hard soils while irritating vibrations on these soils occur up to 3-story structures.
Regarding the structural behavior, as mentioned before, the threshold of vibration velocity for beginning of nonstructural damage (cracking of wall cover) has been suggested to be 2 mm/s for historical buildings and 50 mm/s for other buildings. On this basis, according to Figures 8 and 9, historical buildings crack almost for all of the studied cases regarding train velocity, soil type, and structure’s natural period but no problem arises for other buildings. This fact highlights the necessity for special considerations for reducing vibration levels where underground trains pass in the vicinity of such buildings.
It should be reminded that the above calculations have been repeated for the structure on the tunnel axis (Figure 2) for tunnel depths of 5, 10, and 15m and the structure located at a distance of 10m from the axis for similar tunnel depths. As a result, it was cleared that for absolute relief it is necessary for a structure to be at a minimum central distance of 10m for a tunnel depth of 15m. With an approximate extrapolation of results it can be said that the structure at a distance of 20m fulfills relief for a tunnel depth of 10m. But, in none of the above cases, the no-crack limit is satisfied for historical buildings, i.e, such structures would crack in similar conditions. Again, with an approximate extrapolation of results, it is determined that for a historical building not to crack, it is necessary for it to be at a minimum
horizontal distance of 40m from tunnel being at a 15m depth, or, at least at a distance of 30m from a 10m-depth tunnel.
In the cases that the building is not located on the axis of tunnel, horizontal responses also occur. In all of the studied cases, value of the maximum horizontal response has been considerably smaller than the corresponding peak vertical response being at most two-thirds of the latter.
5. SUMMARY AND CONCLUSIONS
In this research a system consisting of soil, a tunnel, and a structure located on ground surface was studied subjected to vibrations induced by trains moving in the tunnel at different velocities. The analysis was implemented as a linear dynamic procedure with direct integration. Maximum vertical responses of the ground surface and the structure’s roof (acceleration, velocity, displacement) were calculated under the effects of different factors including train velocity, soil type, building period, and tunnel depth. The important results of the study are as follows:
1. While vibration amplitudes due to passing trains at the ground surface and in the structure are smaller than strong earthquakes, they possess a much higher frequency content. Therefore, effect of such vibrations is more highlighted for shorter and stiffer buildings.
2. Ground surface responses are much higher for the points in the vicinity of tunnel in soft soils compared with other soils.
3. Acceleration response of ground surface reaches its peak value at smaller train velocities in softer soils. The corresponding train velocity is larger than the practical train velocities for stiff soils.
4. Response of structures being adjacent to underground train tunnels is determined by the governing period of the train loading and is insensitive to the natural period of site. The absolute maximum values of peak responses belong to short buildings.
5. In the case of not using other means, as a result of this study it is suggested that to provide for an absolute relief, the structure is located at least at a horizontal distance of 10m from the tunnel axis when the tunnel depth is 15m, or, it is located 20m from the tunnel when the latter is at a depth of 10m.
6. For the effect of underground train vibrations on structures, this study shows that historical buildings always crack for the numerous cases studied but no problems arise for other buildings. According to the current study, the necessary condition for no induced crack in a historical building is that it is located at a distance of 20m for a 15m-depth tunnel, or, 30m for a tunnel at a depth of 10m.
value never surpasses two-thirds of the maximum vertical response.
6. Acknowledgement
The scientific support of Isfahan University of Technology is gratefully acknowledged.
7. References
1. Bahrekazemi, M., "Train-induced ground vibration and its prediction", (2004).
2. Hendry, M.T., "Train-induced dynamic response of railway track and embankments on soft peaty foundations", College of Graduate Studies and Research in Partial Fulfillment of the Degree of Master of Science in the Department of Civil Engineering, University of Saskatchewan, Saskatoon, Canada, (2007),
3. Yang and Hsu, "A review of researches on ground-borne vibrations due to moving trains via underground tunnels",
Advances in Structural Engineering, Vol. 9, No. 3, (2006), 377-392.
4. Gupta, S., Liu, W., Degrande, G., Lombaert, G. and Liu, W., "Prediction of vibrations induced by underground railway traffic in beijing", Journal of Sound and Vibration, Vol. 310, No. 3, (2008), 608-630.
5. Xia, H., Zhang, N. and Cao, Y., "Experimental study of train-induced vibrations of environments and buildings", Journal of Sound and Vibration, Vol. 280, No. 3, (2005), 1017-1029. 6. Galvín, P. and Domínguez, J., "Experimental and numerical
analyses of vibrations induced by high-speed trains on the córdoba–málaga line", Soil Dynamics and Earthquake Engineering, Vol. 29, No. 4, (2009), 641-657.
7. Shahmardani, M., Mirzapour, J., Gheyratmand, C. and Tariverdilo, S., "Moving load analysis of submerged floating tunnels", International Journal of Engineering, Vol. 25, No. 1,
(2012), 17-24.
8. Standard, I. and ISO, B., "Mechanical vibration—ground-borne noise and vibration arising from rail systems", ISO 14837, Vol. 1, (2005).
9. 10815, I., "Mechanical vibration - measurements of vibration generated internally in railway tunnels by the passage of trains", (1996).
10. Standardization, I.O.f., "Mechanical vibration and shock-evaluation of human exposure to whole-body vibration-part 1: General requirements, The Organization, (1997).
11. SEK, S.E.K., "Vibration och stöt, riktvärden för sprängningsinducerade vibrationer i byggnader", SS 460 4866, (1991).
12. Association, N.S., "Vibration and shock - measurement of vibration velocity and calculation of guideline limit values in order to avoid damage on construction", NS 8141, ( 2001). 13. Griffin, M.J., "Handbook of human vibration, Academic press,
(2012).
14. Jakobsen, J., "Danish guidelines on environmental low frequency noise, infrasound and vibration", noise notes, Vol. 2, No. 2, (2003), 10-18.
15. Hanson, C.E., Towers, D.A. and Meister, L.D., Transit noise
and vibration impact assessment. 2006.
16. Leventhall, H., "Low frequency noise and annoyance", Noise and Health, Vol. 6, No. 23, (2004), 59.
17. Wolf, J.P. and Song, C., "Finite-element modelling of unbounded media, Wiley Chichester, (1996).
18. Lysmer, J. and Kuhlemeyer, R.L., "Finite dynamic model for infinite media", Journal of the Engineering Mechanics Division, Vol. 95, No. 4, (1969), 859-878.
19. Lombaert, G., Degrande, G., Kogut, J. and François, S., "The experimental validation of a numerical model for the prediction of railway induced vibrations", Journal of Sound and Vibration, Vol. 297, No. 3, (2006), 512-535.
Analysis of Structural Vibrations due to Passage of Underground Trains
F. Behnamfara,A. Moghtaderi Esfahania, R. Nikbakhtb, M. Ghandila
a Department of Civil Engineering, Isfahan University of Technology, Esfahan, Iran b Senior structural Engineer, Esfahan, Iran
P A P E R I N F O
Paper history: Received 04 May 2015
Received in revised form 02 June 2016 Accepted 02 June 2016
Keywords: Train Soil Underground Tunnel Structure Vibration Finite Elements
ديكچ ه
ٌذض زتعیزس یزتزفاسم یاَراطق ،نامشمَ .تسا ٌدًت صیاشفا ٍت ير ٍتسًیپ زیخا یاَ ٍَد رد تیعمجزپ قطاىم رد اَراطق ددزت
ض حزطم هیمس رد شاعترا ذیلًت عثىم کی ناًىع ٍت ،زت یذج ٍچزَ ،اَراطق ،ٍجیتو رد .ذوا ٌذض زت هیگىس یرات یاَراطق ي ي ٌذ
لذم کی ،صَيژپ هیا رد .تسا ٌذض راذگزیثات صیپ سا صیت تاشیُجت ي اُوامتخاس دزکلمع ي دازفا صیاسآ زت نآ سا یضاو راثآ
رازق یطخ یکیماىید لیلحت تحت هیمس زت عقاي ٌساس ي کاخ ،لوًت ،سريازت ،لیر ،یىیمسزیس راطق کی لماض یکیماىید یذعتيد
اطم هیا سا رًظىم .تسا ٌذض ٌداد )ییاجتاج ي تعزس ،باتض( ٌساس یاَ صىکاي زثکاذح زت زثًم لماًع یزتماراپ یسرزت ،ٍعل
ات راطق تکزح .ذوا ٌذض ٍتفزگ زظورد لوًت قمع ي ٌساس یعیثط بياىت نامس ،کاخ تاصخطم ،راطق تعزس تازثا .ذضات یم
ُسريازت ،اَُاگ ٍیکت ،لیر یساسزیس ي کزحتم یاَرات ٍعًمجم کی ات نآ یىیشگیاج یاُواملا سا ٌدافتسا ات لوًت صضًپ ي ا
یاُواملا ي حطسم صوزک یاُواملا یزیگراک ٍت ات ةیتزت ٍت هیمس حطس زت عقاي ٌساس ي فازطا کاخ .ذودزگ یم لذم ةساىم
ییاساىض ٍت زجىم متسیس یوامس ٍچخیرات لیلحتو .دًض یم ضزف یطخ یعاجترا ترًص ٍت متسیس راتفر .ذوًض یم لذم یتاق
یاُتلاح ناىکاس صمارآ یاَزظو ٍطقو سا هیمس حطس شاعترا یوازحت تلااح ي ٌذض نآ زت زثًم مُم لماًع ي صىکاي یوازحت
.ددزگ یم هییعت ٌساس راتفر ي نامتخاس
![TABLE 1. Thresholds of human perception under vertical vibrations for a standing person [13]](https://thumb-us.123doks.com/thumbv2/123dok_us/216706.2016138/2.595.308.544.672.757/table-thresholds-human-perception-vertical-vibrations-standing-person.webp)
![Figure 6. Time history of velocity at 15 m from the loading point. (a) Reference [17], (b) present study](https://thumb-us.123doks.com/thumbv2/123dok_us/216706.2016138/5.595.63.283.440.721/figure-time-history-velocity-loading-point-reference-present.webp)