*Corresponding author: Muthuvel, I ISSN: 0976-3031
Research Article
DEVELOPMENT OF Zn
3(PO
4)
2/ ZnO-COUPLED SEMICONDUCTOR SYSTEM FOR EFFECTIVE
MINERALIZATION OF BASIC VIOLET 10 (BV 10)
UNDER UV-A LIGHT
Rajasri, S
1., Krishnakumar, B
2., Sobral, AJFN
2., Balachandran, S
3., Swaminathan, M
4.,
Pasupathy, N
5and * Muthuvel, I
11
Advanced Photocatalysis Laboratory, Department of Chemistry, Annamalai University,
Annamalai Nagar 608 002, India
2
Department of Chemistry, University of Coimbra, 3004-535 Coimbra, Portugal
3
Beijing National Laboratory for Molecular Sciences, Key Laboratory of Engineering Physics,
Institute of Chemistry, Chinese Academy of Sciences, Beijing 100 190, P.R China
4
Nanomaterials Laboratory, International Research Centre, Kalasalingam University,
Krishnan Koil 626 126, India
5
Department of Chemistry, A.V.C. College (Autonomous), Mannampandal,
Mayiladuthurai 609305, India
DOI: http://dx.doi.org/10.24327/ijrsr.2017.0810.0943
ARTICLE INFO ABSTRACT
Novel Zn3(PO4)2 loaded with ZnO composites are prepared and characterized by XRD, FT-IR,
Raman, BET, HR-SEM with EDX, HR-TEM, UV-DRS, and PL analysis. The prepared materials are used to remove the dye Basic Violet 10 (BV 10) using UV-A light. The effect of experimental parameters such as catalyst loading, pH, and dye concentration are also studied. Up to five runs, approximately 96% of dye has been mineralized at 90-min irradiation under UV light. Thecoupled semiconductor system enhances the photocatalytic activity for multiple runs due of its remarkable stability.
INTRODUCTION
In the recent years, photocatalytic environmental remediation has received considerable attention due to a wide range of application in wastewater treatment and alternative clean energy (Xiang et al, 2012; Jiang et al, 2012; Usubharatana et al, 2006; Raji and Palanivelu,2011; He et al, 2012). Mineralizing organic pollutants by using photocatalysis have few advantages, e.g., fast mineralization, high-rate degradation, and ecofriendlyness (Yu et al, 2013; Cid et al, 2012; Yu et al, 2013; Frontistis et al, 2012; Danwittayakul et al, 2013). A number of wide band gap semiconductor photocatalysts, such as TiO2 (He et al, 2014; Radeka et al, 2013), ZnO (Yu et al,
2013), SnO2 (Wang et al, 2013), and ZnS (Chen et al, 2013)
have been used for this process. Among them, ZnO is a widely investigated photocatalyst as it is non-hazardous to the environment, cheap, and has excellent oxidizing nature with high stability (Yu et al, 2009; Yu et al, 2012; Yu et al, 2012 ;
Bui et al, 2010; Yu et al, 2009; Wang et al, 2014; Wei et al,
2013). On UV light irradiation, the (e-) in valence band of ZnO and excited, generating electron (e-) and hole (h+) pairs. These electrons and holes move to the surface of ZnO and react with
OH and O2, they are adsorbed on the surface of ZnO,
producing highly potent radicals [OH, O2-, etc.]. The use of
ZnO is hindered by some apparent drawbacks: (i) high recombination of photogenerated electron-hole, (ii) the narrow
Recent Scientific
Research
International Journal of Recent Scientific Research
Vol. 8, Issue, 10, pp. 20688-20695, October, 2017
Copyright © Rajasri, S et al, 2017, this is an open-access article distributed under the terms of the Creative Commons Attribution License, which permits unrestricted use, distribution and reproduction in any medium, provided the original work is properly cited.
DOI: 10.24327/IJRSR CODEN: IJRSFP (USA)
Article History: Received 17th July, 2017 Received in revised form 21th August, 2017
Accepted 28th August, 2017 Published online 28th October, 2017
Key Words:
Zn3(PO4)2/ZnO, Basic Violet 10,
Under Uv-A Light
light responsive range, and (iii) photocorrosion. To overcome these limitations, various strategies such as doping of ZnO and coupling of semiconductor oxides (Liu et al, 2011; Mapa and Gopinath, 2009; Huang et al, 2011; Jung and Yong, 2011; Cho
et al, 2011) have been carried out.
Zinc phosphate (Zn3(PO4)2) is an important multifunctional
inorganic and a kind of commonly used luminescent host material. Moreover, it is a wide band gap and environmentally friendly material, and it will be applied in this study as the semiconductor coupled with ZnO. This composite can be used to mineralize BV 10 aqueous solutions effectively. A new class of transition metal phosphate such as Zn3(PO4)2 a wide band
gap nanomaterial was coupled with ZnO. This coupled Zn3(PO4)2/ZnO (ZnP/ZnO) nanocomposites are used for
effective mineralization of BV 10 aqueous solution.
Experimental
Zn(NO3)26H2O, C2H2O42H2O, Na2HPO4, and C2H5OH are
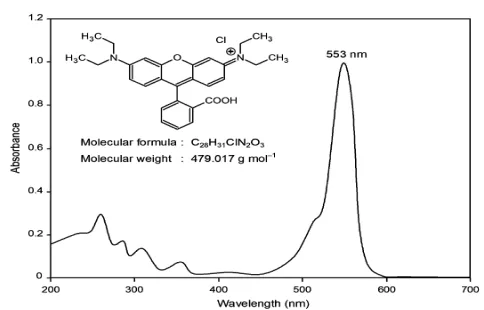
obtained from Himedia chemicals. Basic Violet 10 (Colour Chem, Pondicherry, C28H31C1N2O3) is used as received. The
deionized water (DI) is used to prepare the experimental solution.
Preparation of ZnP/ZnO
Equimolar aqueous solution of zinc nitrate with Na2HPO4 is
stirred using magnetic stirrer for an hour, and the obtained Zn3(PO4)2 precipitate is filtered, washed with double distilled
water, and dried at 100 C for 3 h. 100 mL of 0.4 M zinc nitrate hexahydrate and 100 mL of 0.6 M oxalic acid in deionized water are brought into boil separately, and zinc nitrate solution is added rapidly to the oxalic acid solution and then immediately 0.123 g of Zn3(PO4)2 is added to this and the
mixed suspension is stirred for 3 h. The formed precipitate zinc oxalate dihydrate with Zn3(PO4)2 is filtered, washed with DI
water several times, dried in hot air oven at 80 C for 6 h. Zn3(PO4)2-zinc oxalate dihydrate-coupled system is taken in a
silica crucible and calcined at 450 C for 12 h in the muffle furnace at the rate of rising temperature 20 C min-1. After 12 h, the furnace is allowed to cool down to room temperature. The ZnP/ZnO catalyst is collected and used for further analysis. This catalyst has 5 wt% of Zn3(PO4)2, and catalysts similarly
with 1, 3, and 7 wt% of Zn3(PO4)2-coupled ZnO are prepared
using appropriate amount of Zn3(PO4)2. The bare ZnO catalyst
is prepared this procedure without Zn3(PO4)2.
Characterization
X-Ray diffraction (XRD) patterns are recorded with a Siemens D5005 diffractometer using CuK (K = 0.051418 nm) radiation. Maximum peak positions are compared with the standard files to identity the crystalline phase. The Fourier transform infrared (FT-IR) spectra are obtained on KBr pellets on thermo scientific Nicolet spectrometer in the range of 4000-400 cm-1. Fourier transform-Raman spectra are recorded with an integral microscope Raman system using Bruker RFS27 100 s-1 (1064 nm) spectrometer equipped with 1024 256 pixels liquefied nitrogen-cooled germanium detector. Measurements are done using a frequency doubled neodymium doped yttrium aluminium garnet (Nd:YAG). The sample, the laser power at the sample is not above 15 mW. Each spectrum
is recorded with an acquisition time of 18 s. The spectral resolution of this Raman spectrometer is ~2 cm−1. The specific surface areas of the samples are determined through nitrogen adsorption at 77 K on the basis of BET equation using Micrometrics ASAP 2020 V3.00 HX. The surface morphology of the HR-SEM images are taken using FEI quanta FEG 250 high resolution scanning electron microscope. The surface morphology of ZnP/ZnO was studied by Model ULTRA-55 EDX analysis on gold-coated samples using a JEOL JSM-5610 SEM equipped with EDX. The sample is prepared by placing a small quantity of the prepared material on a carbon-coated copper grid and allowing the solvent to evaporate by high resolution transmission electron microscopy (HR-TEM), TECNAI G2 FEI F12 model. Diffused reflectance spectra are recorded using Shimadzu UV-2450 spectrophotometer, and UV absorbance measurements are taken using Shimadzu spectrometer UV-1650 PC UV-visible spectrophotometer. A Perkin Elmer LS 55 fluorescence spectrometer is employed to record the photoluminescence (PL) spectra of the oxides at room temperature.
Photodegradation Procedure
Photocatalytic activity of the prepared samples for decomposing organic pollutant BV 10 is evaluated under UV light (365 nm) irradiation. 50 mL dye solution with ZnP/ZnO after the attainment of equilibrium is irradiated with UV light. At specific time intervals, 2-3 mL of the sample is withdrawn and centrifuged to separate the catalyst. 1 mL of the centrifugate is diluted to 10 mL and its absorbance is measured at 545 nm (5 10-4) for BV 10. The light intensity of UV light is 1.381 10-6 einstein L-1 s-1. Detailed procedure has been reported in our earlier paper (Kuhn et al, 2004).
RESULTS AND DISCUSSION
Powder XRD Analysis
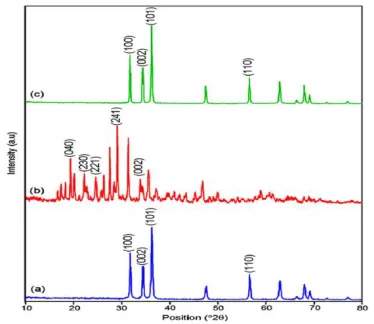
X-Ray diffraction (Figure 1) shows that the typical XRD patterns of the prepared ZnO (Figure 1a), Zn3(PO4)2 (Figure
1b), and ZnP/ZnO (Figure 1c) samples. The characteristic peaks of ZnO at 2 values 31.77, 34.49, 36.23, and 56.60
correspond to (100), (002), (101), and (110) planes of wurtzite ZnO (Yiamsawas et al, 2009). No other peaks can be detected in the XRD pattern indicating the purity of the samples. Figure 1b shows the 2 values 20.0, 21.53, 23.30, 25.0, 29.50, 31.77, 34.77, 34.49, and 35.10 correspond to Zn3(PO4)2
(Wang et al, 2012). The high intense (001) peak is correspond to zinc phosphate [(Zn3(PO4)2) Card No. 33-1474, 37-0316 and
37-0465]. The XRD pattern of ZnP/ZnO is shown in Figure 1c, diffraction pattern of ZnP/ZnO has no difference from that of ZnO. This reveals that ZnO in ZnP/ZnO also has a wurtzite structure. Apart from this, it is found no new peaks for Zn3(PO4)2 in the ZnP/ZnO catalyst, whereas Zn3(PO4)2 showed
nine strong peaks at 20.0, 21.53, 23.30, 25.0, 29.50, 31.77, 34.77, 34.49, and 35.10 (Figure 1c). This is due to the low concentration of Zn3(PO4)2 on ZnO. The Scherrer
equation (equation 1) is employed to calculate the average crystalline size of ZnP/ZnO and it is found to be 44 nm.
where D is the crystalline size, λ is the wavelength X-ray used, K is the shape factor, is the full width half maximum high of peak, and is the Bragg angle.
Figure 1 XRD patterns of a) prepared ZnO, b) Zn3(PO4)2 and c) ZnP/ZnO.
FT-IR Spectra
The FT-IR spectra of prepared ZnO, Zn3(PO4)2 and ZnP/ZnO
samples are shown in Figure 2a-c. The surface hydroxyl (OH) stretching vibrations are observed at 3500-3300 cm-1 for all the samples. The peaks at 917 and 670 cm-1 indicate the Zn-O stretching vibrations (Figure 2a) (Mitra et al, 2012). In Figure 2b and c, the PO42- stretching vibrations are observed in the
range of 947 to 1200 cm-1 (Zhang et al, 2010). The band at 1640 cm-1 is ascribed as OH bending vibrations in Zn3(PO4)2
and ZnP/ZnO (Pawlig et al, 2001). Symmetric PO42- stretching
vibration is observed at 1120 cm-1 (Figure 2c) that confirms the formation of hybrid nanocomposite ZnP/ZnO.
Figure 2 FT-IR spectra of a) prepared ZnO, b) Zn3(PO4)2 and c) ZnP/ZnO.
Raman Spectra
Figure 3 shows the Raman spectra of prepared ZnO (Figure 3a), Zn3(PO4)2 (Figure 3b), and ZnP/ZnO (Figure 3c). The
bands at 378, 410, 440, 575, and 590 cm-1 are attributed to optical phonons of ZnO. These bands correspond to E2 and second-order Raman bands arising from zone boundary phonons of the hexagonal ZnO (Krishnakumar et al, 2014). The band at 590 cm-1 can also be assigned to the A1 (lattice oxygen) mode of the hexagonal ZnO (Alim et al, 2005). The absorption bands at 375 and 875 cm-1 are attributed to P-O bending and stretching vibrations, respectively, in Zn3(PO4)2
(Figure 3b) (Wang et al, 2011). The absorption bands in the range of 1480-1700 cm-1 assigned to O-H stretching. The
Raman spectrum of ZnP/ZnO is shown in Figure 3c, and vibration bands of ZnP/ZnO has no difference from that of Zn3(PO4)2 except some slight peak shifts. Since Zn3(PO4)2 is
more Raman active when compared with ZnO.
Figure 3 FT-Raman spectra of a) prepared ZnO, b) Zn3(PO4)2 and c) ZnP/ZnO.
BET Surface Area
The pore structure of the ZnP/ZnO (Figure 4) composite sample is investigated by nitrogen adsorption-desorption isotherms and pore size distribution are calculated by BJH method. The N2 adsorption-desorption isotherms of ZnP/ZnO
exhibited a hysteresis loop, typical of type II pattern with respect to the classification of IUPAC (Chang et al, 2009). A sharp intense in the adsorption volume of N2 is observed and
located in P/Po range of 0.8-0.99. This increase is attributed to
the capillary condensation, indicating the good homogeneity of the sample and a pore size > 50 nm for the P/Po position of the
inflection point, which confirms the macroporous structure (inset Figure 4b). The single point adsorption total pore volume of pores less than 996.84 Å radius at P/Po = 0.99036 is 0.02754
cm3 g. This type of isotherm indicates the presence of macroporous structure in ZnP/ZnO.
Figure 4 a) N2 adsorption-desorption isotherm of ZnP/ZnO and b) pore size
distribution.
HR-SEM and EDX Analysis
HR-SEM images of prepared ZnO (Figure 5a-c), Zn3(PO4)2
Under Uv-A Light
indicate the plate-like structure (Figure 5g-i) that is also reflected in the HR-SEM images of ZnP/ZnO (Figure 5g-i, indicated by arrow marks). ZnP/ZnO exhibits a chain-like structure (Figure 5g-i) and ZnO particles are well dispersed on Zn3(PO4)2 plates that are nanochains. Zn3(PO4)2 loading
retreated the aggregation of ZnO. The EDX of ZnP/ZnO is displayed in Figure 6. EDX of ZnP/ZnO reveal the presence of P, Zn, and O in the catalyst (Figure 6).
Figure 5 HR-SEM images of a-c) prepared ZnO, d-f) Zn3(PO4)2 and g-i)
ZnP/ZnO at different magnifications of 2 m, 5 m and 10 m.
Figure 6 EDX analysis of a) prepared ZnO, b) Zn3(PO4)2 and c) ZnP/ZnO.
HR-TEM Analysis
High-resolution transmission electron microscope (HR-TEM) images of ZnP/ZnO at different magnification are shown in Figure 7. At higher magnifications, the hexagonal structure of ZnO particles are clearly seen (Figure 7c and d). It can be seen that the ZnP/ZnO particles are in nm sizes and are approximately in the range of 30-50 nm.
Figure 7 HR-TEM images of ZnP/ZnO at different magnifications: a) 200 nm, b) 100 nm, c) 50 nm and d) 20 nm.
UV-DRS Analysis
The absorbance spectra of prepared ZnO, Zn3(PO4)2, ZnP/ZnO
are shown in Figure 8a-c, respectively. Although absorption edge of Zn3(PO4)2 extend in visible region (above 400 nm)
(Figure 8b), it is not reflected in the absorbance spectrum of ZnP/ZnO (Figure 8c), which almost resembles with prepared ZnO (Figure 8a). ZnP/ZnO has higher absorption in UV range. In Figure 8a-c, Kubelka-Munk analyses for allowed direct band gaps for prepared ZnO, Zn3(PO4)2 and ZnP/ZnO are shown in
insets of Figure 8a-c, respectively. The estimated optical band gaps of prepared ZnO, Zn3(PO4)2, and ZnP/ZnO are ~3.20,
3.07, and 3.23 eV, respectively.
Figure 8 DRS of a) prepared ZnO, b) Zn3(PO4)2 and c) ZnP/ZnO. Inset shows
the plot of [F(R)h]2Vs h (eV) for determining band gap energy of i) prepared
ZnO, ii) Zn3(PO4)2 and iii) ZnP/ZnO.
PL Spectra
Photoluminescence (PL) spectra of prepared ZnO, Zn3(PO4)2,
and ZnP/ZnO are shown in Figure 9a-c, respectively. PL intensity is directly proportional to the rate of electron-hole recombination (Wang and Gao, 2004). Prepared ZnO gave two emissions at 410 and 435 nm. Loading Zn3(PO4)2 with ZnO
does not change the emission of ZnO, but the PL intensity is less than ZnO. This is due to the suppression of recombination of electron-hole pairs by loaded Zn3(PO4)2, which enhanced the
photocatalytic activity of the catalyst.
Figure 9 PL spectra of a) prepared ZnO, b) Zn3(PO4)2 and c) ZnP/ZnO.
Photocatalytic Activity of ZnP/ZnO Catalysts
The photocatalytic activities of Zn3(PO4)2 loaded ZnO
Figure 10 Structure of BV 10 and its absorption spectrum. Absorbance maximum at 553 nm.
Primary Analysis
The photocatalytic activities of the ZnP/ZnO catalysts with 1, 3, 5 and 7 wt% of zinc phosphate loading were analyzed by the degradation of BV 10. Controlled experiments under different conditions were carried out and the results are displayed in Figure 11. The dye is found to be resistant to self-photolysis by UV light. In the presence of dye/ZnO/dark a decrease (21%) in dye concentration occurs and remains almost constant up to 90 min (curve a). The dye on irradiation with ZnO under UV light undergoes 57% degradation in 90 min (curve b). A decrease in dye concentration (20%) occurs when it is treated with dye/ZnP/dark (curve c). The dye/ZnP/UV light process shows 35% of degradation of BV 10 (curve d) at 90 min. The degradation of dye on irradiation with ZnP/ZnO catalyst of different weight percentage of Zn3(PO4)2 are shown in curves e,
f, g and h. Catalyst loaded with 5 wt% of ZnP shows a higher degradation (curve g, 94%). Hence, 5 wt% of ZnP is taken as optimum concentration of ZnP in ZnO.
Figure 11 Primary analysis of BV 10 under UV light. [BV 10] = 5 10-4 M,
catalyst suspended = 2 g L-1, airflow rate = 8.1 mL s-1, pH = 7.0, I0 = 1.381
10-6 einstein L-1 s-1.
Influence of Process Parameters
Effect of Catalyst Loading
The study on degradation rate with different amounts of catalyst is important to find out the minimum amount of catalyst required for maximum dye removal. Hence, it is required to optimize the dose of catalyst for the effective
mineralization of BV 10. The experiment was carried out by varying catalyst concentration from 1 to 5 g L-1 in aqueous BV 10 solution under UV-A light irradiation for 30 min. The increase of catalyst weight from 1 to 3 g L-1 the rate of degradation increases from 0.0393-0.0530 min-1 at the time of 30 min (Figure 12). Further increase of catalyst amount (above 3 g L-1) slight decreases the rate constant. The decrease in efficiency at higher amount (above 3 g L−1) is caused by the light reflectance of catalyst particles (Thennarasu and Sivasamy, 2015). The optimum amount of catalyst for efficient degradation of BV 10 is 3 g L-1.
Figure 12 Effect of catalyst loading. [BV 10] = 5 10-4 M, airflow rate = 8.1
mL s-1, pH = 7.0, irradiation time = 30 min. I0 = 1.381 10-6 einstein L-1 s-1.
Influence of Initial Solution pH
The solution pH plays a vital role in photocatalytic degradation. The effect of pH range from 3-9 and the results are shown in Figure 13. At pH 7, the maximum percentage of 94% degradation was observed (90 min). Above pH 7 the degradation efficiency decreases. At low pH the removal efficiency is less due to the dissolution of ZnO. Degradation efficiency of a catalyst depends on the adsorption of dye molecules. The percentages of adsorption at pH 3, 5, 7 and 9 were found to be 25, 17, 28 and 21 at equilibrium, respectively. Since the adsorption is maximum at pH 7, the degradation is high at this pH. At pH above 7, surface of catalyst is negatively charged and the electrostatic attraction between dye anion and negatively charged catalyst becomes weak resulting in decreased adsorption. This decreases the degradation at pH 9. Hence pH 7 is the optimum pH for the mineralization of BV 10 (Velmurugan and Swaminathan, 2011; Subash et al, 2013; Senthilraja et al, 2014).
Figure 13 Effect of initial solution pH. [BV 10] = 5 10-4 M, 5 wt% ZnP/ZnO
Under Uv-A Light
Effect of Initial Dye Concentration
As the dye concentration is an important parameter in wastewater treatment, the effect of initial dye concentration of BV 10 on the degradation was investigated over the concentration of 1 to 6 10-4 M. Increase the initial dye concentration from 1 to 6 10-4 M decreases the degradation rate constant from 0.0924 to 0.0140 min-1 (Figure 14). The catalyst amount and UV power remains in all experiments same. Since the generation of hydroxyl radical is constant, the probability of dye molecule to react with hydroxyl radical decreases. At high concentrations the entry of photon into the solution decreases (Velmurugan et al, 2013).
Figure 14 Effect of initial dye concentration. 5 wt% ZnP/ZnO = 3 g L-1,
airflow rate = 8.1 mL s-1, pH = 7.0, irradiation time = 30 min. I0 = 1.38110-6
einstein L-1 s-1.
Effect of Long-Term Stability
The recyclability results of catalyst are shown in Figure 15. To test reusability of 5 wt% ZnP/ZnO under identical reaction conditions, the catalyst was recovered and used for further runs. The results of 5 wt% ZnP/ZnO exhibit excellent photostability and almost 95% degradation was observed for all the five runs. There is no significant change in the degradation efficiency of 5 wt% ZnP/ZnO after fifth run. This makes the catalyst suitable for continuous treatment of wastewater.
Figure 15 Effect of long-term stability. [BV 10] = 5 10-4 M, 5 wt% ZnP/ZnO
= 3 g L-1, airflow rate = 8.1 mL s-1, pH = 7.0.
General Mechanism
The coupled semiconductor heterojunction can decrease the charge recombination rate (Maeda, 2013). The CB edges of ZnO and Zn3(PO4)2 are situated at -0.33 and +0.297,
respectively (Scheme 1) (Balachandran et al, 2014; Peiyan et al, 2015). The calculated band gap energy (Eg) of ZnO and
Zn3(PO4)2 according to the plot of [F(R)h]2 versus h are
3.20 and 3.07 eV, respectively. The conduction band edge of Zn3(PO4)2 is more positive than that of ZnO. Hence Zn3(PO4)2
can act as a sink for photo ejected electrons in the coupled system. On UV irradiation the photo excited electrons on ZnO undergo vectorial transfer to Zn3(PO4)2, whereas holes on
Zn3(PO4)2 migrate to ZnO, decreasing charge recombination.
This charge separation is also supported by the reduction of PL intensity of catalyst related to ZnO. This process not only facilities the charge separation but also accumulates electrons and holes in Zn3(PO4)2 and ZnO, respectively. The OH radical
is a powerful oxidant to degrade dyes (Wu et al, 2006). The photogenerated electrons could react with the oxygen molecule adsorbed on the surface ZnP/ZnO photocatalyst to yield O2-.
Photogenerated holes react with water molecules and hydroxyl ions to produce OH. Reactive OH and O2- radicals degrade
the dye. Therefore, ZnP/ZnO has higher catalytic activity than bare Zn3(PO4)2 and ZnO.
Scheme 1 Schematic representation of mechanism of dye degradation
CONCLUSION
The synthesized ZnP/ZnO nanocomposites effectively are used for BV 10 dye degradation under UV light. The optimized 5 wt% of ZnP/ZnO composite is characterized. Although XRD results fail to prove the ZnP in ZnP/ZnO composite, Raman spectroscopic results fulfill the requirements. HR-SEM results reveal that ZnP/ZnO exhibits a chain-like structure and ZnO particles are well dispersed on Zn3(PO4)2 plates as nanochains.
Moreover, ZnP/ZnO is more efficient than Zn3(PO4)2 and ZnO
for the degradation of BV 10 dye under UV irradiation. The optimum pH and catalyst loading are found to be 7 and 3 g L-1, respectively. Increasing initial dye concentration decreases the efficiency of degradation. Reusability of this catalyst will make the treatment of dye effluent more cost-effective. A degradation mechanism is proposed based on the energy levels of Zn3(PO4)2and ZnO. This catalyst is stable and reusable.
Acknowledgments
research grant No. The UGC sanctioned letter F.No-43-222/2014(SR). This work was supported by FCT/QREN-COMPETE through the project PTDC/AAC-CLI/118092/2010 and grant SFRH/BPD/86971/2012 (B. Krishnakumar).
References
Alim, K.A., Fonoberov, V.A., Shamsa, M and Balandin, A.A. 2005. Micro-Raman investigation of optical phonons in ZnO nanocrystals. J. Appl. Phys. 97, 124313.
Balachandran, S., Praveen, S.G., Velmurugan, R and Swaminathan, M. 2014. Facile fabrication of highly efficient, reusable heterostructured Ag-ZnO-CdO and its twin applications of dye degradation under natural sunlight and self-cleaning. RSC Adv. 4, 4353-4362. Bui, T.D., Kimura, A., Ikeda, S and Matsumura, M.
2010. Determination of oxygen sources for oxidation of benzene on TiO2 photocatalysts in aqueous solutions
containing molecular oxygen. J Am Chem Soc. 132, 8453-8458.
Chang, S.S., Clair, B., Ruelle, J., Beauchene, J., Renzo, F.D., Quignard, F., Zhao, G.J and Yamamoto, H. 2009. Mesoporosity as a new parameter for understanding tension stress generation in trees. J. Gril, J. Exp. Bot. 60, 3023-3030.
Chen, F., Cao, Y and Jia, D. 2013. A facile route for the synthesis of ZnS rods with excellent photocatalytic activity Chem. Eng. J. 234 (2013) 223-231.
Cho, S., Jang, J.W., Kim, J., Lee, J.S., Choi, W and Lee, K.H. 2011. Three-Dimensional Type II ZnO/ZnSe Heterostructures and Their Visible Light Photocatalytic Activities. Langmuir 27, 10243-10250.
Cid, L.C., Grande, M.C., Acosta, E.O and Ginzberg, B. 2012. Removal of Cr(VI) and Humic Acid by Heterogeneous Photocatalysis in a Laboratory Reactor and a Pilot Reacto Ind. Eng. Chem. Res. 51, 9468-9474. Danwittayakul, S., Jaisai, M., Koottatep, T and Dutta, T.
2013. Enhancement of Photocatalytic Degradation of Methyl Orange by Supported Zinc Oxide Nanorods/Zinc Stannate (ZnO/ZTO) on Porous Substrates Ind. Eng. Chem. Res. 52, 13629-13636.
Frontistis, Z., Drosou, C., Tyrovola, K., Mantzavinos, D., Fatta-Kassinos, D., Venieri, D and Xekoukoulotakis, N.P. 2012. Experimental and Modeling Studies of the Degradation of Estrogen Hormones in Aqueous TiO2 Suspensions under Simulated Solar Radiation Ind.
Eng. Chem. Res. 51, 16552-16563.
He, F., Li, J., Li, T and Li, G. 2014. Solvothermal synthesis of mesoporous TiO2: The effect of morphology, size and
calcination progress on photocatalytic activity in the degradation of gaseous benzen Chem. Eng. J. 237, 312-321.
He, Y.M., Cal, J., Li, T.T., Wu, Y.Y.Y.M., Luo, M.F and Zhao, L.H. 2012. Synthesis, Characterization, and Activity Evaluation of DyVO4/g-C3N4Composites under
Visible-Light IrradiationInd. Eng. Chem. Res. 51, 14729-14737.
Huang, Y.C., Chang, S.Y., Lin, C.F and Tseng, W.J. 2011. Synthesis of ZnO nanorod grafted TiO2nanotube 3-D array heterostructure as supporting platform for
nanoparticle deposition. J. Mater. Chem. 21(36), 14056-14061.
Jiang, J., Zhao, K., Xiao, X.Y and Zhang, L.Z. 2012. Synthesis and Facet-Dependent Photoreactivity of BiOCl Single-Crystalline Nanosheets. J.Am. Chem. Soc. 134, 4473-4476.
Jung, S and Yong, K. 2011. Fabrication of CuO-ZnO nanowires on a stainless steel mesh for highly efficient photocatalytic applications. Chem. Commun. 47, 2643-2645.
Krishnakumar, B., Imae, T., Miras, J and Esquena, J. 2014. Synthesis and azo dye photodegradation activity of ZrS2-ZnO nano-composites Sep. Purif. Technol. 132, 281-288.
Kuhn, H.J., Braslavsky, S.E and Schmidt, R. 2004. Organic And Biomolecular Chemistry Division Subcommittee On Photochemistry. Pure Appl. Chem. 76, 2105-2146. Liu, S., Li, C., Yu, Y and Xiang, Q. 2011. Improved
visible-light photocatalytic activity of porous carbon self-doped ZnO nanosheet-assembled flowers. Cryst. Eng. Comm. 13, 2533-2541.
Maeda, K. 2013. Z-Scheme Water Splitting Using Two Different Semiconductor Photocatalysts. ACS Catal. 3, 1486-1503.
Mapa, M and Gopinath, G.S. 2009. Combustion Synthesis of Triangular and Multifunctional ZnO1−xNx (x≤ 0.15)
MaterialsChem. Mater. 21, 351-359.
Mitra, S., Patra, P., Chandra, S., Pramanik, P and Goswami, A. 2012. Efficacy of highly water-dispersed fabricated nano ZnO against clinically isolated bacterial strains.
Appl. Nanosci. 2, 231-238.
Pawlig, O., Schellenschlager, V., Lutz, H.D and Trettin, R. 2001. Vibrational analysis of iron and zinc phosphate conversion coating constituents, Spectrochim. Acta, Part A. 57, 581-590.
Peiyan, M., Yong, Y., Hongjian, Y., Liyuan, C., Ling, W and Yan, X. 2015. Controlled synthesis of peony-shaped photocatalyst grains of Ag3PO4/Zn3(PO4)2 by
coprecipitation and recrystallization technology RSC Adv. 5, 47884-47891.
Radeka, M., Markov, S., Loncar, E., Rudic, O., Vucetic, S and Ranogajec, J. 2013. Photocatalytic effects of TiO2 mesoporous coating immobilized on clay roofing tiles J. Eur. Ceram. Soc. 34, 127-136.
Raji, J.R. and Palanivelu, K. 2011. Sunlight-Induced Photocatalytic Degradation of Organic Pollutants by Carbon-Modified Nanotitania with Vegetable Oil as PrecursorInd. Eng. Chem. Res. 50, 3130-3138.
Senthilraja, A., Subash, B., Krishnakumar, B., Rajamanickam, D., Swaminathan, M and Shanthi, M. 2014. Synthesis, characterization and catalytic activity of co-doped Ag-Au-ZnO for MB dye degradation under UV-A light. Mater. Sci. Semicond. Process. 22, 83-91. Subash, B., Krishnakumar, B., Swaminathan, M and Shanthi,
M. 2013. Highly Efficient, Solar Active, and Reusable Photocatalyst: Zr-Loaded Ag-ZnO for Reactive Red 120 Dye Degradation with Synergistic Effect and Dye-Sensitized Mechanism. Langmuir. 29, 939-949.
Thennarasu, G and Sivasamy, A. 2015. Synthesis and characterization of nanolayered ZnO/ZnCr2O4 metal
Under Uv-A Light
visible light irradiation. J. Chem. Technol. Biotechnol. 90, 514-524.
Usubharatana, P., McMartin, D., Veawab, A and Tontiwachwuthikul, P. 2006. Photocatalytic Process for CO2 Emission Reduction from Industrial Flue Gas
Streams. Ind. Eng. Chem. Res. 45, 2558-2568.
Velmurugan, K., Krishnakumar, B., Subash, B and Swaminathan, M. 2013. Preparation and characterization of carbon nanoparticles loaded TiO 2 and its catalytic activity driven by natural sunlightSol. Energy Mater. Sol. Cells 108, 205-212.
Velmurugan, R and Swaminathan, M. 2011. Sol. Energy Mater. An efficient nanostructured ZnO for dye sensitized degradation of Reactive Red 120 dye under solar light Sol. Cells 95, 942-950.
Wang, J and Gao, L. 2004. Hydrothermal synthesis and photoluminescence properties of ZnO nanowires. Solid
State Commun. 132, 269-271.
Wang, J.D., Li, D., Liu, J.K., Yang, X.H., He, J.L and Lu, Y. 2011. One-Step Preparation and Characterization of Zinc Phosphate Nanocrystals with Modified Surface.
Soft Nanoscience Letters, Vol. 1, 81-85.
Wang, X., Fan,H and Ren, P. 2013. Electrospinning derived hollow SnO2 microtubes with highly photocatalytic
property. J.Catal. Commun. 31, 37-41.
Wang, Y., Ren, P., Feng, C., Zheng, X.,Wang, Z and Li, D. 2014. Photocatalytic behavior and photo- corrosion of visible light active Silver carbonate / Titanium oxide.
Mater. Lett. 115, 85-88.
Wei, B.X., Zhao, L., Wang, T.J., Gao, H., Wu, H.J and Jin, Y. 2013. Photo-stability of TiO2 particles coated with
several transition metal oxides and its measurement by rhodamine-B degradation. Adv. Powder Technol. 24, 708-713.
Wu, L., Yu, J.C and Fu, X. 2006. Characterization and photocatalytic mechanism of nanosized CdS coupled TiO2 nanocrystals under visible light irradiation J. Mol. Catal. A 244, 25-32.
Xiang, Q.J., Yu, J.G and Jaroniec, M. 2012. Graphene-based semiconductor photocatalysts. Chem. Soc. Rev. 41, 782-796.
Yiamsawas, D., Boonpavanitchakul, K and Kangwansupamonkon, W. 2009. Preparation of ZnO nanostructures by solvothermal method. J Micros Soc Thailand. 23 (1), 75-78.
Yu, C., Cao, F., Li, G., Wei, R., Yu, J.C., Jin, R., Fan, Q and Wang, C. 2013. Novel noble metal (Rh, Pd, Pt)/BiOX(Cl, Br, I) composite photocatalysts with enhanced photocatalytic performance in dye degradation, Sep. Purif. Technol. 120, 110-122.
Yu, C., Fan, Q., Xie,Y., Chen, J., Shu,Q and Yu, J.C. 2012. Sonochemical fabrication of novel square-shaped F doped TiO2 nanocrystals with enhanced performance in
photocatalytic degradation of phenol J. Hazard. Mater. 237, 38-45.
Yu, C., Shu, Q., Zhang, C., Xie, Z and Fan, Q. 2012. A sonochemical route to fabricate the novel porous F, Ce-codoped TiO2 photocatalyst with efficient photocatalytic
performance J. Porous Mater. 19, 903-911.
Yu, C., Yang, K., Xie, Y., Fan, Q., Yu, J.C., Shu, Q and Wang, C. 2013. Novel hollow Pt-ZnO nanocomposite microspheres with hierarchical structure and enhanced photocatalytic activity and stability. Nanoscale. 5, 2142-2151.
Yu, C., Yu, J.C and Chan, M. 2009. Sonochemical fabrication of fluorinated mesoporous titanium dioxide microspheres. Journal of Solid State Chemistry. 182, 1061-1069.
Yu, C.L., Li, G., Kumar, S., Kawasaki, H and Jin, R.C. 2013. Stable Au25(SR)18/TiO2 Composite Nanostructure with
Enhanced Visible Light Photocatalytic Activity. J. Phys. Chem. Lett. 4, 2847-2852.
Yu, J., Xiang, Q and Zhou, M. 2009 Preparation, characterization and visible-light-driven photocatalytic activity of Fe-doped titania nanorods and first-principles study for electronic structures. Appl. Catalysis B:
Environmetal. 90 (3-4), 595-602.
Zhang, M., Liu, J.K., Miao, R., Li, G.M and Du, Y.J. 2010. Preparation and Characterization of Fluorescence Probe from Assembly Hydroxyapatite Nanocomposite.
Nanoscale Research Letters. 5, 675-679.
*******
How to cite this article:Rajasri, S et al.2017, Development of Zn3 (PO4)2/ ZnO-Coupled Semiconductor System For Effective Mineralization of Basic

![Figure 15 Effect of long-term stability. [BV 10] = 5 10-4 M, 5 wt% ZnP/ZnO = 3 g L-1, airflow rate = 8.1 mL s-1, pH = 7.0](https://thumb-us.123doks.com/thumbv2/123dok_us/108290.2012345/6.595.40.289.524.680/figure-effect-long-stability-znp-zno-airflow-rate.webp)