VOLUME NO. 6 (2016), ISSUE NO. 09 (SEPTEMBER) ISSN2231-5756
A Monthly Double-Blind Peer Reviewed (Refereed/Juried) Open Access International e-Journal - Included in the International Serial Directories Indexed & Listed at:
Ulrich's Periodicals Directory ©, ProQuest, U.S.A., EBSCO Publishing, U.S.A., Cabell’s Directories of Publishing Opportunities, U.S.A., Google Scholar, Open J-Gage, India [link of the same is duly available at Inflibnet of University Grants Commission (U.G.C.)],
Index Copernicus Publishers Panel, Poland with IC Value of 5.09 & number of libraries all around the world.
VOLUME NO. 6 (2016), ISSUE NO. 09 (SEPTEMBER)
ISSN
2231-5756
CONTENTS
Sr.
No.
TITLE & NAME OF THE AUTHOR (S)
Page
No.
1.
OPTIMIZING CAPITAL STRUCTURE THROUGH DEBT TO EQUITY BALANCING: A STUDY OF SELECTED
ZIMBABWE STOCK EXCHANGE LISTED COMPANIES
DR. B. NGWENYA
1
2.
MAIZE CULTIVATION IN KARNATAKA & GROWERS’ AWARENESS ON PRICE RISK MANAGEMENT TOOLS.
V. CHANDRA SEKHAR RAO & DR. G V KESAVA RAO
5
3.
A STUDY OF LEAD LAGS RELATIONSHIP BETWEEN NSE EQUITY MARKET AND SINGLE STOCK FUTURES
DR. SANDHYA SRIDEVI MARIPINI & SATYANARAYANA KOILADA
11
4.
MOBILE PHONE MESSAGING INTERVENTIONS MAY PROVIDE BENEFIT IN SUPPORTING THE
SELF-MANAGEMENT OF LONG-TERM ILLNESSES: AN ANALYSIS
SURENDRA NATH SHUKLA & DR. J K SHARMA
18
5.
LECTURERS’ PERCEPTION ON STUDENTS’ APPRAISAL OF COURSES AND TEACHING: A CASE OF UNIVERSITY
OF CAPE COAST, GHANA
EMMANUEL KOFI GYIMAH, ALBERT JUSTICE KWARTENG, ERIC ANANE & IVY KESEWAA NKRUMAH
21
6.
EDUCATION AS A MEANS OF WOMEN’S EMPOWERMENT: A STUDY ON THE PARENTS’ ATTITUDES
DEEPRAJ CHAKRABARTY, DEBOSMITA NATH & DR. D. GHOSE
27
7.
A STUDY ON OVERALL IMPACT OF TRAINING AND DEVELOPMENT ON JOB PERFORMANCE, MORALE OF
EMPLOYEES AND TO REDUCE THE EMPLOYEE RESISTANCE TO NEW TECHNOLOGY
DR. MAHESHA KEMPEGOWDA & PURUSHOTHAM.C.J
30
8.
MILLING STUDIES OF PULSES USING DIFFERENT PRE-MILLING TREATMENT OF PIGEON PEA (CAJANUS
CAJAN)
MEDHA VYAS & PRIYANKA BHADOURIYA
35
9.
A STUDY ON FINANCIAL DERIVATIVE OPTIONS WITH REFERENCE TO SELECTED SECTORS
BHAGYA LAKSHMI.K & DR. N. BABITHA THIMMAIAH
41
10.
AN ARTICLE ON PERFORMANCE APPRAISAL: A STUDY WITH REFERENCE TO KIRLOSKAR ELECTRIC CO. LTD.,
MYSORE
SOWMYA.H.L
48
11.
TECHNOLOGICAL INNOVATIONS IN INDIAN BANKING SECTOR: AN INSTRUMENT FOR ECONOMIC GROWTH
DR. PRAGYA PRASHANT GUPTA
50
12.
LITERACY AND LITERARY PROGRAMMES AND THEIR IMPLEMENTATION IN INDIA
HARISH R.
56
13.
THE DEVELOPMENT OF MANAGERIAL WOMEN OF BELOW POVERTY LINE SELF HELP GROUP IN DISTRICT
GONIDA IN MAHARASHTRA
KU.MRUNALI S. LILHARE
60
14.
PROBLEMS AND PROSPECTS OF KUDUMBASREE LINKED MICRO ENTERPRISES
VARGHESE JOY
62
15.
PROBLEMS AND PROSPECTS OF LEATHER INDUSTRY IN VELLORE DISTRICT
DR. AJAY KUMAR SHARMA
66
16.
CHANGING E-TAIL TRENDS IN INDIA
AMIT KISHORE SINHA & DR. GYANENDRA B. S. JOHRI
73
17.
A STUDY ON TWO WHEELER PURCHASING PATTERN OF COLLEGE STUDENTS IN KOTTARAKARA TALUK
ANCY SAM
79
18.
HUMAN INTERACTION WITH SMART MOBILE PHONE
DR. C. NIRMALA
84
19.
POLITICIZATION OF STUDENTS' UNIONS: A STUDY IN BHUBANESWAR, ODISHA
PRASANTA MOHAPATRA
87
20.
RELEVANCE OF UNORGANISED RETAILERS AND THEIR PROBLEMS WITH SPECIAL EMPHASIS TO CALICUT
CITY
SHAHIBA.EC
93
VOLUME NO. 6 (2016), ISSUE NO. 09 (SEPTEMBER)
ISSN
2231-5756
CHIEF PATRON
PROF. K. K. AGGARWAL
Chairman, Malaviya National Institute of Technology, Jaipur
(An institute of National Importance & fully funded by Ministry of Human Resource Development, Government of India)
Chancellor, K. R. Mangalam University, Gurgaon
Chancellor, Lingaya’s University, Faridabad
Founder Vice-Chancellor (1998-2008), Guru Gobind Singh Indraprastha University, Delhi
Ex. Pro Vice-Chancellor, Guru Jambheshwar University, Hisar
FOUNDER PATRON
LATE SH. RAM BHAJAN AGGARWAL
Former State Minister for Home & Tourism, Government of Haryana
Former Vice-President, Dadri Education Society, Charkhi Dadri
Former President, Chinar Syntex Ltd. (Textile Mills), Bhiwani
FORMER CO-ORDINATOR
DR. S. GARG
Faculty, Shree Ram Institute of Business & Management, Urjani
ADVISORS
PROF. M. S. SENAM RAJU
Director A. C. D., School of Management Studies, I.G.N.O.U., New Delhi
PROF. M. N. SHARMA
Chairman, M.B.A., Haryana College of Technology & Management, Kaithal
PROF. S. L. MAHANDRU
Principal (Retd.), Maharaja Agrasen College, Jagadhri
EDITOR
PROF. R. K. SHARMA
Professor, Bharti Vidyapeeth University Institute of Management & Research, New Delhi
CO-EDITOR
DR. BHAVET
Faculty, Shree Ram Institute of Engineering & Technology, Urjani
EDITORIAL ADVISORY BOARD
DR. RAJESH MODI
Faculty, Yanbu Industrial College, Kingdom of Saudi Arabia
PROF. SANJIV MITTAL
University School of Management Studies, Guru Gobind Singh I. P. University, Delhi
PROF. ANIL K. SAINI
Chairperson (CRC), Guru Gobind Singh I. P. University, Delhi
DR. SAMBHAVNA
VOLUME NO. 6 (2016), ISSUE NO. 09 (SEPTEMBER)
ISSN
2231-5756
DR. MOHENDER KUMAR GUPTA
Associate Professor, P. J. L. N. Government College, Faridabad
DR. SHIVAKUMAR DEENE
Asst. Professor, Dept. of Commerce, School of Business Studies, Central University of Karnataka, Gulbarga
ASSOCIATE EDITORS
PROF. NAWAB ALI KHAN
Department of Commerce, Aligarh Muslim University, Aligarh, U.P.
PROF. ABHAY BANSAL
Head, Department of I.T., Amity School of Engineering & Technology, Amity University, Noida
PROF. A. SURYANARAYANA
Department of Business Management, Osmania University, Hyderabad
PROF. V. SELVAM
SSL, VIT University, Vellore
DR. PARDEEP AHLAWAT
Associate Professor, Institute of Management Studies & Research, Maharshi Dayanand University, Rohtak
DR. S. TABASSUM SULTANA
Associate Professor, Department of Business Management, Matrusri Institute of P.G. Studies, Hyderabad
SURJEET SINGH
Asst. Professor, Department of Computer Science, G. M. N. (P.G.) College, Ambala Cantt.
FORMER TECHNICAL ADVISOR
AMITA
Faculty, Government M. S., Mohali
FINANCIAL ADVISORS
DICKIN GOYAL
Advocate & Tax Adviser, Panchkula
NEENA
Investment Consultant, Chambaghat, Solan, Himachal Pradesh
LEGAL ADVISORS
JITENDER S. CHAHAL
Advocate, Punjab & Haryana High Court, Chandigarh U.T.
CHANDER BHUSHAN SHARMA
Advocate & Consultant, District Courts, Yamunanagar at Jagadhri
VOLUME NO. 6 (2016), ISSUE NO. 09 (SEPTEMBER)
ISSN
2231-5756
CALL FOR MANUSCRIPTS
We invite unpublished novel, original, empirical and high quality research work pertaining to the recent developments & practices in the areas of Com-puter Science & Applications; Commerce; Business; Finance; Marketing; Human Resource Management; General Management; Banking; Economics; Tourism Administration & Management; Education; Law; Library & Information Science; Defence & Strategic Studies; Electronic Science; Corporate Gov-ernance; Industrial Relations; and emerging paradigms in allied subjects like Accounting; Accounting Information Systems; Accounting Theory & Practice; Auditing; Behavioral Accounting; Behavioral Economics; Corporate Finance; Cost Accounting; Econometrics; Economic Development; Economic History; Financial Institutions & Markets; Financial Services; Fiscal Policy; Government & Non Profit Accounting; Industrial Organization; International Economics & Trade; International Finance; Macro Economics; Micro Economics; Rural Economics; Co-operation; Demography: Development Planning; Development Studies; Applied Economics; Development Economics; Business Economics; Monetary Policy; Public Policy Economics; Real Estate; Regional Economics; Political Science; Continuing Education; Labour Welfare; Philosophy; Psychology; Sociology; Tax Accounting; Advertising & Promotion Management; Management Information Systems (MIS); Business Law; Public Responsibility & Ethics; Communication; Direct Marketing; E-Commerce; Global Business; Health Care Administration; Labour Relations & Human Resource Management; Marketing Research; Marketing Theory & Applications; Non-Profit Or-ganizations; Office Administration/Management; Operations Research/Statistics; Organizational Behavior & Theory; Organizational Development; Pro-duction/Operations; International Relations; Human Rights & Duties; Public Administration; Population Studies; Purchasing/Materials Management; Re-tailing; Sales/Selling; Services; Small Business Entrepreneurship; Strategic Management Policy; Technology/Innovation; Tourism & Hospitality; Transpor-tation Distribution; Algorithms; Artificial Intelligence; Compilers & Translation; Computer Aided Design (CAD); Computer Aided Manufacturing; Computer Graphics; Computer Organization & Architecture; Database Structures & Systems; Discrete Structures; Internet; Management Information Systems; Mod-eling & Simulation; Neural Systems/Neural Networks; Numerical Analysis/Scientific Computing; Object Oriented Programming; Operating Systems; Pro-gramming Languages; Robotics; Symbolic & Formal Logic; Web Design and emerging paradigms in allied subjects.
Anybody can submit the soft copy of unpublished novel; original; empirical and high quality research work/manuscript anytime in M.S. Word format after preparing the same as per our GUIDELINES FOR SUBMISSION; at our email address i.e. [email protected] or online by clicking the link online
submission as given on our website (FOR ONLINE SUBMISSION, CLICK HERE).
GUIDELINES FOR SUBMISSION OF MANUSCRIPT
1. COVERING LETTER FOR SUBMISSION:
DATED: _____________
THE EDITOR
IJRCM
Subject: SUBMISSION OF MANUSCRIPT IN THE AREA OF .
(e.g. Finance/Mkt./HRM/General Mgt./Engineering/Economics/Computer/IT/ Education/Psychology/Law/Math/other, please specify)
DEAR SIR/MADAM
Please find my submission of manuscript titled ‘___________________________________________’ for likely publication in one of your journals.
I hereby affirm that the contents of this manuscript are original. Furthermore, it has neither been published anywhere in any language fully or partly, nor it is under review for publication elsewhere.
I affirm that all the co-authors of this manuscript have seen the submitted version of the manuscript and have agreed to inclusion of their names as co-authors.
Also, if my/our manuscript is accepted, I agree to comply with the formalities as given on the website of the journal. The Journal has discretion to publish our contribution in any of its journals.
NAME OF CORRESPONDING AUTHOR : Designation/Post* : Institution/College/University with full address & Pin Code : Residential address with Pin Code : Mobile Number (s) with country ISD code : Is WhatsApp or Viber active on your above noted Mobile Number (Yes/No) : Landline Number (s) with country ISD code : E-mail Address : Alternate E-mail Address : Nationality :
VOLUME NO. 6 (2016), ISSUE NO. 09 (SEPTEMBER)
ISSN
2231-5756
NOTES:
a) The whole manuscript has to be in ONE MS WORD FILE only, which will start from the covering letter, inside the manuscript. pdf.
version is liable to be rejected without any consideration.
b) The sender is required to mention the following in the SUBJECT COLUMN of the mail:
New Manuscript for Review in the area of (e.g. Finance/Marketing/HRM/General Mgt./Engineering/Economics/Computer/IT/
Education/Psychology/Law/Math/other, please specify)
c) There is no need to give any text in the body of the mail, except the cases where the author wishes to give any specific message w.r.t. to the manuscript.
d) The total size of the file containing the manuscript is expected to be below 1000 KB.
e) Only the Abstract will not be considered for review and the author is required to submit the complete manuscript in the first instance.
f) The journal gives acknowledgement w.r.t. the receipt of every email within twenty-four hours and in case of non-receipt of
acknowledgment from the journal, w.r.t. the submission of the manuscript, within two days of its submission, the corresponding author is required to demand for the same by sending a separate mail to the journal.
g) The author (s) name or details should not appear anywhere on the body of the manuscript, except on the covering letter and the cover page of the manuscript, in the manner as mentioned in the guidelines.
2. MANUSCRIPT TITLE: The title of the paper should be typed in bold letters, centeredand fully capitalised.
3. AUTHOR NAME (S) & AFFILIATIONS: Author (s) name, designation, affiliation (s), address, mobile/landline number (s), and email/al-ternate email address should be given underneath the title.
4. ACKNOWLEDGMENTS: Acknowledgements can be given to reviewers, guides, funding institutions, etc., if any.
5. ABSTRACT: Abstract should be in fully Italic printing, ranging between 150 to 300 words. The abstract must be informative and
eluci-dating the background, aims, methods, results & conclusion in a SINGLE PARA. Abbreviations must be mentioned in full.
6. KEYWORDS: Abstract must be followed by a list of keywords, subject to the maximum of five. These should be arranged in alphabetic
order separated by commas and full stop at the end. All words of the keywords, including the first one should be in small letters, except special words e.g. name of the Countries, abbreviations etc.
7. JEL CODE: Provide the appropriate Journal of Economic Literature Classification System code (s). JEL codes are available at
www.aea-web.org/econlit/jelCodes.php. However, mentioning of JEL Code is not mandatory.
8. MANUSCRIPT: Manuscript must be in BRITISH ENGLISH prepared on a standard A4 size PORTRAIT SETTING PAPER. It should be free
from any errors i.e. grammatical, spelling or punctuation. It must be thoroughly edited at your end.
9. HEADINGS: All the headings must be bold-faced, aligned left and fully capitalised. Leave a blank line before each heading.
10. SUB-HEADINGS: All the sub-headings must be bold-faced, aligned left and fully capitalised.
11. MAIN TEXT:
THE MAIN TEXT SHOULD FOLLOW THE FOLLOWING SEQUENCE:
INTRODUCTION REVIEW OF LITERATURE
NEED/IMPORTANCE OF THE STUDY STATEMENT OF THE PROBLEM OBJECTIVES
HYPOTHESIS (ES)
RESEARCH METHODOLOGY RESULTS & DISCUSSION FINDINGS
RECOMMENDATIONS/SUGGESTIONS CONCLUSIONS
LIMITATIONS
SCOPE FOR FURTHER RESEARCH REFERENCES
APPENDIX/ANNEXURE
VOLUME NO. 6 (2016), ISSUE NO. 09 (SEPTEMBER)
ISSN
2231-5756
12. FIGURES & TABLES: These should be simple, crystal CLEAR, centered, separately numbered & self-explained, and the titles must be above the table/figure. Sources of data should be mentioned below the table/figure. It should be ensured that the tables/figures are
referred to from the main text.
13. EQUATIONS/FORMULAE: These should be consecutively numbered in parenthesis, left aligned with equation/formulae number placed
at the right. The equation editor provided with standard versions of Microsoft Word may be utilised. If any other equation editor is utilised, author must confirm that these equations may be viewed and edited in versions of Microsoft Office that does not have the editor.
14. ACRONYMS: These should not be used in the abstract. The use of acronyms is elsewhere is acceptable. Acronyms should be defined
on its first use in each section e.g. Reserve Bank of India (RBI). Acronyms should be redefined on first use in subsequent sections. 15. REFERENCES: The list of all references should be alphabetically arranged. The author (s) should mention only the actually utilised
references in the preparation of manuscript and they may follow Harvard Style of Referencing. Also check to ensure that everything
that you are including in the reference section is duly cited in the paper. The author (s) are supposed to follow the references as per
the following:
All works cited in the text (including sources for tables and figures) should be listed alphabetically. Use (ed.) for one editor, and (ed.s) for multiple editors.
When listing two or more works by one author, use --- (20xx), such as after Kohl (1997), use --- (2001), etc., in chronologically ascending order.
Indicate (opening and closing) page numbers for articles in journals and for chapters in books.
The title of books and journals should be in italic printing. Double quotation marks are used for titles of journal articles, book chapters, dissertations, reports, working papers, unpublished material, etc.
For titles in a language other than English, provide an English translation in parenthesis.
Headers, footers, endnotes and footnotes should not be used in the document. However, you can mention short notes to elucidate
some specific point, which may be placed in number orders before the references.
PLEASE USE THE FOLLOWING FOR STYLE AND PUNCTUATION IN REFERENCES: BOOKS
Bowersox, Donald J., Closs, David J., (1996), "Logistical Management." Tata McGraw, Hill, New Delhi. Hunker, H.L. and A.J. Wright (1963), "Factors of Industrial Location in Ohio" Ohio State University, Nigeria.
CONTRIBUTIONS TO BOOKS
Sharma T., Kwatra, G. (2008) Effectiveness of Social Advertising: A Study of Selected Campaigns, Corporate Social Responsibility, Edited by David Crowther & Nicholas Capaldi, Ashgate Research Companion to Corporate Social Responsibility, Chapter 15, pp 287-303.
JOURNAL AND OTHER ARTICLES
Schemenner, R.W., Huber, J.C. and Cook, R.L. (1987), "Geographic Differences and the Location of New Manufacturing Facilities," Jour-nal of Urban Economics, Vol. 21, No. 1, pp. 83-104.
CONFERENCE PAPERS
Garg, Sambhav (2011): "Business Ethics" Paper presented at the Annual International Conference for the All India Management Asso-ciation, New Delhi, India, 19–23
UNPUBLISHED DISSERTATIONS
Kumar S. (2011): "Customer Value: A Comparative Study of Rural and Urban Customers," Thesis, Kurukshetra University, Kurukshetra.
ONLINE RESOURCES
Always indicate the date that the source was accessed, as online resources are frequently updated or removed.
WEBSITES
VOLUME NO. 6 (2016), ISSUE NO. 09 (SEPTEMBER)
ISSN
2231-5756
OPTIMIZING CAPITAL STRUCTURE THROUGH DEBT TO EQUITY BALANCING: A STUDY OF SELECTED
ZIMBABWE STOCK EXCHANGE LISTED COMPANIES
DR. B. NGWENYA
DEAN
FACULTY OF BUSINESS
SOLUSI UNIVERSITY
ZIMBABWE
ABSTRACT
The firm’s capital structure as denoted by the debt to equity ratio or the financial debt to equity ratio is dependent on the weighted average cost of capital according to the traditional theory of capital structure. This study was conducted to investigate empirically, the determinants of capital structure for Zimbabwe Stock Exchange listed companies. The study also sought to establish if listed companies in the Zimbabwe Stock Exchange maintain a target debt to equity ratio as a measure of capital structure optimization. Data was collected through a questionnaire and also through the analysis of the financial statements of the selected listed compa-nies. The findings from the survey confirmed that the cost of capital is a determinant of capital structure as denoted by debt to equity ratio. That is, capital structure depends on the weighted average cost of capital (WACC). The high WACC is associated with high debt to equity ratios and the cost of capital is a predominant consideration for making capital structure decisions in the Zimbabwe Stock Exchange listed companies. In addition, the analysis of the financial statements of the selected Zimbabwean listed companies revealed the evidence that companies with debt generally perform better than the all equity financed companies, the earnings per share (EPS) and Share Prices are generally higher. The majority of managers in the Zimbabwe Stock Exchange listed companies maintains a target debt to equity ratio and rebalances their capital structure to move towards their target whilst very few of managers have a no target policy at all. Few managers maintain a strict target and most managers maintain a target range and a considerable number of managers consider a flexible target as important.
KEYWORDS
WACC, debt to equity ratio, capital structure, EPS, Share Price, risk, wealth maximization, ZSE.
INTRODUCTION
apital structure optimization decisions taken by agents (managers) on behalf of the principals (shareholders) as reflected by each company’s debt to equity ratio are a critical strategy reflection towards shareholder value growth or wealth maximization realization. Financial management literature suggest that managers strive to satisfy shareholders by focusing on those actions that will result in the maximization of the wealth of the shareholders by growing the value of the companies they are managing on behalf of those shareholders. As a result, there is generally a relationship between shareholder value growth and the business strategies employed by management.
The growth and development of a company depend crucially on that company’s access to sources of financial capital. Zimbabwe’s capital markets revolve around the Zimbabwe Stock Exchange (ZSE), with a market capitalization of about USD 6.371 billion. The Zimbabwe Stock Exchange (ZSE) was established in 1896, initially to provide a forum through which mining companies could raise equity financing to fund operations. Although the ZSE was originally established to cater for the mining industry, today, the majority of listed companies are non-mining. The exchange was regulated by the Zimbabwe Stock Exchange Act 1974, 1996 (Chapter 24:18) but was replaced by the Securities Act in 2008. The first stock exchange was established in Bulawayo in 1896. The exchange in Harare started operating in 1951.
NEED FOR THE STUDY
Having in mind all the limitations of financing faced by Zimbabwean firms, it is the duty of financial managers to establish an adequate finance policy, taking the predominant theoretical knowledge in consideration, and search for the sources that fit best the financial needs of the company and the concern of stockholders to have their wealth maximized. Research has been executed to identify the determinants of capital structure, nonetheless, the concerns of most capital structure studies are in developed countries and there are few studies that offer evidence from developing countries such as Zimbabwe. The capital market conditions, the legal frame work, the caliber of management and the general industry practices are bound to influence the determination of capital structure choice in a significant way for Zimbabwean firms. Initial Public Offers and other new equity issues on the Zimbabwe Stock Exchange have been limited ever since the introduction of the multi-currency regime in 2009 owing to the liquidity state of the economy. The different sources of finance all have different financial risks; the financial risks have to be combined with the business risk which determines the cost of capital. The differences of capital combinations and their risk components, cost components all lead to the optimal capital structure which minimizes the cost and risk of capital used to finance the corporate firm. One factor of great influence is availability of funds in the capital markets, the Zimbabwe’s industry is still undercapitalized characterised by a lack of finance for long term projects and new machinery.
STATEMENT OF THE PROBLEM
The Zimbabwean economy has been characterised by an undercapitalised industry and high borrowing costs ever since the adoption of the multi-currency regime. There are companies in Zimbabwe with too much debt and the general default rate of business loans is significant while the cost of capital is relatively high, lowering the value of the companies in the process. These conditions in a developing economy are different to the emerging economies and the developed economies in factors such as sources of capital and their cost, in particular the overall cost of capital. Some other analysis of Zimbabwean companies’ capital structure has applied Western capital structure theories without closely examining the relevance or irrelevance of these theories when applied to the Zimbabwean institutional context. Therefore, this study sought to investigate the optimizing capital structure strategies employed by listed companies in the Zimbabwe Stock Exchange, from a developing economy context.
OBJECTIVES OF THE STUDY
1. To investigate empirically, the determinants of capital structure for Zimbabwe Stock Exchange listed companies, on the basis of the theoretical framework, particularly the impact of cost of capital (WACC) on debt to equity ratios.
2. To analyse and investigate the importance of capital structure in adding value to the wealth of shareholders.
3. To establish if listed companies in the Zimbabwe Stock Exchange maintain a target debt to equity ratio as a measure of capital structure optimization.
METHODOLOGY
Primary data was collected using a questionnaire which evaluated the opinions of 30 top managers of the 10 selected listed companies, and 10 company secretaries over a set of factors that are likely to influence their decision making on the capital structure policies. Secondary data was also collected from the published financial statements of these selected listed companies.
VOLUME NO. 6 (2016), ISSUE NO. 09 (SEPTEMBER)
ISSN
2231-5756
LITERATURE REVIEW
The Traditional Theory of Optimal Capital Structure: There are many methods for the firm to raise its required funds. But the most basic and important
instru-ments are equity or debt. The firm's mix of different securities is known as its capital structure. The capital structure can be discussed under the traditional or modern theory. Traditional theory assumes that an optimal capital structure does exist and depends on the level of gearing. The company cannot maximize wealth unless the optimal weighted average cost of capital (WACC) is achieved. Because debt has a lower after tax cost than equity, as it is moderately increased, the WACC falls. The moderate increase in debt does not increase the overall risk of the firm and therefore the firm does not have to offer a higher return to share-holders to compensate for the increased risk, as debt capital is further increased, the WACC will continue to fall up to a certain point. After thus optimal level is reached, any further increase in debt capital will increase the risk of the firm and shareholders will demand a higher yield. Shen (2008) states that the choice of capital structure of a firm could be influenced by the relative costs of debt and equity, and therefore the value of a firm could be affected by the net balance of relative costs of debt and equity in the chosen structure of capital. The impact of capital structure on the value of a firm depends on a net balance between the benefit of debt financing (cost reduction) and the increased cost of equity (risk reduction).
The result of the hypothetical analysis is that there may be an optimal capital structure where the value of a firm can be maximized, or the cost of capital minimized by adjusting the ratios of debt to equity. Atrill (2009) suggests that according to the traditional theory, capital structure decision making is very important. The traditional theory points out that the cost of loan capital (debt) is cheaper than the cost of ordinary shares (equity) and increasing levels of borrowing will decrease the overall cost of capital of the business. Cohen (2005) adds that the traditional view or theory at its simplest, proposes that a firm’s leverage (as measured by its debt/equity ratio) is significant in determining its cost of capital, and in consequence will affect the value of the firm. Thus, if we begin with a firm entirely financed by equity, as it acquires increasingly more debt it will find its cost of capital diminish up to a point, after which it will increase. This means that there will be a debt/equity ratio which gives the lowest WACC, at which point the value of the firm will be maximized for a given stream of cash flows. The rationale for this U-shaped WACC curve is quite straightforward: because the cost of debt is typically lower than the cost of equity, increasing leverage will initially act to lower the weighted average cost of capital. However, further increases in debt will raise the cost of capital due to increasing risk: both (potential) external providers of funds and current shareholders will seek for higher return on their funds to compensate them for the increased risk of additional debt.
Cost of Capital Approach: Cost of capital is critical to the long-term success of the firm and maintenance of the market value for its stock. This is the rate of return
a given project must earn. Because a firm tries to maintain a target capital structure, which is the desired optimal mix of debt and equity financing, it should use the weighted average cost to decide on investments. This section specifically focuses on the long-term fixed-asset investments, because they are more permanent. There are four basic sources of long-term funds that businesses use: long-term debt, preferred stock, common stock, and retained earnings. It is predominantly the cost of capital that influences capital structure. Damodaran (2001) asserts that by altering the weights of the different components of capital firms might be able to change their overall cost of capital, that is, either through increasing debt or equity. The cost of capital approach therefore suggests the estimation of the costs of capital and looking for the mix of debt and equity that yields the lowest cost of capital for the firm. At this cost of capital, Damodaran (2001) argues that the value of the firm is maximized. The cost of capital consists of the cost of debt and cost of equity. Lewellen (2006) asserts that the cost differential between internal and external equity suggests that profitable firms with internal cash should have less leverage than firms that use external finance (holding all else con-stant).
If firms lever up until the costs of financial distress outweigh the tax advantages of debt, firms with more internal equity will choose lower leverage: a dollar of debt substituted for retained earnings yields fewer tax savings than a dollar of debt substituted for external equity. According to Cohen (2005) the specific cost of each source of capital is the after-tax cost of getting financing today. The author goes on to emphasize that the cost of each source of capital reflects the risk of the assets the firm invests in. A firm that invests in assets having little risk in producing income will be able to bear lower costs of capital than a firm that invests in assets having a higher risk of producing income. Moreover, the cost of each source of funds reflects the hierarchy of the risk associated with its seniority over the other sources. For a given firm, the cost of funds raised through debt is less than the cost of funds from preferred stock which, in turn, is less than the cost of funds from common stock. Cost of debt: Kretlow (2001) defines cost of debt as the rate of return required by the firms’ creditors. For a debt issue or loan capital this rate of return often denoted by (Kd) and is equated to the interest. Van Horne (2002) refers to explicit cost of debt which is interest on debt as a factor to consider in capital structure. Therefore, companies consider the interest rate on bank loan, debenture interests, and dividends on preferred stock before issuing debt.
Cost of Debt: According to Cohen (2005) at its simplest, the cost of debt is the cost incurred by the firm when it acquires funds through borrowing. Brealey
and Meyers (2001) state that there are actually two costs of debt finance. The explicit cost of debt is the rate of interest that bondholders demand. But there is also an implicit cost, because borrowing increases the required return to equity.
Cost of Preferred Stock: Cohen (2005) known as preferred stock in the United States, preference shares are valued in much the same way as debt. The major
differences between preference shares and debt in the UK are: debt is subject to a tax-shield effect, as it is effectively tax deductible; dividends on preference shares are not tax deductible, the interest payments on debt are a legal obligation to be met by the company, whereas dividends on preference shares are paid at the discretion of the Board of Directors. In reality, the dividend on UK preference shares is often at a fixed rate, but because dividends are paid out of profits (as with ordinary shares) payment is dependent on company profitability.
Cost of equity or Common Stock: Kretlow (2001) cost of equity capital to the firm is the equilibrium rate of return required by the firm’s stock investors.
Equity can be raised internally through retained earnings or externally through sell of new common stock. Cost of equity can be estimated using the dividend valuation model approach.
SCOPE OF THE STUDY
The scope of the study is limited to 10 selected Zimbabwe Stock Exchange listed companies. These companies were randomly selected.
ANALYSIS OF THE STUDY
TABLE 1: SECONDARY DATA FROM PUBLISHED FINANCIAL STATEMENTS Company Debt Equity Debt/Equity Ratio Basic EPS
CAPS Holdings 25 674 712 61 159 390 41.98% --0.63 Delta 22 811 000 211 617 000 10.78% 4.50 Hwange 23 808 559 58 795 919 40.49% 7.03 AICO 33 467 000 116 552 000 28.71% 1.68 CBZ 48 513 752 99 256 929 48.88% 5.18 Cairns group 2 618 849 9 199 779 28.47% 0.01 Seedco 12 554 695 70 014 675 17.93% 9.05 Zimplow 600 550 11 286 811 5.32% 0.19 Interfresh 3 738 719 12 384 489 30.19% 0.008 Zimre 797 882 39 248 983 2.03% 0.26 ZPI 1 248 813 72 198 838 1.73% 0.16
VOLUME NO. 6 (2016), ISSUE NO. 09 (SEPTEMBER)
ISSN
2231-5756
respectively and performed extremely well compared to CAPS the reason for this performance is the industry differences and characteristics between the phar-maceutical industry, the mining industry and the banking industry. The evidence agrees with Gitman (2005) who states that the level of debt, that is, (financial leverage) that is acceptable for one industry or line of business can be highly risky in another because different industries and lines of business have different operating characteristics. A debt/equity ratio of 41.98% for CAPS is on the high side but for CBZ 48.88% and Hwange’s 40.49% seem to be in the optimal range side.
TABLE 2: WACC CALCULATED AT BOOK VALUES
Company EPS Share Price Ke % Kd % Equity Debt Weight of Equity Weight of Debt WACC %
Delta 4.5 74.92 6.00 11.00 211,617,000.00 22,811,000.00 5.42 2.140708 7.56 Hwange 0.32 45 0.07 10.00 58,795,919.00 23,808,559.00 0.05 6.340919 6.39 AICO 1.68 20 8.00 12.00 116,552,000.00 33,467,000.00 6.22 4.907872 11.12 CBZ 2.18 12 18.00 11.00 99,256,929.00 48,513,752.00 12.09 7.222695 19.31 Cairns group 0.01 1.2 1.00 11.00 9,199,779.00 2,618,849.00 0.78 4.874904 5.65 Seedco 9.05 110 8.00 10.00 70,014,675.00 12,554,695.00 6.78 3.345106 10.13 Zimplow 0.19 7 3.00 10.00 11,286,811.00 600,550.00 2.85 1.111441 3.96 Interfresh 0.01 0.48 2.00 12.00 12,384,489.00 3,738,719.00 1.54 5.101455 6.64 Zimre 0.16 1.3 12.00 12.00 72,198,838.00 1,248,813.00 11.80 0.374061 12.17 ZPI 0.26 1.45 18.00 11.00 39,248,983.00 797,882.00 17.64 0.438322 18.08
The findings from the book value WACC show that the cost of capital figures are relatively lower compared to in the table3 below, which was based on survey results. The reason for this could be the historical nature of book values, the shortcomings of the earnings method used which ignores risk and economic variables.
TABLE 3: WACC DERIVED FROM SURVEY DATA
Company Cost of Equity Cost of Debt Weight of Equity Weight of Debt WACC Debt/Equity Ratio
Delta 0.13 0.16 0.714285714 0.285714286 0.138571 0.40 Hwange 0.25 0.35 0.833333333 0.166666667 0.266667 0.20 AICO 0.42 0.38 0.724637681 0.275362319 0.408986 0.38 CBZ 0.12 0.24 0.833333333 0.166666667 0.140000 0.20 Cairns group 0.37 0.31 0.700000000 0.300000000 0.580000 0.43 Seedco 0.39 0.20 0.900900901 0.099099099 0.019820 0.11 Zimplow 0.25 0.26 0.943396226 0.056603774 0.250566 0.06 Interfresh 0. 15 0.10 0.869565217 0.130434783 0.013043 0.15 Zimre 0. 26 0.13 0.943260000 0.056740000 0.252623 0.06 ZPI 0. 17 0.12 0.878763000 0.121237000 0.163938 0.14
The weight of debt was deduced as follows, if debt/equity ratio is 40% then weight of debt is 40/(100+40)= 0.2857 and weight of equity is 100/(100+40)=0.7143. The results of the survey showed that debt/equity ratios range from 6% to 43%. The results show shat debt does not exceed equity in magnitude mainly because of risk, highly geared firms are more risky compared to all equity financed firms or lowly geared firms. Debt is cheaper than equity but this does not ensure that a company can be all debt financed as this increases bankruptcy costs and potential for financial distress.
TABLE 4: DESCRIPTIVE STATISTICS Mean Std. Deviation N
WACC .2272 .19418 10 Capital Structure .2411 .14210 10
The mean for Zimbabwean listed companies surveyed in the study for WACC is 0.2272 with a standard deviation of 0.19418 implying that capital structure should be 0.2272+/- 0.19418 that is ranging between 0.03302--0.42138 which agrees with observations from published financial statements, whilst the capital structure (debt/equity ratio) has a mean of 0.2411 and a standard deviation of 0.14210, implying that debt/equity should be 0.2411+/- 0.14210, that is ranging between 0.09900--0.3832.
TABLE 5: CORRELATIONS
WACC Capital Structure WACC Pearson Correlation 1 .630*
Sig. (1-tailed) .047 N 10 10 Capital Structure Pearson Correlation .630* 1
Sig. (1-tailed) .047 N 10 10 *. Correlation is significant at the 0.05 level (1-tailed).
VOLUME NO. 6 (2016), ISSUE NO. 09 (SEPTEMBER)
ISSN
2231-5756
FIGURE 1: REGRESSION ANALYSIS GRAPH
In the figure 1 above the observed and cumulated probabilities of WACC and capital structure (debt/equity) depended variable shows that the relationship is a linear, high WACC is associated with high debt/equity ratio, the capital structure. The WACC is the independent variable and the debt/equity (capital structure) is the dependent variable, given the WACC the debt/equity ratio (capital structure) can be predicted. Therefore, the financial manager has to determine the target WACC and ascertain the proportion of debt and the proportion of equity required.
FINDINGS AND SUGGESTIONS
The above findings suggest that the determinants of capital structure of the Zimbabwe listed companies are mainly the cost of capital, the weighted average cost of capital (WACC) is used in target capital structure policy setting and analysis should start from the book value WACC, whereas the weighted average cost of capital formula calls for market values when setting target capital structure.
Suggestion 1: Capital structure as denoted by the debt/equity ratio or the financial debt to equity ratio (FD/CP ratio) is dependent on the WACC. The evidence
from the survey confirms that the cost of capital is a determinant of capital structure (debt/equity). Capital structure (debt/equity ratio) depends on the WACC. The high WACC is associated with high debt/equity ratios and the cost of capital is a predominant consideration for making capital structure decisions in the Zimbabwe Stock Exchange listed companies.
Suggestion 2: The capital structure decision is very important. In general, the analysis of the financial statements of the selected Zimbabwean listed companies
revealed the evidence that companies with debt generally perform better than the all equity financed companies, the earnings per share (EPS) and Share Prices are generally higher.
Suggestion 3: The majority of managers in the Zimbabwe Stock Exchange listed companies maintain a target debt to equity ratio and rebalance their capital
structure to move towards their target whilst very few of managers have a no target policy at all. Few managers maintain a strict target and most managers maintain a target range and a considerable number of managers consider a flexible target as important.
REFERENCES
1. Aswath Damodaran 2001 Corporate Finance Theory&Practice 2nd Edition, John Wiley&Son Inc
2. Gensheng Shen 2008 The Determinants of Capital Structure in Chinese Listed Companies thesis submitted in total fulfilment of the requirements for the degree of Doctor of Philosophy School of Business University of Ballarat Australia
3. Ivan K.Cohen 2005 Focus on Financial Management Imperial College Press 4. James C. Van Horne 2002 Financial Management Policy Pearson Education
5. Jonathan Lewellen& Katharina Lewellen 2006 Internal Equity, Taxes, and Capital Structure, Dartmouth College and NBER 6. Lawrence J. Gitman 2005 Principles of Managerial Finance Pearson Education Tenth Edtion
7. Moyer Mcguigan Kretlow 2001 Contemporary Financial Management Ninth Edition South Western College Publishing 8. Peter Atrill 2009 Financial Management for Decision Makers Prentice Hall
VOLUME NO. 6 (2016), ISSUE NO. 09 (SEPTEMBER)
ISSN
2231-5756
MAIZE CULTIVATION IN KARNATAKA & GROWERS’ AWARENESS ON PRICE RISK MANAGEMENT TOOLS.
V. CHANDRA SEKHAR RAO
ASSOCIATE PROFESSOR
DEPARTMENT OF MANAGEMENT STUDIES
GLOBAL ACADEMY OF TECHNOLOGY
BANGALORE
DR. G V KESAVA RAO
PROFESSOR & DEAN (RESEARCH)
DEPARTMENT OF MANAGEMENT STUDIES & RESEARCH CENTRE
RNS INSTITUTE OF TECHNOLOGY
BANGALORE
ABSTRACT
“Is Maize a potential crop for/to farmers of Karnataka?” Maize a versatile crop having wider adaptability under different agro-climatic conditions is globally known as queen of cereals with its usage. Maize with its highest yield potential is one of the principal cereal crops in India, contributes to the economic growth with substantial employment and significant contributions to export earnings. In India, Maize is the third most important food crop with nearly 9% stake in the national food basket. In addition to being staple food for humans and quality feed for animals, maize serves as a basic ingredient to thousands of industrial products. Maize is cultivated throughout the year in all the states of India & predominantly in Andhra Pradesh (20.9%), Karnataka (16.5%), Rajasthan (9.9%), Maharashtra (9.1%), and Bihar (8.9%) contributing to more than 80% of the national maize production. In southern states of India, farmers are substituting maize for rice wherever there is a drop in the water level, as maize is considered as a viable option for diversifying agricultural production owing to its adaptability in multiple seasons under different ecologies. Karnataka stands in first position in Maize productivity and is cultivated in all the seasons in most of the districts. Though Karnataka is considered to be one among top five growing states in agricultural sector, it is characterized by lack of reliable and timely information with a dearth of analysis on various vital aspects related to crop marketing, prices, trends at major national and international markets, demand and supply pattern, scientific forecasting, crop and weather information. Despite the initiatives from different segments including government of Karnataka, unfavorable deviation in market prices of maize are leading to reduced income to farmers and traders. It is known from studies that risks faced by Maize growers are forcing them to re-think on alternative commercial crops in the absence of awareness on effective risk management measures and tools like derivative instruments. This research paper is an attempt to study the marketing patterns of maize, awareness of price risk mitigating tools among maize growers in Karnataka state. Research work done through structured questionnaire served in vernacular language to maize growers in 3 selected high maize yielding districts of Karnataka state, tries to answer the questions like what are the constraints in maize marketing?, Are there tools available to mitigate the risks? What are the initiatives of the Government of Karnataka to increase the maize growers’ financial returns? and so on.
KEYWORDS
Maize derivatives, NCDEX, pledge loans, warehouse receipts.
INTRODUCTION
aize, the queen of cereals with its wider adaptability to varied agro-climatic conditions, its efficient utilization of radiant energy and fixation of CO2 from
the atmosphere, is considered as one of the major high yielding crops of the world. It is providing approximately 30% of the food calories to more than 4.5 billion people along with rice and wheat and addressing some of the food security issues of the developing nations. Maize is cultivated among 160 countries having wider diversity of soil fertility covering nearly 178.61 Mha of cultivatable land with 1007.47 million mt of production during 2014-15. It covers nearly 36% of the global grain production and gained popularity across the globe due to its considerable utility in many sectors in different forms, majorly as feed source for animals. It serves as a basic ingredient to thousands of industrial products that include starch, oil, protein, alcoholic beverages, food sweeteners, pharmaceutical, cosmetic, film, textile, gum, package and paper industries etc. It is estimated that nearly one-fourth of the stock keeping units in a modern grocery store contain maize in one form or the other. These range from toothpaste, detergent, paper, dyes, soaps to artificial sweeteners, fructose, etc. Maize also finds application in food containers, plastic food packaging, baby powder, diapers, medicine, vitamin tablets, textile products, candies and so on. Maize rich breakfast cereals, snacks, popcorn and cooking oils have also become popular. Internationally, maize has been processed to produce bio-ethanol in a big way for blending with auto fuels.
Low cost of cultivation, easy adaptability to various climatic conditions, increasing productivity, more cultivars, minor fluctuation in prices compared to other cereals and finally high potential for export demand from all over the world are catching the attention of agriculture sector in India. The United States of America (USA) produces 35% of world’s maize. It occupies the first position in Maize production followed by China and Brazil. India stands at fifth position with annual production of around 23.67 million tonnes from 9.3 million hectares contributing 2.35% of world production in 2014-15. India has a competitive advantage in supplying produce to the world markets since it has a dual crop season. Maize’s Kharif production share is about 75% and Rabi’s share is about 25% in India. Around 52% of the total demand is from poultry feed in India and the remaining 48% is from human consumption and the processing sector. India requires 325 million tons of food grain by 2020 AD to satisfy needs of its population, which demands consistent increase in production and productivity of agricultural crops. Agriculture sector growth from 2.9 percent to 3.6 percent per year during 2005 to 2015 is insufficient and need to depend on increasing maize cultivation among all the states. During the last three decades, Maize production in India has remarkably increased, driven by the demand from the animal feed industry. Maize is grown in traditional areas under rainfed condition to meet household requirements and in non-traditional areas with more favorable production environment for commercial purpose. Maize is cultivated throughout the year in India owing to production in both kharif and rabi seasons. Maize is cultivated in almost 524 districts out of total 686 districts of India covering all the states predominantly in Andhra Pradesh, Karnataka, Rajasthan, Maharashtra & Bihar. It has witnessed 56 per cent growth in 10 years compared with 20 per cent for rice and 32 per cent for wheat. The growth has been supported by an absence of government control widely seen in wheat and rice. The agriculture price support policy of the central government is also designed to boost Maize production by announcing minimum support price of Rs 1,310 per quintal in 2013-14 and 2014-15. The crop has been included in the government’s ambitious Rs. 500 crores crop diversification strategy announced for North Indian states of Punjab, Haryana and western Uttar Pradesh. In Southern states of India, farmers are substituting maize for rice wherever there is a drop in the water level as Maize is considered as a viable option owing to its adaptability in different ecologies. Estimated demand of over 30 million tonnes of Maize from poultry sector by 2020, changing food consumption patterns due to urbanization, increase in consumption of processed food that uses maize, India being 3rd largest egg producer and 5th largest poultry meat producer which mainly depends on maize usage as feed, rising demand for poultry and fish
which uses corn as feed are creating heavy demand for Maize cultivation. Return on Maize to the farmers depends on domestic and international demand and supply factors like Government interventions through the minimum support prices, demand from local millers, global inventory level and current production
VOLUME NO. 6 (2016), ISSUE NO. 09 (SEPTEMBER)
ISSN
2231-5756
numbers. Quality specifications like the moisture content, the grains quantity in100 grams, problems from fungus, dunkey, powder thyrum are some of other factors influencing the return to farmers. Generally, the price hint in the market is taken from NCDEX futures prices and from spot markets like Nizamabad (Tel-angana), Davanagere (Karnataka), and Gulabbagh (Bihar).
Karnataka the prominent player of Maize cultivation produced 3.84 million tonnes of Maize from 1.37 million hectares in the year 2014-15. Karnataka, an agricul-tural dependent state, is characterized by wide crop diversification, reliant on southwest monsoon. In Karnataka, Maize Scenario is with 40% area under irrigation and 60% area is of rainfed. There is an increasing trend in the area, production and productivity of Maize in Karnataka state over the years with Compound Annual Growth Rate (CAGR) of 8.5 per cent in last three decades. During the last ten years, the area under Maize in Karnataka has increased by 41 per cent. Uttarkannada, Shimoga, Raichur, Hassan and Chikmaglur districts have considerable production of Maize crop in the state. Davangere is the major Maize producing district in Karnataka accounting for 25 per cent of the state production and is estimated at 800,000 tonnes. Major markets of Maize in Karnataka are Davanagere, Haveri, Belgaum and Bagalkot. The sowing period of Maize in Karnataka starts from end of May and harvesting starts in the middle of October.
AGRICULTURAL MARKETING IN INDIA
Marketing of agricultural produce which involves moving agricultural product from the farm to the consumer, has not gained as much importance as the agricul-tural production in India unlike developed countries. Generally, in the developing countries, the agriculagricul-tural marketing services will be attached to their respective agricultural ministries which help in development of market information, infrastructure development, marketing extension and training in marketing. Agricultural ministries with its supportive policies, legal, institutional, macro-economic, infrastructural environment focuses on agribusiness. Indian farmers face the problem with disposal of their produce and this problem is gaining equal importance as the modern production technology adoption. Stable prices will induce the cultivators to expand production and increase their marketed surplus. If the sustained breakthrough in agricultural sector has to be achieved, the farmers are to be relieved of the risks and uncertainties involved in agricultural production and marketing. Maize producers in India are no exemption to the risk facing from the cash crop producers. In Indian Maize production, few major problems have been identified which are to be addressed in order to have the advantage of high productivity and adaptability to all climates. The price fluctuation in the post-harvest period due to heavy arrivals in the market with advent of high yielding varieties, increased production resulting distress sale after harvest, lack of market information regarding prevailing prices, arrivals etc., unavailability of grading of Maize at producers’ level, inadequate storage facilities in villages which contributes to distress sale, inadequate facilities of transportation at village level leading to forced selling in the village itself to merchants or traders directly at low prices, inadequate training in marketing system, malpractices prevailing in the markets of maize i.e., excess weighment, delay in payment, different kinds of arbitrary deductions for religious and charitable purposes etc, lack of market finance are few of the major mar-keting problems faced by the maize growers.
Information Dissemination is crucial to the farmers to make informed decisions about what to grow, when to harvest, to which market produce should be sent.
It helps to estimate the demand for the product and in decision making on storing the product in warehouses till demand arises. Most of the farmers do not have accessibility to roads to reach the regulated markets, as infrastructural development in villages of India is still a continuous process in many states. Regulated markets and warehouse facilities are generally at city levels and moving the produced to markets itself is big problem with either bad roads or no roads.
PRODUCTS USED IN THE MANAGEMENT OF PRICE RISK
Derivative products have the ability to shift the price risk from producers. Maize futures are standardized, exchange-traded contracts in which the contract buyer, generally intermediary or a consumer agrees to take delivery from the seller, the producer, a specific quantity of Maize at a predetermined price on a future delivery date. Maize producers can employ a short hedge to lock in a selling price for the Maize they produce, while businesses that require maize can utilize a long hedge to secure a purchase price for the commodity they need. The prices of futures contracts are determined by free competition amongst market partici-pants.
REVIEW OF LITERATURE
1. K. Singha and A. Chakravorty (2013) in their article, ‘Crop diversification in India: A study of Maize cultivation in Karnataka’, mentioned about growing need of agricultural production has been really felt with the growth of population, not only for the sake of food security but also for providing employment. Crop diversification within the sector has also been noticed to a great extent of which, the growth of production of Maize has registered at the highest with CAGR at 8.5 per cent in the last three decades. Using one way ___ Least Squares Dummy Variable (LSDV) for twenty-seven districts over twelve years, present study explored that the introduction of new hybrid seed (HYV) is one of the most important factors for significant growth of Maize crop in the state.
2. In the article, 'The Role of Derivatives in The Commodity Market', Soumya Mukesh, discussed the history of commodity derivative market in India. Author said that investing directly in the agricultural products and commodities gives the investor a share in the commodity components of the country’s production and consumption. Money managers and average investors, however, usually prefer commodity derivatives rather than commodity themselves. The average investor does not want to store grains, cattle, crude oil, or metals. A common investment objective is to purchase indirectly those real assets that should provide a good hedge against inflation risk.
3. In the article ‘Problems and Prospects of Agricultural Marketing in India: An Overview’, authors A. Vadivelu and B.R. Kiran mentioned about the agri mar-keting and facilities available to farmers to sell the produced. They pointed out that marmar-keting of all farm products generally tends to be a complex process. They felt that suitable marketing system should be designed so as to give proper reward or return to the efforts of the tiller of the soil. In the article, they focused on importance of market information as a means of increasing the efficiency of marketing system and promoting improved price formation. In the authors’ perspective, it is crucial to the farmers to make informed decisions about what to grow, when to harvest, to which market produce should be sent and whether or not to store it. Authors felt the need of creating awareness among the farmers through the agricultural extension agencies like the State Department of Agriculture, KrishiVigyanKendras.
4. In the article ‘Value Chain Analysis of Maize Seed Delivery System in Public and Private Sectors in Bihar’, authors Ranjit Kumara, Khurshid Alama, Vijesh V. Krishnab& K. Srinivasa (2012) have stated that Bihar has emerged as one of the most promising states for Maize production in India, where it is cultivated in all the three seasons. This offers an opportunity for strengthening maize supply chain from seed to end-use. Different systems of maize seed delivery co-exist in the state. This study has been conducted in the Samastipur district (the largest maize growing district) of Bihar in 2010 11 and is based on surveys of seed producers, farmers, seed distributors, private seed companies and public research institutions as to understand the delivery system of maize seed in a value chain perspective. The study has mapped the value chain of public and private seed systems and has brought out the need for a greater emphasis on integration of different stakeholders involved in the chain.
5. Km. Saroj Gupta. (2012), in her article ‘Sustainability of scientific maize cultivation practices in Uttar Pradesh, India’, (2012) talked about the Sustainability
of scientific maize cultivation practices must be ensured to attain the goal of agricultural sustainability. The study was conducted in purposively selected state i.e. Uttar Pradesh. A total sample size of 80 maize farmer respondents and 20 SMS/Experts were selected by using multi-stage random sampling tech-nique and simple random selection procedure respectively. The study revealed that higher sustainability in all practices is significant.
6. B. R. Kumara, S. B. Hosamani, N. R. Mamle Desai, S. N. Megeri and M. H. Hosamani (2012) in their research article, ’Costs and returns of major cropping
systems in northern transition zone of Karnataka’, mentioned about their research study which was conducted in Dharwad and Belgaum Districts of
VOLUME NO. 6 (2016), ISSUE NO. 09 (SEPTEMBER)
ISSN
2231-5756
7. Amrutha C.P (2009), in her doctoral thesis, ‘Market Information System and its Application for Agricultural Commodities in Karnataka State – A Case of
Onion’, opined that market information is an important facilitating function in the agricultural marketing system. It facilitates marketing decisions, regulates
the competitive market process and simplifies marketing mechanisms. Market information is a means of increasing the efficiency of marketing system and promoting improved price formation. It is crucial to the farmers to make informed decisions about what to grow, when to harvest, to which market produce should be sent and whether or not to store it. Improved information should enable traders to move produce profitably from a surplus to a deficit market and to make decisions about the viability of carrying out storage where technically possible. She has quoted through her research that, at present, the information is disseminated through various media like radio, newspapers, blackboard display and public address system at market yards. The information provided by these methods is stale and does not help the farmers sufficiently in taking decisions in marketing their produce.
8. G. Basappa, J.B Deshmanya and B. L. Patil (2007) in their research work ‘Post- Harvest Losses of Maize Crop in Karnataka - an Economic Analysis ’, stated that improper post-harvest handling has led to considerable loss in Maize. The present study was conducted during 2003-2004 in Karnataka for estimating post-harvest loss in maize at different stages at farm level. It is selected based on maximum area under maize crop that is grown largely in Davanagere and Belgaum. The post-harvest loss at farm level was estimated to be 3.02 kg per quintal. The share of harvesting loss was at maximum. There is a need for an integrated effort to increase the productivity by evolving high yielding varieties of hybrids in maize. The improvement in storage facilities required immediate attention of the policy makers for reducing post-harvest loss in maize.
NEED FOR THE STUDY
Despite Maize called as the queen of cereals with its productivity and adoptability to all climates and soils and huge demand across the world, growers/farmers are facing problems in production and marketing of Maize produced. Lack of market information regarding prevailing prices, increased arrivals in the markets due to introduction of high yielding varieties of maize, lack of storage facilities, lack of training in marketing system, malpractices prevailing in the markets of maize like excess weighment, delay in payment, auction, growers' aggressive production practices often lead to change in crop returns and profitability. In spite of measures taken by Government of Karnataka at state level and GOI at national level, returns are less to Maize farming community. This study tries to explore awareness of options available for Maize growers to cash their labour and production in Maize.
OBJECTIVES OF THE STUDY
1. To know about Maize and its growth in India in general, and Karnataka state in specific. 2. To understand the Agri marketing system prevailed in the Karnataka with reference to maize. 3. To understand the awareness of risk tools and provisions available for Maize growers
RESEARCH METHODOLOGY
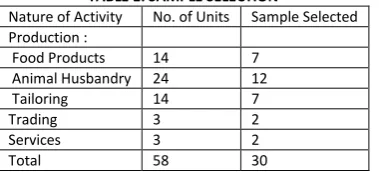
Research methodology adopted in this paper is partly based on conceptual study & partly based on descriptive study. Study deals with the problems faced by Maize growers of Karnataka in marketing the produced, the initiatives of Government of Karnataka relevant to maize and maize growers. The objective of the paper is to know about the awareness of farmers on price risk management tools. Paper parallelly focuses on creating awareness among the readers about potentiality of maize production, the risk management tools and provisions available to hedge the risks faced by farmers. Data was collected from both the primary sources through structured questionnaires and secondary sources of websites, journals and other publishing. 150 Maize farmers from districts of Davanagere, Chitradurga & Bellary districts were served the questionnaires in order to collect the data about the various marketing related aspects of maize. Farmers are selected on random basis with convenient sampling covering almost all the parts of 3 districts.
ANALYSIS AND FINDINGS
Though farmers/growers do not participate directly in commodity markets, they benefit through the price signals emitted by the futures markets and information dissemination done by different stakeholders through different methods. The primary benefit of the commodity derivatives is price discovery mechanism through futures market. Demand in national exchanges and international exchanges through futures prices enable the farmers to take right and informed decisions on storage options of maize. Information makes them to understand the trends in prices and demand makes them to retain the product and realize better prices and returns. Regular dissemination of price information by Forward Markets Commission with the help of national commodity exchanges has made the farmers to track the markets and demand and is making better usage of information in negotiating the prices. Price dissemination happening in all states through display boards on regular basis in all major villages provides a good reference to assess spot prices and bringing farmers and traders at a platform with correct price negotiations and it also created awareness on mechanism of locking-in the desired prices.
In connection to the study, the questionnaire carries questions on primary risks faced by maize farmers, maize pricing factors, maize selling centres, awareness on MSPs provided by Government of Karnataka, information on price dissemination project of central government, awareness on price risk management tools like commodity futures, mechanism of futures for fixing the prices and so on.
Analysis of data collected through questionnaire served to 150 farmers led to the following information:
1. Among maize pricing factors, previous year price, relative product price, resources cost, expenditure per acre, labour cost, climate, demand and supply, MSP
have occupied almost equal percentage in the opinion of farmers. MSP and previous year price as leading factors.
FIG. 1
2. Related to price information sources to farmers, respondents came out with choosing local traders, co-operative societies, and APMCs as major information
sources with equal weightage. Other sources such as co-farmers, newspaper, radio, television, agricultural extension staff, kirana stores and agri-magazines have good share in communicating the market value of maize to farmers.
140
100
120
120
130
140
VOLUME NO. 6 (2016), ISSUE NO. 09 (SEPTEMBER)
ISSN
2231-5756
FIG. 2
3. When asked about the awareness of price dependency on grading and moisture content of 14% limit, 100% farmers accepted on it and also quoted other factors
like limit of grains number in 100 grams and so on.
4. Nearly 140 out of 150 farmers said that they are not aware of the information dissemination project taken by the Government of India and the methods followed
by them in disseminating the prices of the commodities, training provided by the NCDEX as a partner to the government, APMC role and other things.
FIG. 3
5. Few of the respondents are aware of price information dissemination through APMC ticker boards method, but all have given their negative opinion on display
as ticker boards are presently not there in Davanagere, Chitradurga and Bellary market yards. But farmers are able to get the price information from staff of APMCs. When farmers are attached with APMC market yards by registering their mobile number in APMC office, and cooperative societies, farmers are able to get prices in vernacular message in the form of messages to their registered mobiles.
TABLE 1
Prices displayed on APMC ticker boards Prices displayed in native language Yes No Yes No
0 150 0 150
6. When tried to collect the information about where the crop is sold, majority(2/3rd) of farmers told that they bring their crop to the yards and sell as now
transparency is there in buying and selling though brokerage charges are there. Nearly 55 farmers are selling to the local lenders and commission agents with whom farmers are in oral contract to deliver, and from whom loans and seeds are taken. Though procurement centres are there from government end, quality specifications of FCI and other matters related to payment are leading farmers to not to sell.
FIG. 4
7. Awareness on minimum support prices announced by the Government of Karnataka is not impacting farmers’ returns, though the awareness is there in almost
all farmers. The price what farmers get majorly depends on quality aspects and decision of traders supported by demand factors, the MSP is not much sought aspect by farmers. Except 2 to 3 times, almost in all the years, farmers are able to realize the above MSP prices.
FIG. 5
8. Concerned to the price risk farmers are facing, they are not in a position to safeguard themselves from the price fluctuations due to prevailing demand and
supply factors. Selling of crop is happening under distress and urgent need of cash or reaching the target price. No farmer is aware of price fixation that can happen much before the harvesting of the crop.
0
50
100
150
150
140
100
125
150
100
10
140
Aware of price dissemination project
Not aware of price dissemination project
95 25
20 10
Mandi
Local_Lender
Local_Dealer
Commission_Agent
145 5
Aware of MSP
VOLUME NO. 6 (2016), ISSUE NO. 09 (SEPTEMBER)
ISSN
2231-5756
9. When asked about the collective storage facility provided by APMC yards, farmers said they are aware of them but not utilizing them. They keep the material
under the custody of their yard registered brokers and sell based on the price in the market. Most of them dispose when crop is brought to yards with prevailing prices and very few take them back as farmers fear of charges of storage and non-availability of sufficient godowns and they do not use the collective storage facility.
10. When asked about the awareness of price management tools like commodity futures (maize farmers), except 2 from Davanagere district who are considered
to be wealthy farmers, remaining all said they are not aware of the futures and commodity markets. The farmers who are aware also named them as government contracts and not aware of commodity markets as such.
FIG. 6 & 7
Concerned to other price risk management tools and facilities, farmers are almost with zero information at their end.
FINDINGS
From the data collected through secondary sources, it is evident that there is an increasing trend in the area, production and productivity of maize in Karnataka and has consistent demand for maize from Karnataka Milk Federation (KMF), poultry industry and many other industrial sectors. As a part of support to farmers, Government of Karnataka has taken many initiatives in all stages right from soil checking to marketing of the final produce. Providing minimum support prices to crops, integrating markets & market participants, procuring the crop from farmers are among the support measures taken by the government.
Few major initiatives that support maize farmers along with other growers are:
'Bhoochetana', project was initiated in the year 2009-10, to increase the average productivity of rainfed crops by 20%.
‘BhooSamruddhi’ was a project initiated to rejuvenate soil fertility and water management. It is now in its third phase, which helped the farmers to gain huge returns as crop selection was based on the soil suitability and fertility. 'Bhoochetana’ & ‘BhooSamruddhi’ adoption has reaped huge returns and has caught the other states attention.
‘Krishi Bhagya’ is a project for saving rain water. It is a method wherein seepage proof water harvesting structures and micro-irrigation is promoted on package basis. 80% of investment on the implementation is borne by government and farmer has to take care of remaining 20% only.
‘Krishi Mela’ one more prominent initiative from Government of Karnataka is meant for disseminating information on the scope of post harvest technology, seed processing, soil and water conservation practices, organic farming, green house technology and farm machinery. Melas also disseminate the information about availability of technical, financial and other supports offered under various Government schemes. They train the farming community on judicious usage of natural resources like water and soil.
As a part of agri-marketing initiatives and reforms, Government of Karnataka has established a joint venture company ‘Rashtriya e-Market Services Limited
(ReMS)’, partnering with NCDEX Spot Exchange Limited. The ReMS integrates the operations of APMCs in Karnataka under one system with complete
tech-nology and management solution. This system helps all the yards to modernize the infrastructure which enables the market participants to take the benefit of transparent and efficient price information