Vol. 2 (2012) No. 1 ISSN: 2088-5334
A Comprehensive Study of Using 2D Barcode for Multi Robot
Labelling and Communication
A.H. Ismail
*, S.J. Jamil
#, A. Hilmy Ismail
*, M.N. Ayob
*, N. Abdul Rahim
* *School of Mechatronic Engineering, Universiti Malaysia Perlis (UniMAP), Perlis, Malaysia.Email: [email protected], [email protected], [email protected], [email protected]
#Institute of Engineering Mathematic (IMK), Universiti Malaysia Perlis (UniMAP), Perlis, Malaysia. #[email protected]
Abstract — Multi robot is an emerging field in robotic research with surprisingly various open problems. Reports have been published stating the advantages of multi robot over conventional single robot, including reducing task completion time. One of the open problem as concentrated in this study is their communication. This study focuses on using a 2D QR barcode for robot labelling suitable for vision-based multi robot communication. The aim is to prove that QR barcode could be decoded in various distances as well as in different angles. Image sampling is done in controlled environment. A two-way ANOVA without repetition is used to analyze the image data in terms of successful QR decoding. ANOVA with significant level of critical α 0.05 is used and has justified that smallest variance at different distances and angular pose will give the best position in order to decode the respective QR barcode. Hence multi robot communication by means of labelling a QR label onto them has the possibilities for further research.
Keywords — Multi robot, communication, labelling, QR barcode
I. INTRODUCTION
Multi robot, occasionally known as distributed robotics or coordinated robot, is an application of using more than one robot in solving typical daily problems. A research by [1] explain the practice of multi robot in exploring an unknown environment. Experiments has proved the time achieved to explore a new unknown environment is drastically reduce when using two or more robots compared to one robot.
It is certain that multi robot is an emerging new research area filled with various open problems. One of the major concerns is the communication among the robots and their labelling, or identification [2]. It is sensibly important as to avoid collision as well as job redundancy [3].
There are many approaches that have been taken in order to undertake this problem. The prominent approach is by using wireless radio communication by means of radio frequency, Wireless Sensor Network (WSN), specific frequency of communication such as WLAN, Bluetooth, infrared, and many more [4][5][6][7]. There are also new direction in multi robot communication by using sound processing, where languages only understood by the robots is being developed [8][9]. These researches were inspired by the legendary Star Wars movie character, the R2D2 and 3CPO.
However, very few studies on using vision-based identification have been conducted. A vision-based multi robot system is normally focused on the localization of each individual robot as presented by [10]. In order to identify the right robot in its colonial systemic order, this paper proposed using a 2D matrix barcode for each robot that could contain a great amount of information about each and every particular robot. This study in particular, will focus on justification of using a 2D QR barcode suitable for multi robot labelling and communication in general.
II. 2DBARCODE INTRODUCTION
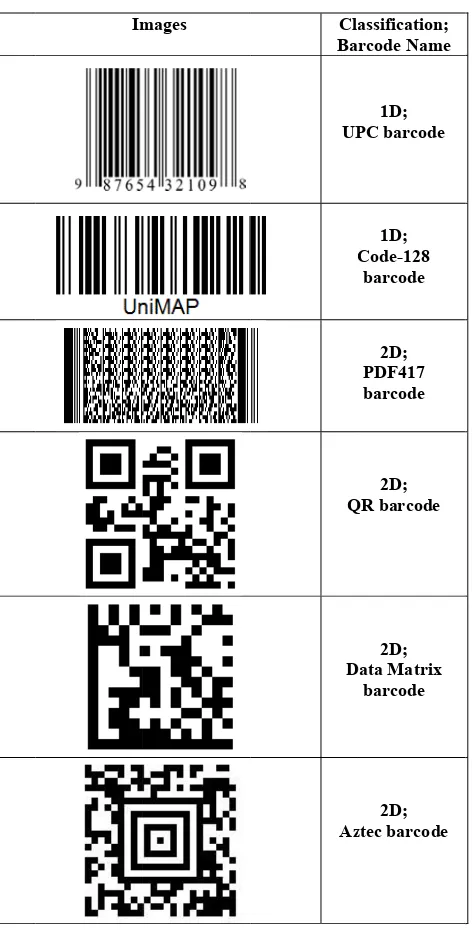
Barcodes are widely known in today communities. Going back in history, barcode are used to store data in parallel lines in different widths, so called the 1D code. It was first used in the USA in the transportation system to track the delivered goods. Since then, barcodes were heavily used in every aspect; we could see them in shopping market, airport, and even in adverts. In addition, some of the most recent mobile phone was already embedded by barcode reader to alleviate barcode reading. This phenomenon proves how popular the barcode has been.
suit Lite cha labe 2 the sing cha info vari coo Q mod and illu find cru that
table one fo eratures sugg aracteristic [11
elling and com
Im
2D barcode sy fact that it ab gle code. Als aracter are al
ormation requ ious forms. ordinates, etc. QR barcode is dule [12]. Ea d white modul ustrates the st der patterns lo cial reason of t the vision sy
or multi rob gested that 2D 1] and could b mmunication.
TAB EXAMPLES O
mages
ymbology is bility to store so, capabiliti lso a chosen uired to store a It could be
s chosen in th ach module c les represent ‘ tructure of th ocated at the c f its selection.
ystem sees an
bot research D Barcode ha be possibly use
BLEI OF BARCODES Cl Ba UP Q D Az
chosen in thi e enormous in
es of encodi factor. This at the multi ro
in alphabet
his study prima orresponds to ‘1’ and ‘0’, re he QR code. corners. The f
It is indeed th nd important f
is fairly t as the ultima ed for multi ro
assification; rcode Name 1D; PC barcode 1D; Code-128 barcode 2D; PDF417 barcode 2D; QR barcode 2D; Data Matrix barcode 2D; ztec barcode
s research du nformation in ing alphanum is importan obot barcode i t label, num
ary because o o a black mod espectively. Fi
There are th finder pattern he very first b for detection. task. atum obot ue to one meric nt as is in meric of its dule ig. 1 hree is a lobs The QR cor not be d 1 2 3 4 I the stud are The is s F rob see
d, t be sen
Fig
R structure is rrection area, t
In order to ju t be used for m
done, conside
1. Encoding
developed
2. 2D barcod
[11],
3. Capability
4. Capability
In summary, t 2D symbolo dy is highly i
the decoding ese two criteri somewhat deco
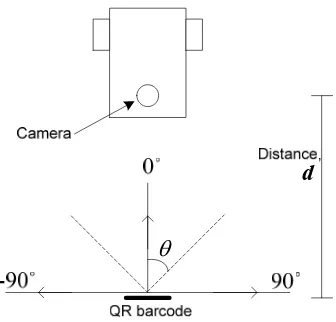
Fig. 2 dramati bots environme the barcode o the robot com easier, and o nse of using ro
d
g. 2: An illustrati
divided into t the data area a
Fig. 1: QR b
ustify whether multi robot id
ring these fac
g, decoding, a d based on 2D
de generation
y of decoding y of decoding
the criteria nu ogy as sugge ntended to ca capabilities a ia are undoub oded in unkno ise the paradi ent. It could b of robot B in mmunication a
f course it co obotic vision s
ion of using 2D b and lab
three area all and the reserv
barcode structure
r a QR barcod dentification, a
ctors:
and scanning D barcode sym n and managem
g at distances, g at different a
umber (i) and ested by [11] ater the last tw at different dis btedly importa own distance a igm of using be seen that if an angular of and perhaps l ould be only system.
barcode in multi r abelling.
ocation; the e ed area [12].
de could or co a deep study m
g program w mbology [11],
ment technolo
and angle.
(ii) is fulfilled ]. Therefore, wo criteria, w stances and an ant as the barc
and angle. barcodes in m
robot A is ab f θ and at dista
III.EXPERIMENT METHODOLOGY
This study focuses on experimental procedure to prove the use of QR barcode in multi robot environment in the sense of statistical analysis of decoding the barcodes at different angles and distances. Fig. 3 depicted the flow chart of methods taken in this study. An image processing approach is done through sampling, filtering and decoding algorithm, as suggested by [12]. Successful sample decoding is calculated, and tabulated and compiled in a table for further analysis and validation.
Start Research
Design Image Sampling
Image Filtering Decoding
Algorithm Data
Compilation
Data Analysis Database &
Validation End Image Processing
Fig. 3: Methodology Flow Chart
The study concentrated on the suitability of the QR barcode for multi robot labelling and communication. Hence, the research design is planned such a way that to prove the criteria discussed earlier, including concrete statistical analysis. The robot hardware is prepared with embedded vision system consists of basic control system and actuators. However, since the study focus on hypotheses validation, the hardware part will not be discussed in this paper.
Image sampling is done by using experimental setup shown in Fig. 4 (side view) and Fig. 5 (top view). 50 images are captured in similar angles and distances in a controlled environment. The lighting condition is controlled by using a light meter; yield the reading in the range of 180-220 lux. The distance experimented are 50cm, 100cm, 150cm, and
200cm while the angles as shown in Fig. 5 are 0˚ in the
middle, 15˚, 30˚, 45˚, 60˚, and 70˚ in the right camera point of view, -15˚, -30˚,-45˚, -60˚, and -70˚ in the left camera point of view. The image sampling has yield a total of 2200 images, adequate enough for statistical analysis later.
d Fig. 4: Side view of image sampling
d
Fig. 5: Top view of image sampling
The image which successfully decoded by means of image processing are vectorized and tabulated for hypothesis validation. The tabulation process also helps with database making and useful for further research.
The statistical analysis is done by using the two-way Analysis of variance (ANOVA) without repetition. It is used to test hypotheses about the differences between the means of variable distance and angle. ANOVA is also used in this study in order to test for samples mean and variance as well as to identify the data trustworthiness in the critical significant value α 0.05. The α is set to 0.05 to verify that the robot is able to recognize other robot with 95% confident level. The experiment is done without repetitions means that there is one reading for every case. The results for two-way ANOVA without repetition is slightly different in that there is no interaction effect measured and the within row is replaced with a similar but not equal error row.
IV.SAMPLING RESULT
The camera captures the image in RGB color space and it is processed to output in binary images. The conversion is done by applying commonly used weighted of R, G, and B component to obtain grayscale image and binarized by using automatic threshold algorithm proposed by [13]. The equation for commonly used weighted sum of R, G, and B component is given as (1):
0.2989 0.5870 0.1140
gs
R
I G
B
(1)
TABLEII SOME OF THE IMAGE RESULT
Type: Distance,
Angle
RGB Image Binary Image
50cm, 0˚
50cm, 75˚
100cm, 45˚
100cm, -60˚
150cm, -75˚
200cm, 75˚
V. STATISTICAL ANALYSIS
In this study, two hypotheses are to be studied. The first hypothesis is about decoding the QR barcode in different distances, while the second hypothesis is decoding in various angle. As stated in the experiment design earlier, image sampling has been made to occupy with this study yielding in 2,200 digital images, sampled to use for the statistical analysis. Statements below stated the null hypotheses in this study;
Ho (1): There will be no difference between all the angles,
and
Ho (2): There will be no difference between all the
distances.
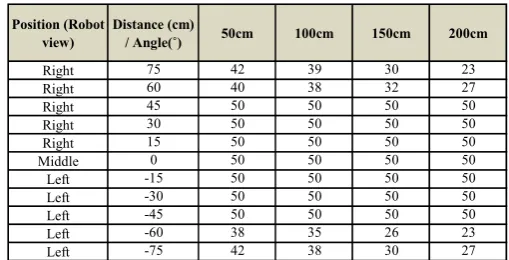
Table 3 tabulated the result data. At middle camera view
or 0˚, all 50 image of QR barcode is successfully decoded
regardless the distance. Only at intense cases of angle such
as 75˚ and -75˚, some of the images are unsuccessfully
decoded. This is perhaps due to the decoding algorithm that failed to find three finder patterns in the respective images, or perhaps due to the bad resulting image as the impact from extreme angle and distance.
TABLEIII
RESULT DATA ATDIFFERENT DISTANCE AND ANGLE
Position (Robot view)
Distance (cm)
/ Angle(˚) 50cm 100cm 150cm 200cm
Right 75 42 39 30 23
Right 60 40 38 32 27
Right 45 50 50 50 50
Right 30 50 50 50 50
Right 15 50 50 50 50
Middle 0 50 50 50 50
Left -15 50 50 50 50
Left -30 50 50 50 50
Left -45 50 50 50 50
Left -60 38 35 26 23
Left -75 42 38 30 27
A randomized block design and two-way ANOVA without replication was conducted. The distance variable measured in four levels; which are 50 cm, 100 cm, 150 cm and 200 cm. In the other hand, the angle variable is
measured with eleven levels; from -90˚ to 90˚ as shown in
Table 3 earlier. This angle variable is treated as blocks are selected for statistical treatment, in the manner analogous to that of the one-way ANOVA. The treatments within each block stretch across the different distance, and the blocks spread down the angle. By using a randomized block design and a two-way ANOVA without replication, the variability can be partitioned into variability due to treatment and variability due to angle. In this case all effects were statistically significant at the 0.05 significance level.
TABLEIV
RESULT OF THE RANDOMIZED BLOCK ANOVA TEST
Variation Source
Sum of Squares
Degree of Freedom
Mean
Square F
Treatments 222.0909 3 74.0303 5.478193
Blocks 2937.682 10 293.7682 21.73865
Error 405.4091 30 13.51364
Total 3565.182 43
Table 4 illustrate the result of the randomized block ANOVA test. The treatments is calculated at their own block
using the function of sum of squares, or
2
1
t
j j
n
x
x
where n represent the size of each treatment or block while j
is the each component in the treatment or block. The mean square is then calculated from the treatment or block, where
between-treatment is used for treatments or block, while
within-treatment is used as sampling error. The DOF for treatment is n-1 or 4-1 = 3 or whilst for blocks is 11-1 = 10.
From the result, we found that the main effect of the between subjects variable distance is significant using a critical α of 0.05, the critical F is (F (3,30) = 2,92, p< 0.05 ).
The calculated value (F (3,30) = 5.48) exceeds the critical
value, and, at the 0.05 level, we are able to reject the null hypothesis that will be no difference between the all angles. At this level of significance, our conclusion is that the overall distances are significantly differences. For the second hypothesis, the main effect of the within subject variable
type of angle is significant using a critical of α 0.05, the
critical F is ( F (10,30) = 2.16, p<0.05). In this case, the
calculated F (21.74) is greater than the critical value (2.16)
and therefore H0(2) is rejected. Hence, the overall angles are
significantly difference. Our conclusion is then is made such a way that both hypotheses are significantly differences. The result also showed that with significant level of 0.05, or equivalent to 95% confident level, we are 95% corroborate that the robot may recognized other robots in the sense of using QR barcode with at least 95% credibility.
In examining the Excel printout, our purpose in this randomized block ANOVA was not to examine the impact of the blocking variable (angle category) as an independent variable. Also, our model does not include any consideration of possible interaction between blocks and treatments, as will the two-way ANOVA with replication.
From the values in Table 3, we can see that the smallest variances at different angles and distances will give the best position in order to decode the 2D QR barcode.
VI.CONCLUSIONS
This comprehensive study is a stepping stone for vision-based multi robot communication. It is important as this type of communication does not imply frequency-based communication, and therefore will avoid communication channeling errors and redundancy.
The QR barcode is not only innovative for marketing purposes, but it could be useful for labeling, creatively for the robot. The study has proven that the QR barcode could be use for this purpose at undeniably high confident level, which is at 95% confident level. The null hypotheses in this study are rejected, which mean that there are significant differences between distance and angle, proven that it is not a barrier. This statistical data has agreed with our main idea
where QR barcodes could be used for multi robot labeling and communication.
ACKNOWLEDGMENT
This study is funded by the UniMAP Short Term Grant (STG) number 9001-00286. Nevertheless, we would like to thank every single individual that involves directly or indirectly in this study.
REFERENCES
[1] K.M. Wurm, C. Stachniss, and W. Burgard, “Coordinated multi-robot exploration using a segmentation of the environment,” 2008 IEEE/RSJ International Conference on Intelligent Robots and Systems, Sep. 2008, pp. 1160-1165.
[2] A. Tamio and P. Enrico, “Editorial: Advances in multi robot systems,”
IEEE Transactions on Robotics and Automation, vol. 18, 2002, pp. 655-661.
[3] M. Jager and B. Nebel, “Decentralized collision avoidance, deadlock detection, and deadlock resolution for multiple mobile robots,”
Proceedings 2001 IEEE/RSJ International Conference on Intelligent Robots and Systems. Expanding the Societal Role of Robotics in the the Next Millennium (Cat. No.01CH37180), pp. 1213-1219.
[4] X.-lin Long, J.-ping Jiang, and K. Xiang, “Towards Multirobot Communication,” 2004 IEEE International Conference on Robotics and Biomimetics, 2004, pp. 307-312.
[5] Z. Wang, L. Liu, and M. Zhou, “Protocols and Applications of Ad-hoc Robot Wireless Communication Networks : An Overview,”
International Journal, vol. 10, 2005, pp. 296-303.
[6] H. Yanco and L.A. Stein, “An Adaptive Communication Protocol for Cooperating Mobile Robots,” Technology, 1991.
[7] F. Arvin, K. Samsudin, and A.R. Ramli, “A Short-Range Infrared Communication for Swarm Mobile Robots,” 2009 International Conference on Signal Processing Systems, 2009, pp. 454-458. [8] P. Karimian, R. Vaughan, and S. Brown, “Sounds Good: Simulation
and Evaluation of Audio Communication for Multi-Robot Exploration,” 2006 IEEE/RSJ International Conference on Intelligent Robots and Systems, Oct. 2006, pp. 2711-2716.
[9] H. Yanco, “Towards an Adaptable Robot Language 2 Robots that learn a two signal language 1 Introduction,” Technology, vol. 02139, 1991.
[10] R. Rocha, J. Dias, and a Carvalho, “Cooperative Multi-Robot Systems A study of Vision-based 3-D Mapping using Information Theory,” Proceedings of the 2005 IEEE International Conference on Robotics and Automation, 2005, pp. 384-389.
[11] J.Z. Gao, L. Prakash, and R. Jagatesan, “Understanding 2D-BarCode Technology and Applications in M-Commerce - Design and Implementation of A 2D Barcode Processing Solution,” 31st Annual International Computer Software and Applications Conference - Vol. 2 - (COMPSAC 2007), Jul. 2007, pp. 49-56.
[12] Y.H. Chang, C.-hua Chu, and M.S. Chen, “A General Scheme for Extracting QR Code from a non-uniform background in Camera Phones and Applications,” Ninth IEEE International Symposium on Multimedia, 2007. ISM 2007, 2007, p. 123–130.