Please cite this article as: A. Kumar, A. Biswas, Techno-economic Optimization of a Stand-alone Photovoltaic-battery Renewable Energy System for Low Load Factor Situation- a Comparison between Optimization Algorithms, International Journal of Engineering (IJE), TRANSACTIONS A: Basics Vol. 30, No. 10, (October 2017) 1555-1564
International Journal of Engineering
J o u r n a l H o m e p a g e : w w w . i j e . i rTechno-economic Optimization of a Stand-alone Photovoltaic-battery Renewable
Energy System for Low Load Factor Situation- a Comparison between Optimization
Algorithms
A. Kumar, A. Biswas*
Department of Mechanical Engineering, National Institute of Technology Silchar, Silchar, India
P A P E R I N F O
Paper history:
Received 12 September 2016 Received in revised form 22 May 2017 Accepted 07 July 2017
Keywords:
Photovoltaic Renewable Energy System Levelized Cost of Energy
Reliability
Meta-heuristic Algorithms Cost Optimization Load Factor Autonomy Days
A B S T R A C T
For remote places having less-strong wind, single resources based renewable energy system (RES) with battery storage can sustainably and economically generate electrical energy. There is hardly any literature on optimal sizing of such RES for very low load demand situation. The objective of this study is to techno-economically optimize the system design of a Photovoltaic (PV)-battery storage RES for an institutional academic block in Silchar, India having maximum demand less than only 30 kW. The sizing process of various subsystems of the RES is first discussed. Then the RES is techno-economically optimized under 100% reliability to power supply condition, i.e. 0% unmeet energy (UE) and least excess energy. In this, performances of three different optimization algorithms- genetic algorithm (GA) and two meta-heuristics, namely Firefly Algorithm (FA) and Grey Wolf Optimizer (GWO) algorithms are investigated and compared. The optimal configuration under least levelized cost of energy (COE) is further examined. Results demonstrate that GWO is the best optimization tool for optimizing the cost of energy (COE) in comparison with the other optimization algorithms. It has been shown that a single optimization method might not always guarantee that the objective function has converged successfully in fulfilling all the requirements of least excess energy, autonomy days, and least COE. The present research provides a useful reference for the design optimization of single resource based RES for low load demand situation.
doi: 10.5829/ije.2017.30.10a.17
1. INTRODUCTION1
In most of the remote villages and islands around the world, the access to electricity is still a distant dream, which creates a huge barrier in the development of these regions. Hence, a stand-alone renewable power system is considered to be a feasible solution for providing electricity in the absence of utility grid. The system sizing and optimization of hybrid solar-wind systems for stand-alone power generation have been studied substantially over last few decades [1-11]. Borowy and Salameh [1] did work on the optimal sizing of photovoltaic array in hybrid mode with wind generator system and obtained promising performance of such hybrid system for standalone application. Bagul et al. [2] performed sizing of a stand-alone hybrid wind
*Corresponding Author’s Email: [email protected] (A. Biswas)
power system. Ma et al. [8] studied the technical feasibility of a standalone hybrid solar-wind system with pumped hydro storage for a remote island in Hong Kong. In this, the system was designed for a fixed user load condition. Again, Ma et al. [9] made a feasibility study and economic analysis of pumped hydro storage and battery storage for a renewable energy powered island. Ma et al. [10] investigated the performance of PHS in integration with solar-wind system, which have been optimized using GA for renewable energy power supply to a small island; but the optimum solution resulted in a large upper reservoir capacity that needs to be accommodated. Ma et al. [11] made another extensive study in hybrid renewable energy system with detailed feasibility study of a stand-alone hybrid solar– wind–battery system for a remote island. However, only solar PV based RES with feasible energy storage for very low load situation has not been studied much in the available literature. The availability of renewable resources for power generation in different parts of the world is not the same. For example North-East region of India has less-strong wind for power generation [12], whereas annual average solar insolation received in this part is sufficient for PV power generation [13]. This paper addresses the system sizing of PV-battery storage Renewable Energy System (RES) for a place named Silchar in North-East India. Further, the purpose of this study is to techno-economically optimize this RES to be used in an institutional academic block with low load demand situation having a maximum load of few kilo-Watts only.
A feasible energy storage unit for standalone PV based RES is very much essential due to the intermittent, unpredictable and stochastic nature of solar energy. Out of many energy storage technologies, the two most popular energy storages that have widely been studied for renewable energy integration are battery and pumped hydro storage (PHS) [7-10]. Ma et al. [8-11] have done extensive work related to hybrid solar-wind systems with detailed studies on the feasibility and economic prospects of pumped hydro storage. In the literature [8], it is reported that PHS based hybrid system is an ideal solution to achieve 100% energy autonomy in remote places. In the literature [9], it is further reported that economic benefit of PHS is high if some adjustments like increasing energy storage capacity of the PHS is possible. However, not always that the optimization of hybrid system for remote electrification would give the best feasible energy storage (say PHS). Forexample, techno-economic optimization of PV/PHS renewable energy system has although reduced the optimal cost of energy, but also has resulted in a large upper reservoir storage unit (13,205 m3 at height of 60m), which might not be always feasible in all places especially for small building electrification [14]. The same concern was also
reflected in the study [15], which reports that the viability of PHS in stand-alone application is best realized if power generation capacity of the RES is up to or below 300 kW. On the other hand, rechargeable lead-acid batteries, particularly those with deep discharge rate and high cycling stability, are more commonly employed in stand-alone RES due to simplicity and high load stability nature [16-21]. Such storage system will be more viable since the problem of sizing the battery storage is not that critical like PHS, especially for low load demand situation. However, from the available literature, it is seen that there is hardly any work on the optimum design of PV-Battery storage RES for low load demand situation. Keeping this in view, the present work is carried out.
In the techno-economic study, it is not always possible that any single optimization tool will minimize or maximize the objective function as per the requirements in all aspects. For example, in [14], although the levelized cost of energy was successfully optimized using Genetic Algorithm (GA), the resulting upper reservoir capacity became quite huge. Optimization techniques like GA, Grey Wolf Optimizer (GWO), Firefly Algorithm (FA), etc. [22-25] are based on physical phenomena that can be observed in the nature. And if the laws of nature and living beings are technically implemented in designing real-life systems, then it would lead to better solution as needed, say 100% reliability, less excess energy, more autonomy days, COE, and improved load factor, etc. Although lead-acid batteries have high initial investment for large capacity systems [26-29] and those in the scale of few hundred kW [8, 10], studies on their optimal sizing for low load demand situation with a maximum load of few kilowatts only are scarce. Moreover, comparison of the performances of various optimization tools for improving the design of RES is also scarce.
component sizing and modeling. After that, the system performances are simulated and techno-economically optimized under 100% reliability condition by using single objective optimization in terms of their life cycle cost (LCC) and cost of energy (COE). The optimal configuration under least levelized cost of energy (COE) is further examined and at the end conclusions have been drawn.
2. DESIGN OF SUBSYSTEMS OF THE RES
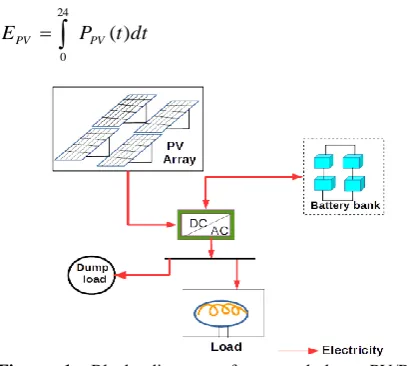
The physical model and working principle of PV/Battery system can be understood from Figure 1. The main components of the system include PV array, Battery bank, DC-AC Converter and AC-Load. The PV energy production first fulfils the load demand after that surplus energy goes to the Battery bank. The stored energy is dispatched when the PV power production falls below the local load demand. A small dump load is also connected for taking care of excess energy.
3. MODELING AND SIZING OF THE RES SYSTEM
The mathematical equations for individual components of the renewable energy system are proposed in this section. An hour by hour simulation program is then developed to size the PV panel, and the Battery bank.
3. 1. PV Array Modeling The power output from a PV panel is given by Equation (1):
o PV PV PV G t G Y N t
P () () (1)
Therefore, the energy produced in a whole day is given in Equation (2):
dt t P
EPV PV( )
24
0
(2)
Figure 1. Block diagram of a stand-alone PV/Battery renewable energy system
where PPV(t) is the net power output from PV panel
(kW),
N
PV is the rated capacity of PV panel (kW),Y
PV is the PV derating factor, accounting for the factors as aging, soiling, wiring losses, shading, and so on, G(t) is global solar insolation at any time ‘t’(kW/m2).3. 2. Battery Bank Modeling The capacity of battery storage in ampere hour (𝐶𝐴ℎ) is determined by
Equation (3): Bat eff b Load day Ah V DOD E n C _ ) 1 ( (3) where day
n is number of autonomous days powered by the battery storage, ELoad the daily energy consumption,
Bat
V rated battery voltage, DOD allowable depth of discharge,
eff b_
overall efficiency of battery, and
the portion of power that goes from PV to the load. Charging and discharging current of battery are defined in Equations (4) and (5) as:1000 ) ( ) ( ) ( _ Bat eff b eff PV i V t Load t P t C
(4)
1000 ) ( ) ( ) ( Bat PV eff i V t P t Load t
D (5)
Therefore, the net charge in battery is given by:
dt t D dt t C t C t C i t t i t t Ah
Ah() ( 1)(1 ) () ()
1 1
(6)
where eff is efficiency of inverter, b_eff efficiency of battery,
coefficient of self-discharge,Ah
C capacity of battery in Ah and VBat nominal voltage of battery.
The generalize energy balance model of the solar power generation system at time t is expressed as:
) ( ) ( ) ( )
(t . P t P . t P t
PPV inv L Bat Dump (7)
where inv. is the inverter efficiency which is the ratio of the inverter’s AC output power to DC input power,
) (t
PL the solar system power output directly delivered
to the load, PBat.(t) the power transferred to the battery
bank and P (t)
Dump the excess energy.
4. COST ANALYSIS
RC M O CC
LCC & (8)
The annual real interest rate is the discount rate used to convert between one-time costs and annualized costs. It is related to the nominal interest rate. CRF is capital recovery factor which is defined as in Equation (9) [30].
1 ) 1 (
) 1 (
n n
i i i
CRF
f f i i
1 '
(9)
So, the total Annualized Life Cycle Cost (ALCC) is defined in Equation (10).
CRF LCC
ALCC (10)
The levelized cost of energy (COE) is considered as a principal cost of economics for figuring out the merit of the all the systems. It is a ratio of the annualize life cycle cost of the system to the daily energy demand. In other words, it is the cost per unit electricity generated.
Load E ALCC
COE (11)
All constant parameters and cost of units are provided in Tables 1 and 2, respectively.
TABLE 1.A summary of constant parameters
Parameter Value
Battery efficiency ( eff b_
) 85%
Inverter efficiency ( eff
) 85%
Derating factor ( PV
Y 85%
Nominal interest (
i
' ) 7%Annual interest ( f ) 4%
Life of project (n) 25year
Coefficient of self-discharge () 0.002 Days of autonomy (
day
n ) 1 day
Area of PV module (m2) 0.9991.4
TABLE 2. A summary of cost and lifecycle of system’s major components
Component Unit Capital Cost ($)
Life cycle (Year)
Replacement cost ($ )
O & M cost $/kW-year % of capital cost
PV panel
(200 Wp) 300 25 200 0.2%
Battery 200
Ah/12V 65 3-4 65 0%
Inverter 900/kW 15 900 0.5%
5. OPTIMIZATION ALGORITHMS
In this work, for finding out the least possible value of COE, three well-known optimization algorithms, namely Genetic algorithm (GA), firefly algorithm (FA), and Grey wolf optimizer (GWO) have been applied simultaneously. The reason for more than one algorithm has already been explained in the introduction section.
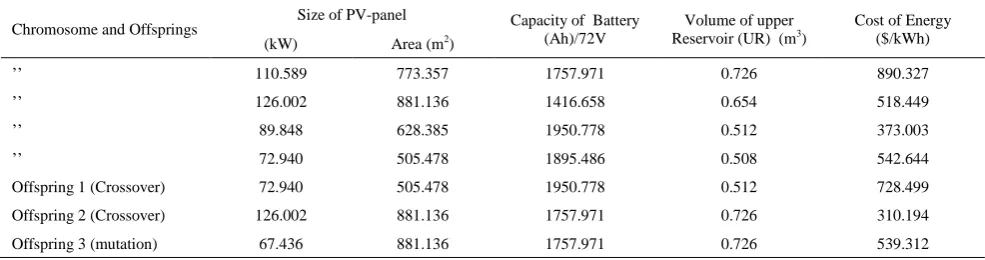
5. 1. Heuristic Approach Genetic algorithms are categorized as global search heuristics approaches. Basically the GA optimization is inspired by natural evolution, such as inheritance, mutation, selection, and cross over [20, 22]. In GA, the evolution usually starts from a population of randomly generated individuals that continues in generations. In each generation, the fitness of every individual of the population is evaluated, then multiple individuals are selected from the current population (based on their fitness function), and they are modified (recombined and possibly mutated) to form new population/generation. The new generation is then used in the next iteration of the algorithm. Commonly, the algorithm terminates when either a maximum number of generations has been performed, or a satisfactory fitness level has been reached. An initial individual chromosome is as shown in Table 3. It consists of four real numbers in the string in the order of capacity of PV panel (kW), area of panels (m2), capacity of battery bank (Ah), and volume of upper reservoir (m3). A few of the crossover and mutation operations resulting in varied cost of energy ($/kWh) are also shown in the same Table 3.
TABLE 3. Initial chromosome along with crossover and mutation operations
Chromosome and Offsprings Size of PV-panel Capacity of Battery (Ah)/72V
Volume of upper Reservoir (UR) (m3)
Cost of Energy ($/kWh) (kW) Area (m2)
’’ 110.589 773.357 1757.971 0.726 890.327
’’ 126.002 881.136 1416.658 0.654 518.449
’’ 89.848 628.385 1950.778 0.512 373.003
’’ 72.940 505.478 1895.486 0.508 542.644
Offspring 1 (Crossover) 72.940 505.478 1950.778 0.512 728.499
Offspring 2 (Crossover) 126.002 881.136 1757.971 0.726 310.194
5. 2. Meta Heuristic Approach Meta-heuristic optimization approaches have been widely used and these have become very popular over the last two decades because of their simplicity, flexibility, and derivation-free mechanism.
5. 2. 1. Firefly Algorithm and Flow chart
Firefly algorithm (FA) is a meta-heuristic and nature-inspired algorithm, developed by Yang in late 2007-2008 [31], which is based on the flashing pattern and behaviour of fireflies. Three flashing idealizing characteristics of fireflies to develop firefly inspired algorithm are: Fireflies are in same gender, so that one firefly will
be attracted to other fireflies regardless of their gender.
Its attractiveness is proportional to the brightness, and they both decrease as their distance increases. The firefly’s brightness is determined by the
landscape of the objective function.
The attractiveness of fireflies is directly proportional to intensity of light, i.e. the variation of attractiveness of
'
' with distance of ‘r’, which is given by Equation (12): 2
r oe
(12)
where o (attractiveness) at r = 0 and
is absorption coefficient. The summary of this algorithm is given in [32].5. 2. 2. Grey Wolf Optimizer and Flowchart
The Grey Wolf Optimizer (GWO) is the latest and most popular meta-heuristic algorithm developed by Mirjalili et al. [25] in 2014, which is inspired from the grey wolves in nature. The wolves have been categorized in four types such as alpha (); “The leaders of the group”; beta (), “The subordinate wolves that help the leaders”; delta (
), “The third level wolves who submit to and ” and omega (), “The lowest ranker wolves of group who have surrendered to all the other governing wolves”. And these four are employed for simulating the leadership hierarchy. These use three main steps of hunting: at first searching for prey (exploration), then encircling prey, and finally attacking the prey (exploitation). The encircling modeling behaviour of wolves at current iteration ‘t’, at XP
position vector of prey and with X position vector of wolf is given as Equation (13) [25].
a r a
A 2 1
) ( ) (t X t X
C
D P
X AD
t
X( 1) P ,
2r2
C
(13)
where A and C are coefficients of the position
vector, a linearly deceased vector from 2 to 0 over the maximum iterations, and r1 and
2
r are the random vectors in the range of [0,1]. Here, alpha '' is taken as the best fittest solution of the objective function, beta
'
' and delta '
' are taken consequently second and third best solutions, and rest of all the solutions are taken as'
'
. The summary of this algorithm is given in [32].5. 3. Optimization Strategy In the Single-objective optimization, the main Single-objective is to minimize the value of COE. Three optimization techniques such as GA, GWO and FA have been used to find out the least possible value of cost as it cannot be concluded by using a single optimization method. The levelized cost of energy (COE) is taken as the fitness function without any type of power failure, i.e. in 100% reliability of power supply to the load. The fitness function for all the three proposed configurations is shown in Equation (14).
) ( min
_ f COE
Z (14)
% 0
UE is taken as the subject to constrain. The lower and upper boundary of NPV,CAh and VUR are given as per below:
200
0NPV ;0CAh 8000;0VUR5000 (15) Where NPV = capacity of PV panel (kW), Ah = capacity of battery (Ah), VUR = upper reservoir volume (m3). The above objective function has one indirect constraint (i.e. UE%). Hence, in optimization-tool box of GA, the following have been considered:
The constraints box remains empty.
In the population box, “Feasible population” is selected.
The “Stochastic uniform” is selected in selction function box.
0.05*population size default function is chosen for reproduction function box. And cross-over fraction is 0.8 as default value.
In the Mutation function box “Adaptive feasible” is selected.
The “Heuristic function” is chosen for cross-over function with default ratio of 1.2.
Then, the “Forward direction of migration” is used. Finally, the number of generations is selected as
“200” for all the three systems
Similarly, for firefly algorithm (FA) the following parameters have been used:
Number of searching agent (fireflies) / population = 20.
Number of variables for the RES is two (i.e. PV and Bat.)
Set the lower bound [Lb] and upper bound [Ub] of variables.
For the GWO algorithm the following parameters have been used:-
The number of searching agents
(wolves)/population = 20.
The maximum number iteration/generations = 300 Number of variables for the RES is two
Some default constants for alpha (), beta (
), and gamma (
) are 0.5, 0.2 and 0.1 respectively. Set the lower bound [lb] and upper bound [ub] ofvariables.
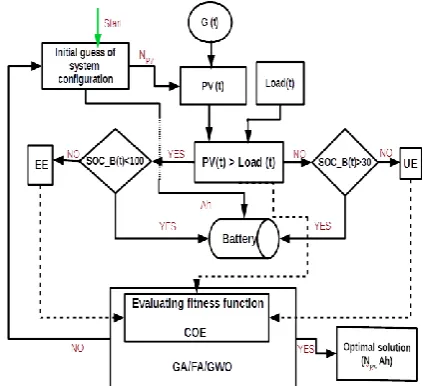
The system optimization process flow chart for the PV/Bat. RES is illustrated in Figure 4. The optimization process starts with the random guess value of the system variables (like size of PV modules, size of battery capacity), then consequently runs through all the steps of the algorithms, and continues until achieves stop categories or reaches max-iteration/ max-generations.
Here, state of the charge (SOC) of battery is taken between 30% to 100% as shown in Figure 2.
5. 4. System Reliability Model In this study, the system reliability is evaluated based on the percentage of unmet energy (UE) per year, which is defined as the total power supply failure divided by the total energy demand over a year [8]. The reliability study is done to evaluate whether a system is able to fulfill the load demand, and if there is any deficiency, then to calculate the percentage of insufficient energy. Another most important index which is widely used is percentage of excess energy (EE) in a year. The index UE and EE are calculated as follows in Equations (16) and (17), respectively. The objective here is to have 100% reliability , i.e. 0% UE and least EE.
100 )] ( ) ( [ ) ( (%)
8760
1
Load Turbine L
TL
E
t P t P t P
UE (16)
100 ) (
) ( (%) 8760
1 8760
1
t P
t P EE
PV Dump
(17)
6. THE CASE STUDY
The proposed RES system is employed in an institutional academic block with low load demand situation, which is situated in Silchar, Assam, India. This academic block is a 4-storey building, which consists of large rooms for laboratories and faculty cabins.
Figure 2.Flow chart of optimization for PV/Bat RES
A survey for the electricity consumption of the building was conducted for collecting all these load data. Figures 3(a) and (b) show the hourly variation of load for the building for winter and summer, respectively. As can be seen from these figures, the load factor of both seasons is very low (around 0.131). The load factor is defined as the ratio of the average load to the peak load. Also, the daily average energy consumed is only 88.7 kWh.
7. RESULTS AND DISCUSSION
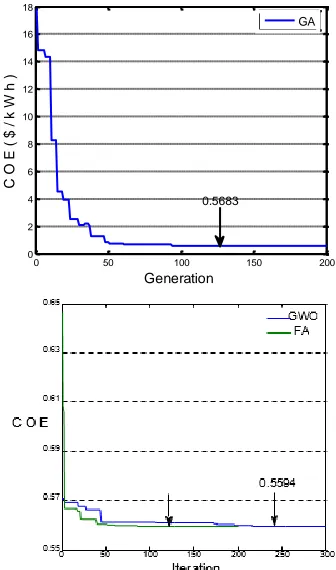
Under the single objective COE function (i.e. zero unmet energy), the convergent graphs for GA, GWO and FA are shown in Figure 4. It can be observed that among all the approaches, GWO technique gives the lowest COE of $ 0.5594/kWh. The fitness function for GWO and FA has converged at 300 iterations, whereas the GA has converged at 200 generations.It can further be observed that starting initial guess value for GA is very far away from its final minimized value. On the other hand, for both GWO and FA, fitness functions are more quickly converged compared to that of GA, and their initial guess value is not far away. According to GWO, it has been obtained that the optimal configuration is: PV (142 kWp, 712 pieces of module and module area 995.633 m2), battery size (6328.70 Ah of 72V), size of inverter (28.5kW) and the corresponding LCC and COE are $305,408 and $0.5594/kWh, respectively.
0 2 4 6 8 10 12 14 16 18 20 22 0
4 8 12 16 20 24 28
L
o
a
d
(kW
)
Hours Weekday
weekend
Figure 3. Daily electricity demand variation for the winter (top) and summer (bottom)
Figure 4. Converged curve of COE during GA (top) and GWO/FA(bottom)
On the other hand, the battery and the inverter have shares of 22% ($ 66,125) and 8% ($ 25,813) of the total LCC, respectively. Table 4 shows the results of the optimization algorithms.
7. 2. Hourly Energy Balance Simulation The simulation analysis has been done for 1 year period i.e. for 8760 hrs. In Figure 6, the hourly simulation curve for the optimized PV/Bat system of a sample day has been demonstrated. In this plot six parameter such as PV power, Load demand, Discharging current (Di), Charging current (Ci), EE and Capacity of charge (Ah) are varied with respect to time. It can be noted that no excess energy has generated over the day and also no loss of power supply has occurred meaning unmet energy is zero.
The simulated plot illustrates that the PV array produces electricity and serve the load from 6:00 hrs to 17:00 hrs, and the surplus electricity after meeting the load goes to battery and hence battery gets charged.
Figure 5. Break-down of LCC for the RE
TABLE 4. Results of the various optimization algorithms
PV/Battery ($/kWh) Cost Energy (%) Excess PV (kW) Bat (Ah)
GA 0.5683 36.42 156.901 4611.7
FA 0.5611 34.18 142.398 6388.5
GWO 0.5594 32.19 142.312 6328.7
Figure 6. Hourly energy balance curve on a sample day
0 50 100 150 200
0 2 4 6 8 10 12 14 16 18
Generation
C
O
E
(
$
/
k
W
h
)
GA
0.5683
PV 70% Battery
22%
During 14:00 -16:00 hrs, the load has been balanced by the PV and battery bank, both simultaneously. In this sample day, the maximum state of charge (SOC) of battery has occurred at 13:00 hrs, i.e. 5664.357Ah (89.50%) and minimum SOC at 23:00 hrs i.e. 3765.917 Ah (59.51%). From the same plot, it can also be noted that the maximum charging current (Ci) occurs during the low load demand and high PV power generation, which is at 12:00 hrs with 311.84573 Ah of charging current, and maximum discharging current occurs at 16:00 hr, which is 263.36088Ah. The net energy production from the PV array for the entire year is 190,510 kWh, whereas its peak power output is 127.6751kW. The results demonstrate that the PV system along with battery storage have effectively balanced the load demand of this building. The intermittent nature of solar energy is very well compensated by the battery storage system.
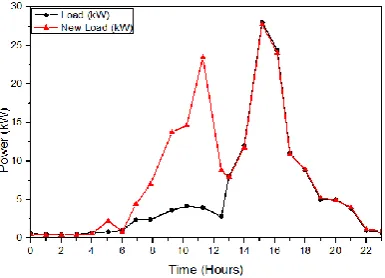
Figure 7 shows the comparison between the new load profile as generated by the optimal solution and the actual load profile of the building for a single day. Here, in the first part (day-time) the energy is stored in battery bank in the form of electro-chemical energy and then this stored energy is dispatched during night time to fulfill the load requirement of the end user. The load factor of new load profile of RES system is 0.267, whereas actual load factor of the building is 0.131. Therefore, the load factor has also improved by 0.136.
Figure 8 shows that the battery’s SOC distribution frequency is from 30% to 100% for the entire year. The results indicate that the maximum percentage of relative frequency (about 44.828%) of its SOC values lie for 90% to 100% of SOC, which means there must have some excess energy which goes to the dump load. In this configuration, 32.19% (61,320kWh) of excess energy has generated because of very low load factor and size of battery bank being not enough to store this energy. Consequently, 29.83% and 20.19% of relative frequency has occurred for the 80% - 90% and 70% - 80% of SOC, respectively.
Figure7. The new load and actual load profile
Figure 8. The relative frequency vs. battery’s SOC
About 0.41% of relative frequency for 30% to 40% of SOC has occurred because of the zero unmet energy.
8. CONCLUSIONS
In this paper techno-economic optimization of a stand-alone PV-Battery Renewable Energy system for low load demand situation has been performed using three different optimization algorithms. From this study the following conclusions can be drawn:
For achieving 0% UE with least excess energy, the simulation through GWO is found to be the best in terms of optimizing the cost of energy (COE) as compared to other algorithms. And the best optimal and economical system in this case is PV/Bat RES, for which COE is $ 0.5595, with PV array capacity 142 kW (712 pieces of module and module area 995.633 m2) and battery bank capacity 6328.700Ah of 72 V, inverter size 28.5kW, and the corresponding LCC and COE are $305,408 and $ 0.5594/kWh, respectively.
Considering the high capital cost of UR, for small autonomy of days with 0% UE, the present RES PV/Bat can be an effective solution for low load factor application.
The load factors of the new load profiles generated by the optimal solution is 0.267 for the present RES, which is more than the existing value of the building. Hence, the optimal solution has improved the load factor of the academic block by 0.136.
the laws of nature, of living beings, are implemented in designing of real-life systems, then it would lead to better solutions as per the requirements of low excess energy, least unmet energy, low COE, and improved load factor. The present research could encourage future researchers to compare various optimization algorithms for improving the design of RES with different low load demand situations.
7. REFERENCES
1. Borowy, B.S. and Salameh, Z.M., "Optimum photovoltaic array size for a hybrid wind/pv system", IEEE Transactions on Energy Conversion, Vol. 9, No. 3, (1994), 482-488.
2. Bagul, A., Salameh, Z.M. and Borowy, B., "Sizing of a stand-alone hybrid wind-photovoltaic system using a three-event probability density approximation", Solar Energy, Vol. 56, No. 4, (1996), 323-335.
3. Diaf, S., Diaf, D., Belhamel, M., Haddadi, M. and Louche, A., "A methodology for optimal sizing of autonomous hybrid pv/wind system", Energy Policy, Vol. 35, No. 11, (2007), 5708-5718.
4. Bernal-Agustín, J.L. and Dufo-Lopez, R., "Simulation and optimization of stand-alone hybrid renewable energy systems",
Renewable and Sustainable Energy Reviews, Vol. 13, No. 8, (2009), 2111-2118.
5. Zhou, W., Lou, C., Li, Z., Lu, L. and Yang, H., "Current status of research on optimum sizing of stand-alone hybrid solar-wind power generation systems", Applied Energy, Vol. 87, (2010), 380-389.
6. Dali, M., Belhadj, J. and Roboam, X., "Hybrid solar–wind system with battery storage operating in grid-connected and standalone mode: Control and energy management–experimental investigation", Energy, Vol. 35, No. 6, (2010), 2587-2595. 7. Yan, R. and Yanpin, L., "Simulation and optimization of hybrid
wind-solar-pumped-storage power system", in Electric Information and Control Engineering (ICEICE), International Conference on, IEEE., (2011), 729-733.
8. Ma, T., Yang, H., Lu, L. and Peng, J., "Technical feasibility study on a standalone hybrid solar-wind system with pumped hydro storage for a remote island in hong kong", Renewable Energy, Vol. 69, (2014), 7-15.
9. Ma, T., Yang, H. and Lu, L., "Feasibility study and economic analysis of pumped hydro storage and battery storage for a renewable energy powered island", Energy Conversion and Management, Vol. 79, (2014), 387-397.
10. Ma, T., Yang, H., Lu, L. and Peng, J., "Optimal design of an autonomous solar–wind-pumped storage power supply system",
Applied Energy, Vol. 160, (2015), 728-736.
11. Ma, T., Yang, H. and Lu, L., "A feasibility study of a stand-alone hybrid solar–wind–battery system for a remote island",
Applied Energy, Vol. 121, (2014), 149-158.
12. Gupta, R. and Biswas, A., "Wind data analysis of silchar (assam, india) by rayleighs and weibull methods", Journal of Mechanical Engineering Research, Vol. 2, No. 1, (2010), 010-024.
13. Gangwar, S., Bhanja, D. and Biswas, A., "Cost, reliability, and sensitivity of a stand-alone hybrid renewable energy system—a case study on a lecture building with low load factor", Journal of Renewable and Sustainable Energy, Vol. 7, No. 1, (2015), 013109-013117.
14. Ma, T., Yang, H., Lu, L. and Peng, J., "Pumped storage-based standalone photovoltaic power generation system: Modeling and techno-economic optimization", Applied Energy, Vol. 137, (2015), 649-659.
15. Crettenand, N., "Small storage and pumped storage plants in switzerland", International Water Power & Dam Construction, Vol. 64, No. EPFL-ARTICLE-177880, (2012), 22-24.
16. Nair, N.-K.C. and Garimella, N., "Battery energy storage systems: Assessment for small-scale renewable energy integration", Energy and Buildings, Vol. 42, No. 11, (2010), 2124-2130.
17. Mahmoud, M.M., "On the storage batteries used in solar electric power systems and development of an algorithm for determining their ampere–hour capacity", Electric Power Systems Research, Vol. 71, No. 1, (2004), 85-89.
18. Hoppmann, J., Volland, J., Schmidt, T.S. and Hoffmann, V.H., "The economic viability of battery storage for residential solar photovoltaic systems–a review and a simulation model",
Renewable and Sustainable Energy Reviews, Vol. 39, (2014), 1101-1118.
19. Dagdougui, H., Minciardi, R., Ouammi, A., Robba, M. and Sacile, R., "Modeling and optimization of a hybrid system for the energy supply of a “green” building", Energy Conversion and Management, Vol. 64, (2012), 351-363.
20. Zhao, J., Wang, C., Zhao, B., Lin, F., Zhou, Q. and Wang, Y., "A review of active management for distribution networks: Current status and future development trends", Electric Power Components and Systems, Vol. 42, No. 3-4, (2014), 280-293. 21. Shaahid, S. and Elhadidy, M., "Technical and economic
assessment of grid-independent hybrid photovoltaic–diesel– battery power systems for commercial loads in desert environments", Renewable and Sustainable Energy Reviews, Vol. 11, No. 8, (2007), 1794-1810.
22. Melanie, M., "An introduction to genetic algorithms",
Cambridge, Massachusetts London, England, Fifth printing, Vol. 3, (1999), 62-75.
23. Malhotra, R., Singh, N. and Singh, Y., "Genetic algorithms: Concepts, design for optimization of process controllers",
Computer and Information Science, Vol. 4, No. 2, (2011), 39-46.
24. Xing, B. and Gao, W.-J., "Innovative computational intelligence: A rough guide to 134 clever algorithms, Springer, (2014).
25. Mirjalili, S., Mirjalili, S.M. and Lewis, A., "Grey wolf optimizer", Advances in Engineering Software, Vol. 69, (2014), 46-61.
26. Gustavsson, M. and Mtonga, D., "Lead-acid battery capacity in solar home systems—field tests and experiences in lundazi, zambia", Solar energy, Vol. 79, No. 5, (2005), 551-558.
27. Krieger, E.M., Cannarella, J. and Arnold, C.B., "A comparison of lead-acid and lithium-based battery behavior and capacity fade in off-grid renewable charging applications", Energy, Vol. 60, (2013), 492-500.
28. Hadjipaschalis, I., Poullikkas, A. and Efthimiou, V., "Overview of current and future energy storage technologies for electric power applications", Renewable and Sustainable Energy Reviews, Vol. 13, No. 6, (2009), 1513-1522.
29. Baker, J., "New technology and possible advances in energy storage", Energy Policy, Vol. 36, No. 12, (2008), 4368-4373. 30. Kaldellis, J., Kapsali, M., Kondili, E. and Zafirakis, D., "Design
31. Yang, X.-S., "Firefly algorithm, stochastic test functions and design optimisation", International Journal of Bio-Inspired Computation, Vol. 2, No. 2, (2010), 78-84.
32. Biswas, A. and Kumar, A., "Techno-economic optimization of a stand-alone pv/phs/battery systems for very low load situation",
International Journal of Renewable Energy Research (IJRER), Vol. 7, No. 2, (2017), 844-856.
Techno-economic Optimization of a Stand-alone Photovoltaic-battery Renewable
Energy System for Low Load Factor Situation- a Comparison between Optimization
Algorithms
A. Kumar, A. Biswas
Department of Mechanical Engineering, National Institute of Technology Silchar, Silchar, India
P A P E R I N F O
Paper history:
Received 12 September 2016 Received in revised form 22 May 2017 Accepted 07 July 2017
Keywords:
Photovoltaic Renewable Energy System Levelized Cost of Energy
Reliability
Meta-heuristic Algorithms Cost Optimization Load Factor Autonomy Days
ديكچ ه
ناکم یارب اب رود یاه فیعض یاهداب
هریخذ عبانم اب ریذپ دیدجت یژرنا متسیس ،رت یم ،یرتاب ی
و رادیاپ یژرنا ناوت
هقباس چیه ًابیرقت .درک دیلوت یداصتقا متسیس نینچ بولطم یریگ هزادنا یارب یشهوژپ ی
رایسب یاضاقت طیارش یارب ییاه
یس ینف یزاس هنیهب ،هعلاطم نیا زا فده .درادن دوجو عبانم رد مک ( کیئاتلووتف یزاس هریخذ عمتجم یحارط متس
PV
)
( راچلیس رد یهاگشناد یملع کولب کی یارب
Silchar
) زا رتمک یاضاقت رثکادح اب دنه 30
دروم رد ادتبا .تسا تاوولیک
متسیسریز یریگ هزادنا دنیارف هب ینف رظن زا ار نآ سپس و هدرک ثحب فلتخم یاه
100
٪
تیعضو یارب نانیمطا تیلباق
یم هنیهب ،یفاضا یژرنا لقادح و یژرنا ینعی ،یژرنا هریخذ لمع ،راک نیا رد .مینک
هنیهب متیروگلا هس درک فلتخم یزاس
( کیتنژ متیروگلا ینعی
GA
هناورپ متیروگلا ینعی ،یراکتباارف متیروگلآ ود و ) بش ی
بات
(FA)
هنیهب متیروگلا و گرگ زاس
یرتسکاخ
(GWO)
یم هسیاقم و یسررب هنیزه نیرتمک اب هنیهب یدنبرکیپ .دوش
( یژرنا ی
COE
یم یسررب رتشیب ) .دوش
یم ناشن جیاتن هک دهد
GWO
هنیزه یزاس هنیهب یارب رازبا نیرتهب متیروگلا ریاس اب هسیاقم رد یژرنا ی
هداد ناشن .تساه
هب یزاس هنیهب شور کی هک تسا هدش یمه تسا نکمم ییاهنت
ندروآرب رد تیقفوم اب فده عبات هک دنک نیمضت دناوتن هش
لقادح و لقتسم یاهزور یفاضا یژرنا لقادح تامازلا مامت
COE
مه یارب یدیفم عجرم رضاح شهوژپ .تسا هدش ارگ
هریخذ رب ینتبم ریذپ دیدجت یژرنا متسیس یزاس هنیهب یحارط یم تسد هب مک یاضاقت تیعضو یارب یزاس
.دهد