Triple Test Cross Analysis for Genetic Components of
Salinity Tolerance in Spring Wheat
S.A. Sadat Noori
1,*and A. Sokhansanj
21
Abouraihan Campus, Department of Agronomy and Plant Breeding, University of Tehran, P.O. Box 4117, Tehran, Islamic Republic of Iran
2
Department of Biology, Faculty of Sciences, University of Tehran, Tehran, Islamic Republic of Iran
Abstract
Soil salinity poses considerable and increasing problems for agriculture, and is
receiving much attention from plant breeders. The identification of genes whose
expression enables plants to adapt to and/or tolerate salt stress is essential for
breeding programs, but little is known about the genetic mechanisms of traits in
saline conditions. The data obtained from 75 families produced by crossing 25 F2
plants derived from a cross between two spring hexaploid wheats, namely Siete
Cerros (salt tolerant) and Axona (salt sensitive), to their parents and their F1
progenies, was subjected to triple test cross analysis. The genetic components
(epistasis, additive and dominance) and their interactions with the environment
(control - salinity) were detected for heading date, days to maturity, final plant
height, spike length, ear weight, straw weight, number of grains per ear, grain
yield per plant, 1000 grain weight, whole plant weight and harvest index. Epistasis
was presented only for days to maturity (‘j’ and ‘l’ types) and plant height (‘i’
type) at control and spike length (‘j’ and ‘l’ types) at salinity condition. Additive
component (D) was more important than dominance (H) especially in salinity
condition. Dominance ratio, (
H/D)
1/2, was less than unity in both environments and
heritability (h
2) decreased for all traits at salinity condition.
Keywords: Triple test cross; Heritability; Epistasis; Gene action; Salinity tolerance; Spring wheat
*
Introduction
Soil salinity poses considerable and increasing problems for agriculture, and is receiving much attention from plant breeders [10]. The problem is compounded by the relatively low salt tolerance of most crop plants, but it is a reasonable goal for plant breeding programs, because salt tolerance has been discovered in
some cultivated species, and is presented in their halophytic relatives [2]. The identification of genes whose expression enables plants to adapt to and/or tolerate salt stress is essential for breeding programs, but little is known about the genetic mechanisms for salt tolerance [3].
systems controlling the characters to be selected. The importance of epistasis in the expression of several agronomic traits has been reported in a number of instances [16,11]. Because of this, a study was carried out to test for the presence of epistasis, and to estimate additive and dominance components of genetic variation, and their interactions with environments (control, salinity treatment) by using the triple test cross design.
Materials and Methods
Experimental Design
The material for this study comprised of an F2
population derived from a cross between two cultivars of spring wheat, namely Siete Cerros (a salt tolerant wheat originally bred at CIMMYT) [1] and Axona (a British salt sensitive variety). The experimental material for triple test cross analysis was produced following the procedure outlined by Kearsey and Jinks [5]. In this case 25 plants from the F2 population of the above cross
(Siete Cerros × Axona) were selected randomly and used as female parents for crossing with their respective male testers (P1, P2 and F1) designated as L1, L2 and L3,
respectively. By this method therefore, L1i, L2i and L3i
families were produced from this cross. The seventy five families thus produced were raised in a randomized complete block design in two replicates under two (normal and stress) environmental conditions, each replicate consisting of one hundred and fifty experimental units (pots). All seeds were surface sterilized first in ethanol for one minute followed by 5% sodium hypochlorite solution for 6 minutes and finally washed three times with deionized water. The experiment was carried out in a glasshouse at day temperature 22±2ºC and night temperature 16±2ºC with natural daylight supplemented by 400 watt mercury vapour lamps to give a 16 h day length.
Plastic pots of 18-cm diameter and 19 cm deep were filled with 4.40 kg washed river sand. The sand was thoroughly washed with tap water for one week, followed by three washings with full strength nutrient solution of Hoagland.
Two salt (NaCl) concentrations were used, namely control, 0 mM NaCl, 1.37 dS m−1 and 150 mM, 17.21
dS m−1, in full strength nutrient solution. Seeds of each
family were grown separately and equidistantly from each other in each pot at a rate of five seedlings per pot. Because of the diversity in maturity time between the parental lines, intervals of one to two weeks were used between the planting dates. Salt treatments were commenced 18 days after the start of the experiment,
and the salt concentration was increased stepwise in aliquots of EC 5.0 dS m−1 every other day until the
appropriate treatment concentration was reached. Twice per week, 200 ml of distilled deionized water was added to each pot to maintain sand moisture, and to prevent salt accumulation. EC of the leachates was tested weekly.
At maturity the plants were harvested and measurements were recorded for the heading date, maturity date, final plant height (cm), spike length (cm), weight of ears (g), weight of straw (g), number of grains per spike, grain yield per plant (g), 1000 grain weight, whole plant dry weight (g), and harvest index (grain yield per plant / whole plant dry weight).
Statistical Analysis
Test of Eepistasis
Forthe test of epistasis, twenty-five values of Ei = L1i
+ L2i - 2L3i, for i = 1 to 25 were obtained from each of
the two replicates and were summed over the replicates. Variance of these twenty-five values is equal to epistasis variance with 25 degrees of freedom. The epistasis sum squares for 25 degrees of freedom was partitioned into an item with one degree of freedom, testing for ‘i’ type of epistasis (homozygote × homozygote interactions), and into an item with 24 degrees of freedom testing for ‘j’ and ‘l’ types of epistasis (homozygote × heterozygote and heterozygote × heterozygote respectively). Epistasis was estimated for control (0 mM NaCl) and salinity (150 mM NaCl) treatments separately. For the test of interaction between ‘i’ type of epistasis and treatment, and ‘j’ and ‘l’ types of epistasis and treatment, combined data were also calculated. The mean square of replicates × families was tested against mean square within families. If that was significant, mean square of replicates × families was used for testing the interactions and main effects. Otherwise the mean square of within families was used.
Test and Estimation of Additive and Dominance Components
Additive and dominance components were estimated, assuming no epistasis. These components were estimated for combined, control, and salinity experiments separately.
The 25 sum of means of the families (L1i + L2i + L3i)
created a variance of sums for 24 degrees of freedom. Similarly, the variance of differences (L1i-L2i) was
was used for the test of main and interaction effects. Otherwise, within-families error was used.
To test additive × treatment and dominance × treatment components, the combined analysis was also performed. The D (additive), H (dominance), dominance ratio, h2
n (narrow heritability) and h2b (broad
heritability) components for the traits were estimated as follows:
D: δ2
s (sums) = 1/8 D, H: δ2d (differences) = 1/8 H,
Dominance ratio: (H/D) 1/2, h2
n: 1/2D/ Total variation,
h2
b: 1/2D + 1/4 H/ Total variation
Results and Discussion
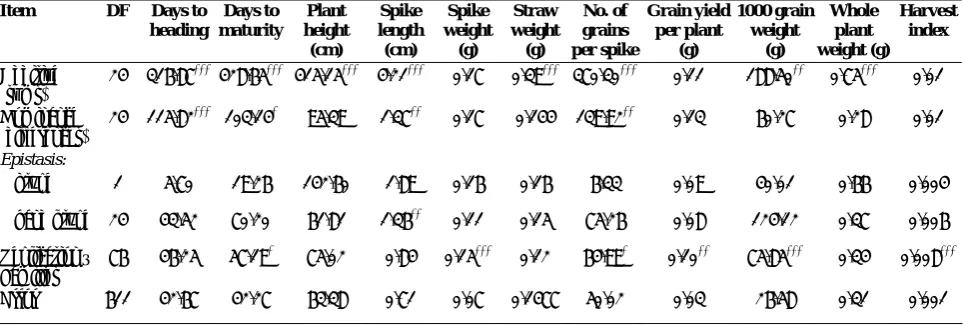
The analysis of variances for general effect of eleven characters is presented in Table 1. Genotypes differ significantly (P < 0.001) for all the traits measured except for spike weight (P < 0.01). Differences between concentrations were significant (P < 0.001) for all characters except days to heading. Interaction between genotypes × treatment were significant at P < 0.001 for number of grain per spike, grain yield per plant, 1000 grain weight and harvest index, at P < 0.01 for spike length and spike weight, and at P < 0.05 for days to maturity. Test for detection of presence of the epistasis (‘i’ and ‘j’ + ‘l’ types) and for estimation of additive and dominance components were carried out by analyses of variance in both control and salinity conditions separately (Tables 2 and 3, respectively), and for their interaction with treatment were calculated in combined condition (Table 4).
Additive and Dominance Component
It is clear from the results that both additive and dominance effects were responsible for spike length, days to maturity, and days to heading in both control and salinity conditions and number of grains per ear in the saline condition, and final plant height in the control condition. The additive component was also significant for 1000-grain weight, whole plant weight, straw weight, and final plant height when the plants were grown in the salinity condition. Additive effects also controlled grain number per spike, whole plant weight, and straw weight in the control condition. Estimates of both additive (D) and dominance (H) components were significant only for days to maturity in combined analysis, indicating that simple selection procedures will not be effective in achieving improvement in this character. The estimate of the additive component (D) was significant for heading date, final plant height, spike length, and days to maturity indicating exploitable additive gene action. Similar findings were reported for
final plant height, panicle length and days to maturity by Subbaraman and Ranagasamy [14] in rice, and may be similar in the other main cereal crops.
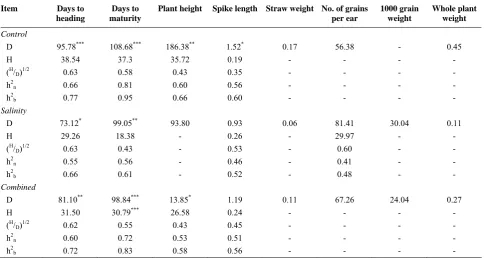
The additive (D) genetic action was greater than the dominance (H) effects for heading date, final plant height, spike length, and days to maturity (Table 5).
The estimates of additive and dominance genetic components for the characters above, with the exception of heading date, were biased to an unknown extent because of the presence of epistasis, and therefore no valid conclusion can be drawn about the relative importance of additive (D) and dominance (H) components in the governing of these traits [9]. Similar results indicating epistatic effects were reported by Singh and Dahiya [12] for final plant height and days to maturity from three triple test cross analyses using six wheat lines and obtaining data for ten agronomically important characters.
For heading date, the unbiased estimate of the additive component (D) was significant in all conditions indicating importance of this component in the inheritance of heading date. Improvement of this character could be achieved through standard selection procedure. Tripathi and Singh [15] have found similar results for heading date in barley while they tested one hundred and eighty triple test cross families arising from three barley crosses (six homosygous and genetically diverse varieties of barley Hordeum vulgare L.) which
were grown under saline-alkali conditions and exa-mining seven morphological characters. The dominance ratio was 0.35-0.63 at control and 0.43-0.63 at salinity and 0.43-0.62 in combined analysis indicating the high magnitude of the (D) component compared to the (H) component.
The heritability decreased in salinity condition for all traits indicating response to environment.
Epistasis Component
The results of the present study revealed the presence of epistasis for days to maturity, final plant height, and spike length. Further partitioning of the epistasis revealed that ‘i’ (additive × additive) type of epistasis was significant for final plant height, and ‘j’ and ‘l’ (additive × dominance and dominance × dominance) types of epistasis were significant for days to maturity, and spike length. These results are in agreement with Singh and Dahiya [12], again in wheat, for days to maturity, final plant height, and spike length. Singh and Singh [11] and Nanda et al. [7] also noted a significant
Table 1. Mean squares from analysis of variance for eleven metric traits for families derived from cross between Siete Cerros ×
Axona grown in two environments (control and 150 mM NaCl)
Source of variation
DF Days to
heading Days to maturity Plant height (cm) Spike length (cm) Spike weight (g) Straw weight (g) No. of grains per spike Grain yield per plant (g) 1000 grain weight (g) Whole plant weight (g) Harvest index Genotypes (G)
76 563.29*** 583.19*** 538.1*** 4.84*** 0.45** 1.45*** 272.49*** 0.32*** 160.42*** 2.52*** 0.02***
Concentration
(C) 1 4.14 2549.37
*** 63147.3*** 212.95*** 401.51*** 8.77*** 42312.4*** 275.57*** 34434.6*** 527.92*** 9.03***
G × C 76 50 55.89* 85.8 1.30** 0.47** 0.30 192.04*** 0.37*** 107.70*** 1.04 0.01***
Block 1 313.55** 1754.03*** 1867.4*** 0.60 9.04*** 0.22 272.07* 2.3377*** 109.01* 12.93*** 0.002
Error 1376 40.27 40.06 81.1 0.81 0.30 0.26 63.72 0.17 31.10 0.96 0.003
*** P < 0.001, ** P < 0.01, * P< 0.05
Table 2. Mean square from the analysis of variance to test for additive, dominance and epistasis components in triple test cross:
Siete Cerros × Axona for eleven metric traits in control condition (0 mM NaCl)
Item DF Days to
heading Days to maturity Plant height (cm) Spike length (cm) Spike weight (g) Straw weight (g) No. of grains per spike Grain yield per plant (g) 1000 grain weight (g) Whole plant weight (g) Harvest index Additive (sums)
24 397.48*** 439.30*** 795.67*** 6.58*** 0.88 1.04*** 352.26 0.60 200.75 3.30** 0.01
Dominance (differences)
24 134.68*** 125*** 186.05** 1.36* 0.96 0.43 132.61 0.70 106.44 1.88 0.01
Epistasis:
i type 1 0.81 0.70 601.66* 1.55 0.11 0.52 147.26 0.11 41.66 1.14 0.0003
j and l type 24 39.78 74.14*** 129.94 1.14 0.45 0.26 73.70 0.39 115.37 0.75 0.01
Replication ×
Families 76 31.31 27.49 103.76 1.07 0.74
* 0.34 140.82** 0.56** 132.89*** 1.59 0.01***
Error 613 38.31 31.75 96.73 0.87 0.48 0.39 67.12 0.27 15.62 1.59 0.002
*** P < 0.001, ** P < 0.01, * P< 0.05
Table 3. Mean square from the analysis of variance to test for additive, dominance and epistasis components in triple test cross:
Siete Cerros × Axona for eleven metric traits in salinity condition (150 mM NaCl)
Item DF Days to
heading Days to maturity Plant height (cm) Spike length (cm) Spike weight (g) Straw weight (g) No. of grains per spike Grain yield per plant (g) 1000 grain weight (g) Whole plant weight (g) Harvest index Additive (sums)
24 316.87*** 428.65*** 415.15*** 4.21*** 0.17 0.39*** 370.30*** 0.11 188.50** 0.75*** 0.01
Dominance (differences)
24 115.82*** 103.14* 95.39 1.37** 0.17 0.144 139.92** 0.13 60.27 0.28 0.01
Epistasis:
i type 1 5.70 19.26 142.60 1.89 0.16 0.16 6.33 0.09 40.01 0.66 0.004
j and l type 24 43.52 70.20 61.81 1.36** 0.11 0.15 75.26 0.08 124.12 0.37 0.006
Replication × Families
76 46.25 57.19* 75.02 0.84 0.15*** 0.12 64.99* 0.10** 75.85*** 0.34 0.008***
Error 611 42.67 42.27 63.38 0.71 0.07 0.1477 50.02 0.03 26.58 0.31 0.001
Table 4. Mean square from the analysis of variance to test for genetic components in triple test cross for eleven metric traits in
combinedanalysis
Item DF Days to
heading
Days to maturity
Plant height (cm)
Spike length (cm)
Spike weight
(g)
Straw weight (g)
No. of grains per
spike
Grain yield per plant (g)
1000 grain weight (g)
Whole plant weight (g)
Harvest index
Additive (sums)
24 648.78*** 778.32*** 1121.47*** 9.78*** 0.44 1.10*** 607.38*** 0.48 284.70*** 3.06*** 0.01
Dominance
(differences) 24 198.02
*** 190.96*** 212.98*** 2.04*** 0.48 0.33 97.34 0.36 105.30 1.09 0.009
Epistasis:
‘i’ type 1 1.10 13.66 662.7** 3.43* 0.002 0.05 107.35 0.0005 81.67 0.03 0.001
‘j’ and ‘l’ 24 50.57 102.12*** 116.82 1.37* 0.21 0.17 90.48 0.14 101.75 0.59 0.006
Additive ×
treatment 24 65.52
* 90.282*** 89.54 1.02 0.32 0.33 115.64 0.22 104.80 1.00 0.009
Dominance × treatment
24 52.69 37.28 68.12 0.69 0.65 0.24 175.14* 0.47 61.30 1.07 0.01
‘i’ type ×
treatment 1 5.20 6.07 3.16 0.007 0.28 0.63 46.87 0.21 0.008 1.77 0.003
‘j’ and ‘l’ × treatment
24 32.76 42 75.05 1.13 0.34 0.23 58.52 0.32 137.81 0.71 0.01
Replication × Families
76 38.78 42.34 89.39 0.96 0.44*** 0.23 102.90*** 0.33** 104.37*** 0.96*** 0.01**
Error 1224 40.48 36.99 80.08 0.79 0.27 0.27 58.61 0.15 14.02 0.95 0.002
*** P < 0.001, ** P < 0.01, * P< 0.05
Table 5. Estimation of additive (D) and dominance (H) components of variation, dominance ratio (H/D)1/2, narrow sence (h2n) and
broad sence (h2b) heritability from a triple test cross progenies derived from Siete Cerros × Axona for characters at control condition (0 mM NaCl), salinity condition (150 mM NaCl) and combined analysis
Item Days to
heading
Days to maturity
Plant height Spike length Straw weight No. of grains per ear
1000 grain weight
Whole plant weight
Control
D 95.78*** 108.68*** 186.38** 1.52* 0.17 56.38 - 0.45
H 38.54 37.3 35.72 0.19 - - - -
(H/
D)1/2 0.63 0.58 0.43 0.35 - - - -
h2
n 0.66 0.81 0.60 0.56 - - - -
h2
b 0.77 0.95 0.66 0.60 - - - -
Salinity
D 73.12* 99.05** 93.80 0.93 0.06 81.41 30.04 0.11
H 29.26 18.38 - 0.26 - 29.97 - -
(H/
D)1/2 0.63 0.43 - 0.53 - 0.60 - -
h2
n 0.55 0.56 - 0.46 - 0.41 - -
h2
b 0.66 0.61 - 0.52 - 0.48 - -
Combined
D 81.10** 98.84*** 13.85* 1.19 0.11 67.26 24.04 0.27
H 31.50 30.79*** 26.58 0.24 - - - -
(H/
D)1/2 0.62 0.55 0.43 0.45 - - - -
h2
n 0.60 0.72 0.53 0.51 - - - -
h2
b 0.72 0.83 0.58 0.56 - - - -
first reference, and two wheat varieties and their F1
crossed toa set of 24 varieties selected on the basis of genetic diversity in the second reference. Similar results were also reported by Singh et al. [13] for final plant
height, and by Tripathi and Singh [15] for final plant height, spike length and days to maturity while they analysed triple test cross data for four and three populations of barley respectively, grown under saline-alkali soil conditions. Subbaraman and Rangasamy [14] have found different results from their experiments, on rice for existing of epistasis and its type, ‘i’ and/or ‘j and l’types, for final plant height and days to maturity. They concluded that more elaborate experiments conducted at different locations for more than one year would give a clearer picture about the genetic systems controlling these characters and phenotypic plasticity in them due to environmental effects (location, years, etc.). But in another work Verma et al. [16] concluded that
only ‘j’ and ‘l’ types of epistasis were important for all characters except grain breadth in rice.
Standard hybridization and selection procedures could take advantage of epistasis if it is of the ‘i’ type. Other types of epistasis i. e. ‘j’ and ‘l’ are not fixable by selection in self-pollinated crops such as wheat, and therefore are not useful for developing pure line cultivars. They may be nonetheless useful in the development of hybrids. In the development of pure line cultivars, the modifying effects of epistasis are of no consequence if selection is postponed to later generations when virtual homozygosity is attained, because only additive types of epistasis are present in pure breeding lines [14-16].
From the results obtained, it has been indicated for which one of the above characters an epistatic component plays an important role. Epistasis cannot therefore be ignored when plant breeders are planning breeding programs to improve these characters in wheat or other species in salinity and/or control conditions. It is unlikely that we could ever be lucky enough to have a trait (= character) for which there is no epistasis, though it may not be detected in any particular experiment as stated by Kearsey and Pooni [6].
No Evidence of Genetic Variation for some Characters
For some characters such as spike weight, yield per plant, and harvest index, no indication of genetic components controlling them were significant, derived from the pot(s) × families interaction mean square against the additive and dominance components. This indicates that the amount of genetic variability is low for these traits in the two parental varieties, possibly
because both varieties are highly bred and selected varieties for these characters, and much of the genetic variability for them is now fixed in their genotypes, and not free. In other words, this may be due to inadequate testers for these traits in this particular cross which was used in the present study. They may have some loci, which carry the same alleles. As mentioned by Pooni and Virk [8] for triple test cross experiments, testers should be extremely different for described characters. Their choice was based upon significant difference in salinity tolerance, and as a consequence they did not differ in certain characters, i.e. ear weight, yield per
plant, and harvest index.
The interaction additive × treatment was significant for days to maturity and heading date. On the other hand the differences × treatment item was significant only for number of grains per ear. It seems that dominance gene effects were less sensitive to environmental differences (treatment) than the additive gene effects indicating a higher stability of heterozygotes than the corresponding homozygotes in the varying environments. Barley and wheat workers [13,12,15] have reported similar result.
In general, it can be concluded that the importance of three genetic components of variance, namely additive, dominance, and epistasis, varies with the character examined, and whether the plants are growing in control or saline conditions. For example, the above three components were important for final plant height in non-saline conditions, but only an additive component was expressed in the saline condition. This may be due to their being undetected in plants under saline conditions, thus causing a reduction of genetic variability. However for the characters such as straw weight, which were controlled predominantly by additive gene action under saline treatment and control, early generation selection could be useful for its improvement. For other characters like heading date and number of grains per ear for which both additive and dominance gene action were detected, the population should be handled by bulk selection, followed by individual selection in later generations. Since in later generations the phenotype is showing the homozygous genotype due to declining heterozygosity, the selection will be more effective.
Acknowledgements
References
1. Ashraf M. and McNeilly T.Variability in salt tolerance of nine spring wheat cultivars. J. Agron. and Crop Sci., 160:
14-21 (1988).
2. Epstein E, Rains D.W.Advances in salt tolerance. Plant and Soil, 90: 17-29 (1987).
3. Hurkman W.J. Effect of salt stress on plant gene expression: A review. Ibid., 146: 145-151 (1992).
4. Kearsey M.J. Biometrical genetics in breeding. In: Hayward M.D., Bosemak N.O., and Romagosa I. (Eds.)
Plant Breeding, Principles and Prospects. Chapman and
Hall, London. 163 pp. (1993).
5. Kearsey M.T and Jinks J.L. A general method of detecting additive, dominance and epistatic variation for metrical traits. 1.Theory. Heredity, 23: 403-409 (1968).
6. Kearsey M.J. and Pooni H.S. The Genetic Analysis of Quantitative Traits. Chapman and Hall, London. 86 pp.
(1996).
7. Nanda G.S., Singh P., and Gill K.S. Epistasis, additive and dominance variation in a triple test cross of bread wheat (Triticum aestivum L.). Theor. and Appl. Gene.,
62: 49-52 (1982).
8. Pooni H.S. and Virk P.S. Biometrical genetic analyses of a metrical trait. Genetica Polonica, 33: 7-15 (1992).
9. Pooni H.S., Jinks J.L., and Pooni G.S. A general method for the detection and estimation of additive, dominance
and epistatic variation for metrical traits. IV. Triple test cross analysis for normal families and their selfs.
Heredity, 44: 177-192 (1980).
10. Rush D.W. and Epstein E. Breeding and selection for salt tolerance by the incorporation of wild germplasm into a domestic tomato. J. Ameri. Soc. Horti. Sci., 106: 699-704
(1981).
11. Singh S. and Singh R.B. Triple test cross analysis in two wheat crosses. Heredity, 37: 173-177 (1976).
12. Singh S. and Dahiya M.S. Detection and estimation of components of genetic variation and genotype × environment interaction in three wheat crosses. J. Agri. Sci. Cam., 103: 543-547 (1984).
13. Singh S., Dhull R.S., and Mishra S.B. Triple test cross analysis in F2 populations of four barley crosses. Theor. Appl. Gene., 55: 243-245 (1976).
14. Subbaraman N. and Rangasamy S.R.S. Triple test cross analysis in rice. Euphytica, 42: 35-40 (1989).
15. Tripathi I.D. and Singh M. Triple test cross analysis in three barley populations under saline-alkali soil conditions. Journal of Agricultural Science Cambridge,
101: 317-321 (1983).
16. Verma P.K., Katoch P.C., and Kaushik R.P. Genetic architecture of harvest index and grain shape characters through triple test cross analysis allowing inadequate testers in rice (Oryaza sativa L.). Annals of Biology, 9: