ARTICLE OPEN ACCESS
Impaired kidney structure and function in spinal
muscular atrophy
Fl´avia C. Nery, PhD,* Jennifer J. Siranosian, BS,* Ivy Rosales, BS, Marc-Olivier Deguise, BS, Amita Sharma, BS, Abdurrahman W. Muhtaseb, BS, Pann Nwe, BS, Alec J. Johnstone, BS, Ren Zhang, BS, Maryam Fatouraei, BS, Natassja Huemer, BS, Christiano R.R. Alves, PhD, Rashmi Kothary, PhD, and Kathryn J. Swoboda, MD
Neurol Genet2019;5:e353. doi:10.1212/NXG.0000000000000353
Correspondence
Dr. Swoboda
Abstract
Objective
To determine changes in serum profiles and kidney tissues from patients with spinal muscular atrophy (SMA) type 1 compared with age- and sex-matched controls.
Methods
In this cohort study, we investigated renal structure and function in infants and children with SMA type 1 in comparison with age- and sex-matched controls.
Results
Patients with SMA had alterations in serum creatinine, cystatin C, sodium, glucose, and calcium concentrations, granular casts and crystals in urine, and nephrocalcinosis andfibrosis. Neph-rotoxicity and polycystic kidney disease PCR arrays revealed multiple differentially expressed genes, and immunoblot analysis showed decreased calcium-sensing receptors and calbindin and increased insulin-like growth factor–binding proteins in kidneys from patients with SMA.
Conclusions
Thesefindings demonstrate that patients with SMA type 1, in the absence of disease-modifying therapies, frequently manifest impaired renal function as a primary or secondary consequence of their disease. This study provides new insights into systemic contributions to SMA disease pathogenesis and the need to identify coadjuvant therapies.
*Both authors contributed equally to this work.
From the Department of Neurology (F.C.N., J.J.S., A.W.M., P.N., A.J.J., R.Z., M.F., N.H., C.R.R.A., K.J.S.), Center for Genomic Medicine, Massachusetts General Hospital, Boston, MA; Department of Pathology (I.R.), Massachusetts General Hospital, Boston, MA; Regenerative Medicine Program (M.-O.D., R.K.), Ottawa Hospital Research, Institute Ottawa, Ontario, Canada; Department of Cellular and Molecular Medicine (M.-O.D., R.K.), University of Ottawa, Canada; Centre for Neuromuscular Disease (M.-O.D., R.K.), University of Ottawa, Ottawa, Ontario, Canada; Division of Pediatric Nephrology (A.S.), Massachusetts General Hospital, Boston, MA; Department of Biology (N.H.), Federal University of São Carlos, Sorocaba, Sao Paulo, SP, Brazil; and Department of Medicine (R.K.), University of Ottawa, Ottawa, Ontario, Canada.
Go to Neurology.org/NG for full disclosures. Funding information is provided at the end of the article. The Article Processing Charge was funded by the authors.
This is an open access article distributed under the terms of the Creative Commons Attribution-NonCommercial-NoDerivatives License 4.0 (CC BY-NC-ND), which permits downloading and sharing the work provided it is properly cited. The work cannot be changed in any way or used commercially without permission from the journal.
Spinal muscular atrophy (SMA), a devastating neuromuscular disease characterized by motor neuron degeneration and pro-gressive muscle atrophy, is a leading genetic cause of infantile death worldwide. SMA is caused by mutations in the Survival Motor Neuron 1 (SMN1) gene that result in reduced func-tional SMN protein expression. However, a paralog gene, SMN2, undergoes alternative splicing, including the removal of exon 7, and producing only;10% functional SMN protein.1,2 The severe infantile variant (SMA type 1) is the most frequent SMA subtype, accounting for more than 50% of incident cases. Patients with SMA type 1 develop early infantile-onset pro-gressive skeletal, bulbar, and respiratory muscle weakness. By the time such patients present with symptoms, severe de-nervation has already occurred, and the majority of patients with SMA type 1 die in infancy or childhood.1,3
Recent cutting-edge molecular and gene therapies have shown striking clinical benefit when such treatments were started in the presymptomatic or early symptomatic period in infants with SMA type 1. The US Food and Drug Administration approved the use of nusinersen (Spinraza; Biogen, Cambridge, MA), a synthetic antisense oligonucleotide (ASO) that mod-ulates premessenger RNA splicing of the SMN2 gene.4,5 Clinical trials with nusinersen have demonstrated improve-ments in morbidity and ventilator-free survival in patients with early infantile-onset SMA.6,7However, increased risk of renal toxicity is listed on the FDA-approved product insert,8 and similar therapies have been associated with acute tubular injury.9,10Longitudinal studies for patients treated with nusi-nersen are still ongoing and will provide additional insights to confirm its long-term efficacy and safety.4In the meantime, other potential therapies for SMA type 1 are under clinical investigation and show promising preliminary results, including theSMN1gene replacement AVXS-101 (Zolgensma; AveXis, Novartis, Chicago, IL)11,12and the modulator ofSMN2 splic-ing RO7034067 (Risdiplam; Roche, Basel, Switzerland; trial #NCT02913482).13These emerging therapies, in conjunction with standardized respiratory, orthopedic, and nutritional support, will continue to improve morbidity and survival in even the weakest patients with SMA type 1. Thus, un-derstanding the full spectrum of the impact of SMN deficiency both within and outside of the CNS is critical to the health and well-being of patients with SMA.
Motor neurons are selectively vulnerable to SMN deficiency and subsequently account for the earliest manifestation in SMA clinical disease. However, patients with SMA have de-creased levels of SMN protein throughout the whole body, and increasing evidence indicates that SMN deficiency in tissues other than motor neurons may contribute to disease
pathogenesis.14–17Systemic administration of an ASO (ASO-10-27) that restores SMN expression systemically extended the lifespan of a severe SMA mouse model by 25-fold, whereas direct intracerebroventricular administration induced a much more modest increase in survival.17However, the only clini-cally available ASO therapy for patients with SMA is delivered intrathecally and largely limited to the CNS. The drug reaches the systemic circulation via CSFflow dynamics, redistributing to the kidney and other organs to a variable degree before it is excreted in urine.4,5 Studies exploring the contribution of peripheral systemic pathology to SMA disease phenotype are limited, and renal studies in SMA have not been performed.
Thus, we investigated serum profiles and kidney tissues from patients with SMA type 1 who died before the availability of proven disease-altering therapies and compared them with age- and sex-matched controls. Participants with SMA type 1 showed low serum creatinine, cystatin C (CysC), and sodium concentrations, high circulating glucose and calcium levels, and granular casts and amorphous crystals in the urine, fea-tures that indicate renal tubular dysfunction before death. Participants with SMA displayed (1) medullary nephrocalci-nosis andfibrosis, (2) multiple differentially expressed genes and molecular pathways associated with nephrotoxicity and polycystic kidney disease, (3) downregulated calcium-sensing receptor (CaSR) and calbindin 1 (CALB1) proteins, and (4) upregulated insulin-like growth factor–binding proteins 1 (IGFBP1) and 3 (IGFBP3) compared with age- and sex-matched controls. Therefore, we conclude that patients with SMA type 1 have an increased risk of impaired kidney func-tion, more specifically renal tubular dysfunction. This factor needs to be considered from the initial point of diagnosis.
Methods
Standard protocol approvals, registrations, and patient consents
Mouse experiments were approved by the Animal Care and Veterinary Services of the University of Ottawa, ON, Canada (protocols #OHRI-1927 and #OHRI-1948). This study com-plies with the guidelines of the International Committee of Medical Journal Editors. The procedures comply with the in-stitutional and national guide for the care and use of laboratory animals. Human studies were approved by the Institutional Ethics Review Board at the University of Utah (protocol #8751).
Mice
This study was approved by the Animal Care and Veterinary Services of the University of Ottawa, ON, Canada (protocols #OHRI-1927 and #OHRI-1948). Smn2B/−mice were obtained
Glossary
as previously described18and housed at the Animal Facility of University of Ottawa in accordance with the Canadian Council on Animal Care. Samples were collected from symptomatic Smn2B/−mice at postnatal day 19. Mouse blood was collected following decapitation using either Microvette CB300 K2 EDTA (Sarstedt, cat# 16.444.100) coated with EDTA for plasma extraction or Microvette CB300 Z (Sarstedt, cat# 16.440.100). Blood was spun for 5 minutes at 10,000gto obtain serum and 2,000g to obtain plasma at room temperature. Plasma was analyzed for creatinine, blood urea nitrogen (BUN), albumin, calcium, and phosphorus at a veterinary reference laboratory using commercially available biochemical assays (Beckman-Coulter, Inc, Brea, CA) on an automated clinical chemistry analyzer platform (Beckman-Coulter AU680; Beckman-Coulter, Inc). Sodium, chloride, and potas-sium were determined using ion-selective electrodes (Beckman-Coulter) on the same platform. Kidney tissues were collected for Western blot analysis.
Human experiments
This cohort study includes a total of 13 pediatric participants with SMA type 1 who died during the course of their disease and 13 age- and sex-matched pediatric controls from the NIH NeuroBioBank. Written informed parental consent was obtained for all participants with SMA under the Institutional Ethics Review Board at the University of Utah (protocol #8751) and Massachusetts General Hospital (protocol #2016P000469). No participants with SMA received either disease-modifying therapies nusinersen or AVXS-101 gene therapy. Tissues from controls were obtained from the NIH NeuroBioBank’s Brain and Tissue repository at the University of Maryland, Baltimore. Comprehensive clinical data were available for all participants with SMA, and premortem clinical laboratory data from medical records were available for 12 participants with SMA. Kidney samples were obtained during a rapid autopsy protocol in 12 participants with SMA and 13 controls. Sufficient tissue was available in 4 age- and sex-matched SMA and controls for RNA (SMA #177, 272, 251, and 195; controls: #5883, 5282, 5564, and 5180) and protein (SMA #272, #251, #195, and #101, and controls: #5387, #5564, #5282, and #5883) extraction and analysis.
SMN1andSMN2copy numbers
SMN1andSMN2 copy numbers were determined by droplet digital PCR using the Bio-Rad QX-200 system (Bio-Rad, Her-cules, CA). Each sample was amplified separately to measure SMN1orSMN2copies relative to the number ofCFTRcopies. A competitive oligo with a 39phosphate was used to increase probe specificity.19 SMN1 was detected with SMN-Ex7-FP 59
AATGCTTTTTAACATCCATATAAAGCT, SMN-Ex7-RP
59CCTTAATTTA AGGAATGTGAGCACC, SMN1-LNA
probe FAM-A+G+GGTT+T+c+AGAC and competitive
SMN1 oligo
ATTTTCCTTACAGGGTTTtAGACAAAATCAAAAGA-PHO. SMN2 was detected with the same primers as SMN1 and using SMN2-LNA probe FAM-A+G+GGTT+T+T+AGAC
and competitive SMN2 oligo ATTTTCCTTACAGGG
TTTcAGACAAAATCAAAAGA-PHO. TheSMN1andSMN2
probes are located at the C/T base difference in SMN exon 7. Each reaction was multiplexed with a primer/probe set to detect exon 14 of CFTR as a 2-copy gene control using FP-CFTR
59 AGAGAGAAGGCTGTCCTTAGT, RP-CFTR
59 GAGTGTGTCATCAGGTTCAGG, and
HEX-TTCTGAGCAGGGAGAGGCGATACT probe. Copy num-bers were determined by dividing the number ofSMN1orSMN2 copies by the number ofCFTRcopies for each sample.
Biochemical analysis
CysC concentrations were determined using Luminex xMAP
®
technology (Myriad RBM, Austin, TX) on existing frozen se-rum samples. Circulating creatinine, BUN, calcium, phospho-rous, sodium, chloride, potassium, glucose, and C-reactive protein, granular casts and amorphous crystals in the urine, and generalized aminoaciduria analyses were available from pre-mortem clinical laboratory data in the Project Cure SMA Longitudinal Population Data Repository (Massachusetts General Hospital IRB protocol #2016P000469).Histology
Paraffin-embedded kidney tissues were cut at a thickness of
5-μm and stained with hematoxylin and eosin, periodic acid– Schiff, Masson trichrome, Alizarin red, von Kossa, and Prussian blue according to standard histologic protocols. Sections were examined by an experienced renal pathologist (I.R.) blinded for sample IDs. For immunohistochemistry, paraffin-embedded tissues were cut at a thickness of 5 μm on glass slides and incubated at 60°C for 30 minutes, followed by deparaffinization in xylene and rehydration in graded alcohol into water. Antigen retrieval was performed by boiling the slides in 10 mM sodium citrate buffer (pH = 6.0) for 30 minutes. Endogenous peroxi-dase activity was quenched with Dual Endogenous Enzyme Block (DAKO, Agilent, CA) for 5 minutes. Tissue sections were incubated with 1:500 dilution of CaSR mouse monoclonal an-tibody (Novus 5C10, ADD) or 1:5,000 dilution of CALB1 rabbit polyclonal antibody (Sigma-Aldrich HPA023099) or 1: 100 dilution of AQP3 (Atlas Antibodies HPA014924) in 1% TBS/BSA at 4°C inside a humidified chamber overnight. After washing, slides were incubated with Envision Dual Link System Polymer HRP (DAKO) for 30 minutes at room temperature. After washing, the DAB+ reagent (DAKO) was added with monitoring for 5–10 minutes. After washing, counterstain was performed using Harris-type hematoxylin. Slides were briefly dehydrated and then mounted with Histomount solution (Life Technology, Grand Island, NY). Immunohistochemical analy-ses were performed according to standard protocols on 4-m sections using the Vector ABC Reagent kit and developed with DAB substrate (Vector Laboratories, Burlingame, CA). Kidney slides were also double stained for CD3 (1:400 Dako A0452)/ CD68 (1:800 Dako M0814) markers in the autostainer.
PCR array
Total RNA was extracted from frozen kidney samples using TRIzol reagent (Thermo Fisher Scientific, Waltham, MA). All the samples had a 280/260 ratio≥1.9. Complementary DNA
Table 1 Serum biochemical profiles in spinal muscular atrophy type 1 participants
Patient ID no.
Age at
death Creatinine Cystatin C BUN Calcium Phosphorus Sodium Chloride Potassium Glucose
C-reactive protein
Granular casts and/or amorphous crystals
Generalized aminoaciduria
Normal ranges:
0.23–0.61 mg/dL
0.51–1.10 mg/L
5–17 mg/dL
8.7–9.8 mg/dL
3.7–7.4 mg/dL
137–146 mmol/L
98–109 mmol/L
3.4–4.7 mmol/L
60–108 mg/dL
<0.8
mg/dL Urine results
101 10.2 <0.05–0.4 0.35 3.0–17 7.5–10.2 4.3–5.5 133–142 102–115 3.9 82–142 <0.7–3.2 Present Present
187 5.1 0.05–0.28 0.54–0.65 2.0–13 6.7–10.8 2.0–6.4 123–158 79–124 1.7–7.0 65–332 6.2 Absent Present
7† 4 0.2 N.t. 2.0–10 8.1–10.3 1.7–6.0 134–143 97–114 3.3–7.0 66–358 <0.8 Present N.t.
196 3.8 0.08–0.24 0.57–0.66 4.0–23 8.1–10.6 2.5–5.7 133–159 91–114 1.7–6.9 71–168 <0.5–8.1 Present Present
195 2.96 0.10–0.30 0.38–0.43 3.0–13 8.9–10.5 5.8–6.1 128–140 97–112 3.7–7.2 71–135 0.5–1.2 Present Normal
217 2.75 0.12–0.32 0.61 5.0–25 8.3–11.6 2.4–5.6 133–163 95–125 3.2–6.0 70–143 0.3–1.3 Present N.t.
206 2.34 0.15–0.34 0.47–0.75 7.0–17 8.9–11.6 N.t. 131–139 102–108 3.5–5.6 73–105 <0.5 N.t. N.t.
403 2.3 0.06 N.t. 5.0 8.3 N.t. N.t. N.t. N.t. 449 N.t. N.t. N.t.
353 1.65 N.t. N.t. 5.0–8.0 8.9–10.6 N.t. N.t. N.t. 3.2–5.4 116 N.t. N.t. N.t.
177 1.38 0.11–0.7 0.54–0.69 3.0–15 8.4–10.4 3.9–7.7 132–146 97–114 3.0–5.4 70–209 0.2–0.5 Present Present
251 1.2 0.14–0.66 0.35–0.83 5.0–19 8.4–10.1 N.t. 135–139 95–108 3.8–4.3 70–97 N.t. Present N.t.
351 0.56 0.21–0.34 0.96 2.0–16 8.9–10.6 3.9–5.1 137–143 103–112 2.6–5.5 73–218 N.t. Present N.t.
Lowest value 11/11 (100%) 4/9 (44%) 8/12 (67%) 7/12 (58%) 5/8 (63%) 9/10 (90%) 7/10 (70%) 7/11 (64%) 0/12 (0%) 0/8 (0%) 8/9 (89%) 4/5 (80%)
Highest value 2/11 (18%) 0/9 (0%) 3/12 (25%) 11/12 (92%) 1/8 (13%) 3/10 (30%) 8/10 (80%) 9/11 (82%) 10/12 (83%) 5/8 (63%)
Abbreviations: BUN = blood urea nitrogen; N.t. = not tested.
4
Neurology:
Genetics
|
Volume
5,
Number
5
|
October
2019
was generated from 500 ng of purified RNA using the RT2 First Strand Kit (Qiagen, Venlo, the Netherlands) protocol or 300 ng for SuperScript IV VILO (11766050; ThermoFisher Scientific). The Nephrotoxicity and Polycystic Kidney Disease RT2Profiler PCR Arrays (PAHS-094Z and PAHS-168Z; Qiagen) were performed, and each messenger RNA (mRNA) gene expres-sion was calculated relative to the average of 5 housekeeping genes in the arrays accordingly to the manufacture instructions.
Western blot
Protein was extracted from frozen kidney samples using RIPA lysis buffer (Cell Signaling Technology, Danvers, MA). Sam-ples were sonicated and centrifuged at 10,000 rpm for 10 minutes at 4°C. Protein concentrations were determined using the Bradford assay (Bio-Rad). Protein samples (30μg) were run on a NuPAGE 12% Bis-Tris Protein Gel (NP0342Box, Invitrogen by Thermo Fisher Scientific) electrophoresis and transferred to a nitrocellulose membrane. Membranes were incubated with Odyssey blocking buffer (Li-Cor 927–40,000) diluted 1:1 in Tris-buffered saline buffer. REVERT Total Pro-tein Stain (Li-Cor 926–11,010) was used for loading control. Primary antibodies were incubated overnight at 4°C to probe for SMN (BD Transduction, San Jose, CA, Catalog 610647, Dilution 1:2,000, monoclonal), IGFBP1 (Santa Cruz, Dallas, TX, Catalog c-55474, Dilution 1:1,000, monoclonal), IGFBP3 (Abcam, Cambridge, UK, Catalog ab77635, Dilution 1:1,000, goat polyclonal), IGF-1 (Abcam, Catalog ab9572, Dilution 1: 500, rabbit polyclonal), IGFALS (Thermo Fisher Scientific,
Catalog PA5-59252, Dilution 1:1,000, rabbit polyclonal), CaSR (Novus, Denver, CO, Catalog NB120-19347SS, Dilution 1: 500, monoclonal), CALB1 (Sigma, Saint Louis, MO, Catalog HPA023099, Dilution 1:750, rabbit polyclonal), andα-tubulin (Cell Signaling Technology, Catalog 3873S, Clone DM1A, Dilution 1:2,000, monoclonal). Secondary antibodies were IRDye 680RD Donkey anti-Mouse IgG (Li-COR, Catalog 925-68,072, Dilution 1:5,000), IRDye 680RD Donkey anti-Goat IgG (Li-COR, Lincoln, NE, Catalog 925-68,074, Dilution 1: 5,000), IRDye 800CW Donkey anti-Mouse IgG (Li-COR, Catalog 925-32,212, Dilution 1:10,000), IRDye 800CW Don-key anti-Rabbit IgG (Li-COR, Catalog 925-32,213, Dilution 1: 10,000), and IRDye 800CW Donkey anti-Goat IgG (Li-COR, Catalog 925-32,214, Dilution 1:2,000). Membranes were im-aged using the Odyssey CLx (Li-COR). Blots were quantified using ImageJ and normalized byα-tubulin.
Statistical analysis
Data are presented as mean ± standard error of the mean with dots as individual values. Sample size is indicated in thefigure legends. Statistical analyses were performed using GraphPad Prism 7 software (GraphPad Software, Inc). Unpaired 2-tailed Studentttests were used to compare groups. Statistical sig-nificance was defined asp< 0.05.
Data availability
All data relevant to this study are contained within the article.
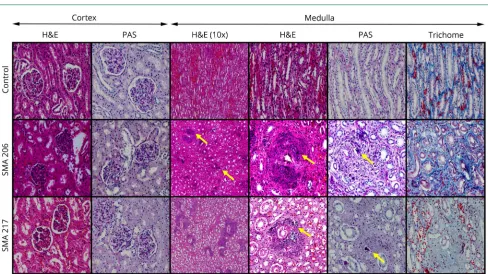
Figure 1Kidney histopathology in patients with SMA type 1
Sections from the kidneys of SMA cases show medullary calcifications (yellow arrows, H&E and PAS) along collecting ducts. Medullary interstitial fibrosis is also present (trichrome). Representative images were taken at 100× (indicated as 10× objective) and 400× magnifications. H&E = hematoxylin and eosin; PAS = periodic acid–Schiff; SMA = spinal muscular atrophy.
Results
To determine whether renal function is affected in a model of SMA, we first evaluated serum creatinine, BUN, albumin, calcium, phosphorus, sodium, chloride, and potassium in Smn2B/− mice. Smn2B/− mice have reduced SMN protein
content through the whole body, including in the kidney (figure S1, links.lww.com/NXG/A174), exhibiting a classic SMA phenotype and a short lifespan (<30 days).18,20Smn2B/− mice had reduced circulating creatinine, BUN, albumin, cal-cium, and chloride at symptomatic age postnatal day 19 (table S1). These initial observations suggest that renal abnormali-ties are present in an intermediate mouse model of the disease.
We further investigated available renal tissues and laboratory data from a cohort of 13 participants with SMA type 1 who were followed longitudinally and died in infancy or childhood due to complications of SMA and compared them with age-and sex-matched controls (tables S2 age-and S3, links.lww.com/ NXG/A174). All participants with SMA were confirmed to have homozygous deletion of SMN1 and 2 SMN2 copies (table S2), whereas all controls had at least 1 SMN1 copy (table S3). During longitudinal follow-up, laboratory studies
were obtained in the clinical care setting, including circulating creatinine, BUN, calcium, phosphorus, sodium, chloride, po-tassium, glucose, and C-reactive protein. In addition, we eval-uated circulating CysC, a cysteine protease inhibitor produced by all nucleated cells and freelyfiltered by the glomerulus. By comparing the blood test results with reference values, most of the patients in our study consistently had values out of the expected range in all these analytes (table 1 and table S4).
We investigated kidneys from 12 participants with SMA who underwent comprehensive rapid research autopsy with a postmortem interval time ranging from 1 to 20 hours in all but 1 subject (table S2, links.lww.com/NXG/A174). The absolute mass of kidneys from SMA type 1 and controls was similar (figure S2). We found several histopathologic changes in kidney tissues from participants with SMA type 1 without corresponding abnormalities in controls (figures 1 and 2,
figure S3, table 2, and table S5). Participants with SMA type 1 showed varying degrees of tubular injury characterized by loss of brush borders,flattened epithelium with detachment, and occasional protein casts. Interstitialfibrosis and tubular atro-phy were absent to minimal. Occasional intratubular calcifi -cation was present in 2 of 12 participants with SMA (figure 1A and table 2, IDs #206 and 217). The glomeruli showed rare,
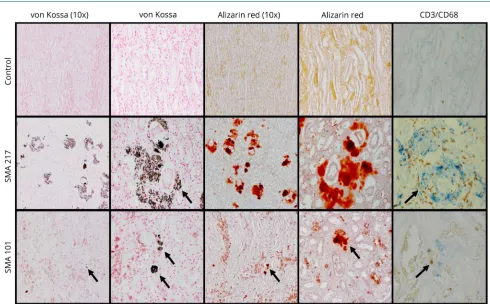
Figure 2Medullary calcifications in patients with SMA type 1
The medullary calcifications (black arrows) are positive for von Kossa and Alizarin red stains. Immunohistochemical studies show CD3+(brown) and CD68+
Table 2 Pathologic findings in spinal muscular atrophy type 1 kidneys
ID
no. Pathologic findings in kidneys at autopsy
Cortex Medulla
Glomerular changes Tubular changes
Interstitium Interstitium
Calcification Inflammation Fibrosis Calcification Fibrosis
Alizarin red
von Kossa
CD3/ CD68
101 Tubules showed normal size, pyknotic nuclei, acute tubular necrosis, and calcifications in the cortex and medulla
Rare mesangial hypercellularity; rare adhesions
Mild to moderate <5% None <5% <5% Focal
<5%
Pos Pos Pos
187 Patchy foci of necrosis bilaterally; mild ectasia of the renal collecting system
None Mild None None None None None N.t. N.t. N.t.
196 Small focal nephrocalcinosis in the right kidney Focal mesangial hypercellularity/rare adhesions
Mild to moderate; occasional protein casts
None None None <5% Focal
<5%
Pos Pos Neg
195 No reported abnormalities None Mild None None None None None Neg Neg N.t.
217 Scattered calcifications in the kidney Rare mesangial hypercellularity; rare adhesions and <5% global sclerosis
Mild Focal,
intratubular
Mild <5% 50% 50% Pos Pos Pos
206 Multifocal calcifications in the renal medulla with surrounding inflammation and fibrosis. Focal hyaline casts, dilated tubules in the medulla are associated with areas of dystrophic calcification and accumulation of macrophages and multinucleated cells. Pale renal medullary pyramids bilaterally
Rare mesangial hypercellularity; rare adhesions and <1% global sclerosis
Mild Focal,
intratubular
<1% <10% 60% 60% Pos Pos Pos
403 Acute tubular congestion of kidneys Diffuse mesangial hypercellularity; rare adhesions and <1% global sclerosis
None None None 20% None None N.t. Neg N.t.
353 Acute passive congestion; microcalcifications Focal mesangial hypercellularity; rare adhesions and <5% global sclerosis
None None <5% None 20% 20% Pos Pos Pos
177 Scattered nephrocalcinosis None None None None None None None N.t. Neg N.t.
251 No reported abnormalities None None None None None None None N.t. N.t. N.t.
351 No reported abnormalities None None None <5% None <5% Focal
<5%
N.t. Pos N.t.
272 No reported abnormalities None Mild None None None <1% None N.t. Neg N.t.
Abbreviations: Pos = positive; Neg = negative; N.t. = not tested.
Neurology.
org/NG
Neurology:
Genetics
|
Volume
5,
Number
5
|
October
2019
focal mesangial hypercellularity and adhesions in 6 partic-ipants with SMA (figures 1 and 2 andfigure S3, IDs #101, 196, 217, 206, 403, and 353). Approximately 50% of SMA kidneys showed tubular injury, medullary calcinosis, and fibrosis (table 2). Medullary calcification surrounding collecting ducts associated with interstitialfibrosis was prominent in 2 par-ticipants (figure 1, A and B, IDs #206 and 217). Alizarin red and von Kossa stains confirmed medullary calcium phosphate deposits. Positive staining for T-cell and macrophage markers (CD3 and CD68) around calcification foci indicates an
in-flammatory response (figure 1B). Overall, pathologic abnor-malities in the kidney were present in two-thirds of participants with SMA type 1 in our cohort. Althoughfindings suggesting acute tubular injury could be confounded by
terminal events, the tubulointerstitial lesions, including nephrocalcinosis and interstitial fibrosis, are indicative of chronic renal dysfunction. Future studies will be important to determine whether impaired kidney function is a primary consequence of reduced SMN protein, a secondary conse-quence of muscle atrophy and bone disease, or more likely a combination of both.
Furthermore, we were interested in determining the mo-lecular mechanisms associated with renal dysfunction. Nephrotoxicity and polycystic kidney disease PCR arrays revealed multiple differentially expressed genes in kidneys from participants with SMA type 1 compared with controls (figure 2, A and B). Each PCR array targeted 84 genes
Figure 3Changes in genes involved in calcium reabsorption in the kidney from SMA participants
Volcano plots derived from (A) Nephrotoxicity RT2Profiler
PCR Array and (B) Polycystic Kidney Disease RT2Profiler PCR
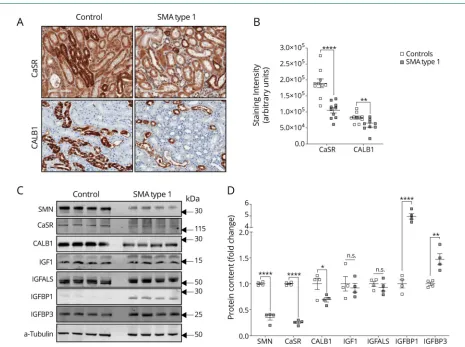
previously characterized as biomarkers associated with ei-ther kidney toxicity or cystic renal disease. We found 25 differentially expressed genes in the nephrotoxicity array (figure S4A, links.lww.com/NXG/A174, and table S6) and 8 in the polycystic kidney disease array (figure S4B and table S7, figures 3 and 4). These genes are involved in calcium signaling, apoptosis, cell proliferation, metal ion binding, glucose metabolism, oxidative stress, and kidney transporters signaling. Moreover, immunohistochemistry (figure 2, C and D) and immunoblot (figure 2, E and F) analysis demonstrated that participants with SMA type 1 had decreased CaSR and CALB1 protein expression.
It has been previously demonstrated that insulin-like growth factor 1 (IGF-1) is dysregulated in severely affected SMA mice.17Given that IGF-1 signaling plays a role in the mainte-nance of normal renal function,21we further evaluated IGF-1 signaling in renal tissues from SMA type 1 and controls. Par-ticipants with SMA type 1 had normal IGF-1 protein content, but increased levels of IGFBP1 and IGFBP3 (figure 2, E and F).
Discussion
Most of the patients in our study consistently had values out of the expected range in several blood analytes. We believe that many of these abnormalities are an expected consequence of severe generalized muscle atrophy and bone disease. For example, low creatinine concentrations in these participants were expected because creatinine is a product of creatine metabolism, and creatine is mainly present in muscle.22 Importantly, analysis of urine sedi-ment revealed granular casts and/or amorphous crystals and generalized aminoaciduria in the majority of partic-ipants with SMA type 1 (table 1). These elements being found in urine are associated with acute and chronic kidney injury with potential calcium oxalate deposition within the renal tubules. This process may lead to obstruction of the urine flow in the tubules while the intratubular crystals develop an inflammatory reaction with the renal inter-stitium and promote acute kidney dysfunction.23,24 Overall, the clinical laboratory data in these participants strongly suggest that the majority had impaired kidney
Figure 4Increased IGFBPs in kidney from SMA participants
(A) Representative immunohistochemistry (magnification 100×) and (B) quantification of staining intensity for CaSR and CALB1 in kidney samples from SMA and controls (n = 9–10). (C) Representative immunoblot and (D) quantification of protein content in kidney samples from SMA (n = 4) and controls (n = 4). Data are presented as mean SEM with dots as individual values. Unpaired 2-tailed Studentttests were used to compare groups. *p< 0.05; **p< 0.01; ****p< 0.0001. CALB1 = calbindin 1; CaSR = calcium-sensing receptor; IGF = insulin-like growth factor; IGFBP = insulin-like growth factor binding proteins; SMA = spinal muscular atrophy.
function before death, with features indicative of renal tubular dysfunction.
Participants with SMA type 1 had decreased CaSR and CALB1 protein expression. CaSR and CALB1 play critical anticalcification roles. CaSR acts as a sensitive detector of extracellular calcium and regulates parathyroid hormone ac-tivity, protecting against calcium phosphate precipitation.25,26 CALB1 regulates calcium reabsorption, and models of kidney dysfunction show downregulated CALB1.27Altogether, these changes in the expression of key molecules and proteins are consistent with renal function abnormalities as indicated by premortem clinical laboratory testing.
Participants with SMA type 1 had increased levels of IGFBP1 and IGFBP3. IGF signaling is complex, and IGFBPs have an important role in this signaling by enhancing or inhibiting IGF-1. IGFBP1 also affects cell growth and apoptosis.21,28 Transgenic mice with increased Igfbp1 expression demon-strate reduced number of nephrons and glomerulosclerosis,29 whereas those withIgfbp3overexpression show hypoplastic kidneys.30Kidneys in early-stage diabetic rats show increased IGFBP1 expression,31and increased IGFBP3 protease activity correlates with the degree of albuminuria in patients with diabetic nephropathy.32Thus, increased local expression of IGFBPs supports the concept of impaired kidney function in participants with SMA.
The precise mechanism by which kidney function is impaired in patients with SMA type I is not fully understood. We be-lieve that changes in kidney structure, gene, and protein ex-pression are in large part a consequence of severe generalized muscle atrophy, immobility, and dysregulation of bone me-tabolism resulting in secondary medullary calcification and renal tubular dysfunction. However, given the numerous functions of the SMN protein, SMN deficiency could also contribute to changes in gene expression through direct mechanisms. SMN protein plays an integral role in the spli-ceosomal assembly and processing of pre-mRNA species in all cells.33For example, SMN depletion has been demonstrated to cause intron retention, triggering a global DNA damage and stress response.34 In future studies, additional approaches, including in vitro studies, are necessary for de-termining whether SMN has a primary contribution to the gene expression profile in developing nephrons.
The present study has important clinical implications. Patients with SMA type 1 are living longer due to recent advances in SMA therapeutics, and impaired kidney function is likely to be a significant comorbidity. To help improve long-term survival and well-being of patients with SMA, it is im-portant to think ahead to provide therapeutic avenues that can positively modulate renal function.
Acknowledgment
Financial support was provided to K.J.S. from NIH NINDS R21-NS108015 and Cure SMA. R.K. was supported by Cure
SMA/Families of SMA Canada; Muscular Dystrophy Association (USA) (#575466); and Canadian Institutes of Health Research (CIHR) (#PJT-156379). M.-O.D. was supported by a Frederick Banting and Charles Best CIHR Doctoral Research Award. N.H. was supported by CAPES, Brazil. The authors thank Vicky L. McGovern and Arthur H.M. Burghes for technical support and scientific discussion and Patricia Della Pelle for technical support in histology. Control tissues were obtained from the NIH NeuroBioBank’s Brain and Tissue repository at the University of Maryland, Baltimore. They are very grateful to all the SMA families who participated in this study.
Study funding
No targeted funding reported.
Disclosure
Disclosures available: Neurology.org/NG.
Publication history
Received byNeurology: GeneticsApril 10, 2019. Accepted infinal form June 25, 2019.
AppendixAuthors
Name Location Role Contribution
Fl´avia C. Nery Massachusetts General Hospital, Boston, MA
Author Directed the research project and designed experiments; performed experiments; collected clinical data; analyzed the data; wrote the manuscript; participated in the data interpretation, and reviewed and approved the final manuscript. Jennifer J. Siranosian Massachusetts General Hospital, Boston, MA
Author Performed experiments; collected clinical data; analyzed the data; wrote the manuscript; participated in the data interpretation; and reviewed and approved the final manuscript.
Ivy Rosales Massachusetts General Hospital, Boston, MA
Author Performed experiments; analyzed the data; participated in the data interpretation; and reviewed and approved the final manuscript.
Marc-Olivier Deguise
University of Ottawa, Canada
Author Performed mouse experiments; participated in the data interpretation; and reviewed and approved the final manuscript.
Amita Sharma Massachusetts General Hospital, Boston, MA
References
1. Groen EJN, Talbot K, Gillingwater TH. Advances in therapy for spinal muscular atrophy: promises and challenges. Nat Rev Neurol 2018;14:214–224.
2. Faravelli I, Nizzardo M, Comi GP, Corti S. Spinal muscular atrophy-recent thera-peutic advances for an old challenge. Nat Rev Neurol 2015;11:351–359.
3. Thomas NH, Dubowitz V. The natural history of type I (severe) spinal muscular atrophy. Neuromuscul Disord 1994;4:497–502.
4. Corey DR. Nusinersen, an antisense oligonucleotide drug for spinal muscular atrophy. Nat Neurosci 2017;20:497–499.
5. Wood MJA, Talbot K, Bowerman M. Spinal muscular atrophy: antisense oligonu-cleotide therapy opens the door to an integrated therapeutic landscape. Hum Mol Genet 2017;26:R151–R159.
6. Finkel RS, Mercuri E, Darras BT, et al. Nusinersen versus sham control in infantile-onset spinal muscular atrophy. N Engl J Med 2017;377:1723–1732.
7. Finkel RS, Chiriboga CA, Vajsar J, et al. Treatment of infantile-onset spinal muscular atrophy with nusinersen: a phase 2, open-label, dose-escalation study. Lancet 2016; 388:3017–3026.
8. Spinraza (Nusinersen) Injection [package insert]. Cambridge, MA: Biogen Inc.; 2016. 9. Khvorova A, Watts JK. The chemical evolution of oligonucleotide therapies of clinical
utility. Nat Biotechnol 2017;35:238–248.
10. Van Poelgeest EP, Swart RM, Betjes MGH, et al. Acute kidney injury during therapy with an antisense oligonucleotide directed against PCSK9. Am J Kidney Dis2013;62: 796–800.
11. Mendell J, Al-Zaidy S, Shell R, et al. AVXS-101 phase 1 gene therapy clinical trial in SMA type 1: end-of-study event free survival and achievement of developmental milestones. Neuromuscul Disord 2017;27(Suppl 2):S208.
12. Mendell JR, Al-Zaidy S, Shell R, et al. Single-dose gene-replacement therapy for spinal muscular atrophy. N Engl J Med 2017;377:1713–1722.
13. Ratni H, Ebeling M, Baird J, et al. Discovery of risdiplam, a selective survival of motor neuron-2 (SMN2) gene splicing modifier for the treatment of spinal muscular atrophy (SMA). J Med Chem 2018;61:6501–6517.
14. Rudnik-Sch¨oneborn S, Heller R, Berg C, et al. Congenital heart disease is a feature of severe infantile spinal muscular atrophy. J Med Genet 2008;45:635–638. 15. Simone C, Ramirez A, Bucchia M, et al. Is spinal muscular atrophy a disease of the
motor neurons only: pathogenesis and therapeutic implications? Cell Mol Life Sci 2016;73:1003–1020.
16. Deguise MO, Kothary R. New insights into SMA pathogenesis: immune dysfunction and neuroinflammation. Ann Clin Transl Neurol 2017;4:522–530.
17. Hua Y, Sahashi K, Rigo F, et al. Peripheral SMN restoration is essential for long-term rescue of a severe spinal muscular atrophy mouse model. Nature 2011;478:123–126. 18. Deguise MO, De Repentigny Y, McFall E, Auclair N, Sad S, Kothary R. Immune dysregulation may contribute to disease pathogenesis in spinal muscular atrophy mice. Hum Mol Genet 2017;26:801–819.
19. Anhuf D, Eggermann T, Rudnik-Sch¨oneborn S, Zerres K. Determination of SMN1 and SMN2 copy number using TaqManTMtechnology. Hum Mutat 2003;22:74–78.
20. Eshraghi M, McFall E, Gibeault S, Kothary R. Effect of genetic background on the phenotype of theSmn 2B/-mouse model of spinal muscular atrophy. Hum Mol Genet 2016;25:4494–4506.
21. Oh Y. The insulin-like growth factor system in chronic kidney disease: pathophysi-ology and therapeutic opportunities. Kidney Res Clin Pract 2012;31:26–37. 22. Hijikata Y, Hashizume A, Yamada S, et al. Biomarker-based analysis of preclinical
progression in spinal and bulbar muscular atrophy. Neurology 2018;90:e1501–e1509. 23. Mulay SR, Shi C, Ma X, Anders HJ. Novel insights into crystal-induced kidney injury.
Kidney Dis (Basel) 2018;4:49–57.
24. Luciano RL, Perazella MA. Crystalline-induced kidney disease: a case for urine mi-croscopy. Clin Kidney J 2015;8:131–136.
25. Vezzoli G, Terranegra A, Rainone F, et al. Calcium-sensing receptor and calcium kidney stones. J Transl Med 2011;9:201.
26. Ba J, Brown D, Friedman PA. Calcium-sensing receptor regulation of PTH-inhibitable proximal tubule phosphate transport. Am J Physiol Physiol 2003;285:F1233–F1243. 27. Iida T, Fujinaka H, Xu B, et al. Decreased urinary calbindin 1 levels in proteinuric rats and humans with distal nephron segment injuries. Clin Exp Nephrol 2014;18: 432–443.
28. Jones J, Gockerman A, Busby W, et al. Insulin-like growth factor binding protein 1 stimulates cell migration and binds to the alpha5beta1 integrin by means of its Arg-Gly-Asp sequence. EMBO J 1993;90:10553–10557.
29. Doublier S, Seurin D, Fouqueray B, et al. Glomerulosclerosis in mice transgenic for human insulin-like growth factor-binding protein-1. Kidney Int 2000;57:2299–2307. 30. Modric T, Silha JV, Shi Z, et al. Phenotypic manifestations of insulin-like growth factor-binding protein-3 overexpression in transgenic mice. Endocrinology 2001;142: 1958–1967.
31. Flyvbjerg A, Kessler U, Dorka B, Funk B, Ørskov H, Kiess W. Transient increase in renal insulin-like growth factor binding proteins during initial kidney hypertrophy in experimental diabetes in rats. Diabetologia 1992;35:589–593.
32. Shinada M, Akdeniz A, Panagiotopoulos S, Jerums G, Bach LA. Proteolysis of insulin-like growth factor-binding protein-3 is increased in urine from patients with diabetic nephropathy. J Clin Endocrinol Metab 2000;85:1163–1169.
33. Swoboda KJ. Romancing the spliceosome tofight spinal muscular atrophy. N Engl J Med 2014;371:1752–1754.
34. Jangi M, Fleet C, Cullen P, et al. SMN deficiency in severe models of spinal muscular atrophy causes widespread intron retention and DNA damage. Proc Natl Acad Sci 2017;114:E2354–E2356.
Appendix (continued)
Name Location Role Contribution
Abdurrahman W. Muhtaseb Massachusetts General Hospital, Boston, MA
Author Performed experiments; participated in the data interpretation; and reviewed and approved the final manuscript.
Pann Nwe Massachusetts General Hospital, Boston, MA
Author Performed experiments; collected clinical data; participated in the data interpretation; and reviewed and approved the final manuscript.
Alec J. Johnstone Massachusetts General Hospital, Boston, MA
Author Performed experiments; collected clinical data; participated in the data interpretation; and reviewed and approved the final manuscript.
Ren Zhang Massachusetts General Hospital, Boston, MA
Author Performed experiments; collected clinical data; participated in the data interpretation; and reviewed and approved the final manuscript.
Maryam Fatouraei Massachusetts General Hospital, Boston, MA
Author Performed experiments; participated in the data interpretation; and reviewed and approved the final manuscript.
Natassja Huemer Massachusetts General Hospital, Boston, MA
Author Performed experiments; participated in the data interpretation; and reviewed and approved the final manuscript.
Christiano R.R. Alves Massachusetts General Hospital, Boston, MA
Author Analyzed the data; wrote the manuscript; participated in the data interpretation; and reviewed and approved the final manuscript.
Rashmi Kothary
University of Ottawa, Canada
Author Performed mouse experiments; participated in the data interpretation; and reviewed and approved the final manuscript.
Kathryn J. Swoboda Massachusetts General Hospital, Boston, MA
Author Directed the research project and designed experiments; collected clinical data; wrote the manuscript; participated in the data interpretation; and reviewed and approved the final manuscript.
DOI 10.1212/NXG.0000000000000353
2019;5;
Neurol Genet
Flávia C. Nery, Jennifer J. Siranosian, Ivy Rosales, et al.
Impaired kidney structure and function in spinal muscular atrophy
This information is current as of August 12, 2019
Services
Updated Information &
http://ng.neurology.org/content/5/5/e353.full.html
including high resolution figures, can be found at:
References
http://ng.neurology.org/content/5/5/e353.full.html##ref-list-1
This article cites 33 articles, 1 of which you can access for free at:
Subspecialty Collections
http://ng.neurology.org//cgi/collection/muscle_disease
Muscle disease
http://ng.neurology.org//cgi/collection/all_neuromuscular_disease
All Neuromuscular Disease
http://ng.neurology.org//cgi/collection/all_medical_systemic_disease
All Medical/Systemic disease following collection(s):
This article, along with others on similar topics, appears in the
Permissions & Licensing
http://ng.neurology.org/misc/about.xhtml#permissions
its entirety can be found online at:
Information about reproducing this article in parts (figures,tables) or in
Reprints
http://ng.neurology.org/misc/addir.xhtml#reprintsus
Information about ordering reprints can be found online:
reserved. Online ISSN: 2376-7839.
Published by Wolters Kluwer Health, Inc. on behalf of the American Academy of Neurology.. All rights an open-access, online-only, continuous publication journal. Copyright Copyright © 2019 The Author(s).