International Journal of Engineering Vol. 14, No. 1, February 2001 – 1
COMPARISON OF MASS-TRANSFER EFFICIENCIES OF
SCC AND STRUCTURED PACKING
M. Zivdar
Department of Chemical Engineering, Sistan and Bluchestan University Zahedan 98164, Iran, [email protected]
T. A. G. Langrish and R. G. H. Prince
Department of Chemical Engineering,The University of Sydney Sydney, NSW 2006, Australia
(Received: June 27, 1997 – Accepted in Revised Form: March 14, 2000)
Abstract In a previous paper, pressure drop, flooding and mass-transfer characteristics of a novel pilot-scale distillation column called spinning cone column (SCC) were presented. Here, we present the result of comparison of mass-transfer efficiencies of SCC and structured packing. Comparison of SCC and structured packing mass-transfer characteristics show that the gas and liquid-side height of transfer units (HTUs) of the SCC are on the average 20% and 50% lower than the corresponding values for structured packing respectively. This in turn results in lower HETPs of the SCC for practical applications. Predicted HETPs in ethanol distillation using SCC are 30% lower than those of structured packing. Predicted HETPs for fusel oil and orange oil distillations are also 45% and 35% lower respectively than the experimental values obtained for structured packing. From these results, it is concluded that SCCs are more efficient with respect to mass-transfer than this particular structured packing, but to draw a general conclusion, more specific data on pressure drop per NTS, and liquid hold-up and residence time of the two columns should be available.
Key Words Spinning Cone Column, Mass-Transfer Efficiency, Pressure Drop, Flooding, Structured Packing, Food Flavor, Distillation
ﻩﺪﻴﻜﭼ
ﻥﻮﺘﺳ ﻡﺎﻧ ﻪﺑ ﺪﻳﺪﺟ ﺮﻴﻄﻘﺗ ﻩﺎﮕﺘﺳﺩ ﻚﻳ ﻡﺮﺟ ﻝﺎﻘﺘﻧﺍ ﻭ ﻥﺎﻴﻐﻃ ،ﺭﺎﺸﻓ ﺖﻓﺍ ﻱﺎﻬﻴﮔﮋﻳﻭ ،ﻲﻠﺒﻗ ﻪﻟﺎﻘﻣ ﺭﺩ ﭼﻲﻃﻭﺮﺨﻣ ﻥﺎﺧﺮ
)
ﻲﺳﻲﺳﺱﺍ (
ﺪﺷﻪﺋﺍﺭﺍﺕﻮﻠﻳﺎﭘﺱﺎﻴﻘﻣﺭﺩ .
ﻦﻳﺍﻡﺮﺟﻝﺎﻘﺘﻧﺍﻲﻫﺩﺯﺎﺑﻪﺴﻳﺎﻘﻣﺞﻳﺎﺘﻧﻪﻟﺎﻘﻣﻦﻳﺍﺭﺩ
ﺩﻮﺷﻲﻣﻪﺋﺍﺭﺍﻢﻈﻨﻣﻱﺎﻫﻪﻨﻛﺁﺎﺑﻩﺪﺷﺮﭘﻱﺎﻬﺟﺮﺑﺎﺑﺎﻬﺟﺮﺑ .
ﻦﻳﺍﻩﺪﻨﻫﺪﻧﺎﺸﻧﺝﺮﺑﻭﺩﺭﺩﻝﺎﻘﺘﻧﺍﻞﺣﺍﺮﻣﻉﺎﻔﺗﺭﺍﻪﺴﻳﺎﻘﻣ
ﺮﭼﻲﻃﻭﺮﺨﻣﻥﻮﺘﺳﻱﺎﻬﺟﺮﺑﺭﺩﻝﺎﻘﺘﻧﺍﻞﺣﺍﺮﻣﻉﺎﻔﺗﺭﺍﻂﺳﻮﺘﻣﺭﻮﻄﺑﻪﻛﺖﺳﺍ ﺐﻴﺗﺮﺗﻪﺑﻊﻳﺎﻣ ﻭﺯﺎﮔﺯﺎﻓ ﺭﺩﻭﻥﺎﺧ
20 % ﻭ 50 % ﻉﺎﻔﺗﺭﺍﺶﻫﺎﻛﺚﻋﺎﺑﺩﻮﺧﻪﺑﻮﻧﻪﺑﺮﻣﺍﻦﻳﺍﻪﻛ؛ﺖﺳﺍﻢﻈﻨﻣﻩﺪﺷﺮﭘﻱﺎﻬﺟﺮﺑﻱﺍﺮﺑﻪﺑﺎﺸﻣﺮﻳﺩﺎﻘﻣﺯﺍﺮﺘﻤﻛ
ﻲﻟﺩﺎﻌﺗﻲﻨﻴﺳ ﻚﻳﺎﺑﻝﺩﺎﻌﻣ )
ﻲﭘ ﻲﺗﻱﺍﭺﺍ (
ﺩﻮﺷﻲﻣﻥﺎﺧﺮﭼﻲﻃﻭﺮﺨﻣﻥﻮﺘﺳﻱﺎﻬﺟﺮﺑﺭﺩ .
ﻲﭘ ﻲﺗﻱﺍ ﭺﺍﺮﻳﺩﺎﻘﻣ
ﺏﺁﺮﻴﻄﻘﺗﻱﺍﺮﺑﻩﺪﻣﺁﺖﺳﺪﺑ /
ﻝﻮﻧﺎﺗﺍ ،ﻲﺳﻲﺳﺱﺍﻂﺳﻮﺗ 30
%
ﺖﺳﺍﻢﻈﻨﻣﻩﺪﺷﺮﭘﻱﺎﻬﺟﺮﺑﺯﺍﺮﺘﻤﻛ .
ﭺﺍﺮﻳﺩﺎﻘﻣ
ﺐﻴﺗﺮﺗﻪﺑﻝﺯﻮﻴﻓﻦﻏﻭﺭﻭﻝﺎﻘﺗﺮﭘﻦﻏﻭﺭﻱﺎﻬﻤﺘﺴﻴﺳﻱﺍﺮﺑﻲﺳﻲﺳﺱﺍﺝﺮﺑﻂﺳﻮﺗﻩﺪﻣﺁﺖﺳﺪﺑﻲﭘﻲﺗﻱﺍ 35
% ﻭ
45 %
ﺖﺳﺍﻢﻈﻨﻣﻱﺎﻫﻪﻨﻛﺍﺎﺑﻩﺪﺷﺮﭘﺝﺮﺑﻂﺳﻮﺗﻲﻫﺎﮕﺸﻳﺎﻣﺯﺁﻩﺪﻣﺁﺖﺳﺪﺑﺮﻳﺩﺎﻘﻣﺯﺍﺮﺘﻤﻛ .
ﻦﻴﻨﭼﻪﺴﻳﺎﻘﻣﻦﻳﺍﺯﺍ
ﮔﻪﺠﻴﺘﻧ ﻪﻨﻛﺁﺎﺑﻩﺪﺷﺮﭘﻱﺎﻬﺟﺮﺑﺯﺍﺮﺗﺍﺭﺎﻛﻡﺮﺟﻝﺎﻘﺘﻧﺍﻲﻫﺩﺯﺎﺑﺮﻈﻧﻪﻄﻘﻧﺯﺍﻲﺳﻲﺳﺱﺍﻱﺎﻬﺟﺮﺑﻪﻛﺩﻮﺷﻲﻣﻱﺮﻴ ﺭﺩﻊﻳﺎﻣﻲﮔﺪﻧﺎﻣﻭﺭﺎﺸﻓﺖﻓﺍﻩﺭﺎﺑﺭﺩﻱﺮﺘﺸﻴﺑﺕﺎﻋﻼﻃﺍ،ﻪﻨﻴﻣﺯﻦﻳﺍﺭﺩﻞﻣﺎﻛﻱﺮﻴﮔﻪﺠﻴﺘﻧﻚﻳﻱﺍﺮﺑﺎﻣﺍ؛ﺖﺳﺍﻢﻈﻨﻣ
ﺖﺳﺍﻡﺯﻻﺝﺮﺑﻭﺩ .
INTRODUCTION
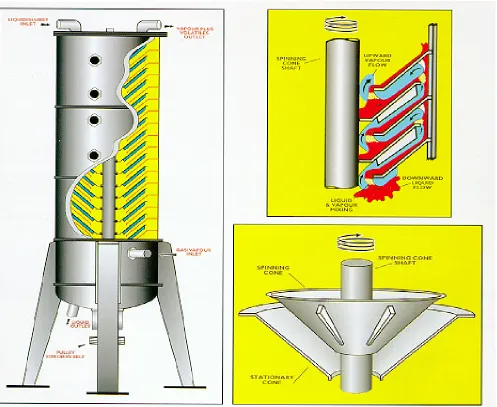
Figure 1 shows a schematic diagram of the SCC.
The spinning cone column (SCC) is a gas-liquid
Figure 1. Schematic diagram of the SCC (Figure provided by Flavourtech ).
film of liquid. Liquid flows down the upper surfaces of the stationary cones under the influence of gravity and moves up the upper surfaces of the rotating cones in a thin film by the action of the applied centrifugal force. Vapour flows up the column, traversing the successive fixed and rotating cones.
Pressure drop, flooding and mass-transfer characteristics of a pilot-scale SCC have been presented in the previous paper by Zivdar et al. [1]. Flooding data were compared with the data taken from a laboratory-sized SCC and an
industrial-scale SCC. It was shown that a single packing factor (see appendix A) can bring flooding data of these SCCs into a single curve, where plotted in a Sherwood-Leva-Eckert (SLE) diagram. The packing factor was not obtained experimentally but calculated from the definition of packing factor, which is the ratio of the wetted area by the volume. Ethanol/water and acetic acid/ethanol/water were used as a test mixture in measuring the mass-transfer efficiency of the column, expressed as Murphree vapour efficiency, EMV, (see appendix B
International Journal of Engineering Vol. 14, No. 1, February 2001 - 3 0
0 . 1 0 . 2 0 . 3 0 . 4 0 . 5 0 . 6
0 0 . 1 0 . 2 0 . 3 0 . 4
L i q u i d L o a d ( k g / s )
HTU
Liquid
(m)
S P S C C
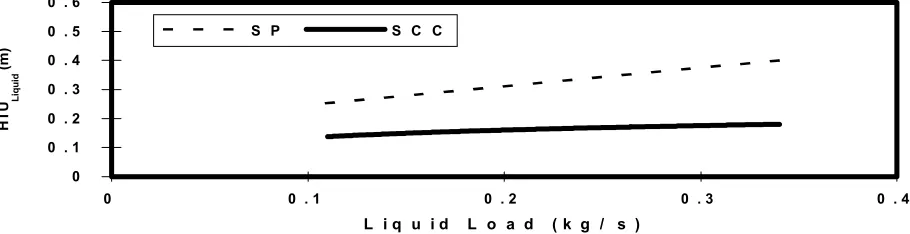
Figure 2. Comparison of liquid-side HTUs of the two columns.
0 0 . 1 0 . 2 0 . 3 0 . 4 0 . 5
0 0 . 2 0 . 4 0 . 6 0 . 8 1 1 . 2 1 . 4
G a s F F a c t o r ( m / s ( k g / m 3)0 . 5)
HTU
G
(m)
S C C S P
Figure 3. Comparison of gas-side HTUs of the two columns.
obtained was from 5% to 20% and 3% to 8% respectively for the ethanol/water and acetic acid/ethanol/water test mixtures. These efficiencies were lower than expected, which were attributed to the construction and maintenance of this particular SCC. VLE data for the calculations of efficiency were selected by extensive analysis of the data reported in the literature by thermodynamic consistency tests [11].(See appendix C for details). Factors influencing the performance of the SCC were also discussed.
RESULTS AND DISCUSSION
Gas and Liquid-Side Mass-Transfer Coefficients
Comparison has been made in order to relate mass-transfer characteristics of structured packing to the predictions from the SCC. The individual transfer coefficients of the SCC were taken from Desho
et al. [2] and Prince et al. [3], where experimental gas and liquid-side transfer coefficients of the SCC were measured by humidification of air and desorption of oxygen respectively. It should be pointed out that the SCC data were taken at RPM=550, the most common value used in practice.
0 0.05 0.1 0.15 0.2 0.25 0.3 0.35 0.4
0 0.2 0.4 0.6 0.8 1 1.2
Gas F Factor
HETP (m)
SCC (Pred.) SP (Exp.)
Figure 4. Comparison of HETPs of structured packing and SCC in ethanol/water distillation.
0 0.1 0.2 0.3 0.4 0.5 0.6
0 0.2 0.4 0.6 0.8
Gas F Factor
HETP (m)
SCC (Prediction) SP (Exp.)
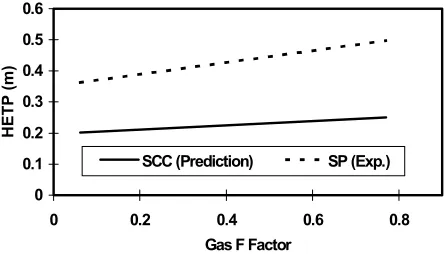
Figure 5. Comparison of HETPs in SP and SCC for distillation of fusel oil.
The comparison of the gas-side HTUs of the two columns shows different trends. The structured packing trend as explained by Zivdar et al. [4] is related to the gauze-type nature of the structured packing, which shows an increase in interfacial area with an increase in gas load. The comparison shows that gas-side HTUs of the SCC are on the average 20% lower than those of structured packing, however, both columns show comparable gas-side HTUs at F factor of about 1.2. This is related to the increase in the mass-transfer area of the structured packing at high gas loads.
Ethanol Distillation
Experimental HETPsfrom ethanol/water distillation, (Zivdar [5]), using structured packing were compared to the predictions using the SCC’s individual phase
mass-transfer data. Figure 4 illustrates the HETP as a function of the gas F factor for ethanol/water distillation. The HETPs of the SCC are on the average 30% lower than those of structured packing. This is expected, because individual gas and liquid-side transfer coefficients of the SCC were lower than those of the structured packing, however, the comparison again shows comparable HETPs at a gas F factor of about 1.1.
Fusel Oil Distillation
Fusel oil is a by-productof the distillation step in ethanol manufacturing. It is mainly composed of higher alcohols. It is an undesirable fraction, and is removed from the products, but one of the components of fusel oil, 2-methyl-butanol, is a valuable product. The process of separating 2-methyl-butanol from fusel oil is carried out in two steps. The first step is to separate 2-methyl-butanol, 3-methyl-butanol and other heavier components from lighter components. Then, 2-methyl-butanol is separated from 3-methyl-butanol. The latter separation is difficult because these two components have a similar chemical structure and physical properties. Figure 5 illustrates the variation of the HETP against the gas F factor for the two columns in fusel oil distillation. The predicted HETPs of the SCC are on average 45% lower than those of structured packing. This means that for the same separation, the required column height for the SCC is nearly half that required by structured packing. This makes the separation of the 2, 3-methyl-butanol more feasible practically.
Orange Oil Distillation
Orange oil is obtainedInternational Journal of Engineering Vol. 14, No. 1, February 2001 - 5
0 0.05 0.1 0.15 0.2 0.25 0.3 0.35 0.4 0.45
0 0.05 0.1 0.15 0.2 0.25 0.3
Gas F Factor
HETP (m)
SCC (Pred.) SP (Exp.)
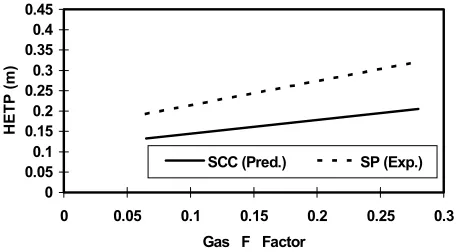
Figure 6. Comparison of HETPs of structured packing and SCC in orange oil distillation.
In order to reduce the problem of oxidation and produce more stable oil during storage, some or all of the terpenes should be removed. This is usually done by vacuum distillation under conditions leading to some loss of desirable material, particularly octanal and lighter components. We therefore investigated whether the high separation capability of structured packing under vacuum (high number of stages per unit pressure drop) would allow a sharper separation of the flavour compounds, octanal, from the terpenes, limonene. Figure 6 illustrates the variation of the HETP against the gas F factor for the two columns in orange oil distillation. The HETPs of the SCC are on average 35% lower than those for structured packing. It should be pointed out that, for orange oil distillation, both the gas and liquid-side contribute nearly equal resistance to mass-transfer, while in the ethanol and fusel oil distillations, most of the resistance comes from the gas-side.
CONCLUSIONS
Pressure drop, flooding and mass transfer characteristics of spinning cone column have been studied, (Zivdar et al. [1]). From the results obtained it was concluded that Sherwood-type diagrams for representing flooding data are a reliable tool for predicting the capacity of the SCC, and these diagrams can then be used for the
design of new columns with respect to capacity, using an appropriate packing factor. The distillation (Murphree) efficiencies were lower than expected, due to construction and maintenance features of this particular column. However the trends with changing variables fitted our knowledge of these columns; efficiency increased with rotational speed, and decreased with increasing entrainment due to higher vapour rates.
The comparison of SCC and structured packing mass-transfer characteristics revealed that the gas and liquid-side HTUs of the SCC are on the average 20% and 50% lower respectively than the corresponding values for the structured packing. This in turn results in lower HETPs of the SCC for practical applications. Predicted HETPs in ethanol distillation using SCC are 30% lower than those for structured packing. Predicted HETPs for fusel oil and orange oil distillations are 45% and 35% lower respectively than experimental values obtained for structured packing.
ACKNOWLEDGMENT
The authors wish to thank Mr. J. Sellahewa, Dr. F. Withfield, and J. Culhane of CSIRO Food Research Laboratories for providing experimental and analytical facilities. Special thanks to S. Choro and B. Gao for assisting in analytical measurements. The financial support of the Ministry of Culture and Higher Education of Iran to M. Zivdar is greatly appreciated. Part of the work was supported by an Australian Research Council grant.
NOMENCLATURE
EMV
Murphree vapour efficiency.F
Gas F factor, =UG(ρ
G)0.5, m/s(kg/m
3)
0.5.
HETP Height Equivalent to Theoretical Plate, m. HTU Height of Transfer Unit, m.RPM Revolution per minute.
yn
Actual vapour mole fraction leaving stage n.yn
* Vapour mole fraction in equilibrium with the liquidon plate n.
Subscripts
L Liquid G Gas
SCC Spinning Cone Column. SP Structured Packing.
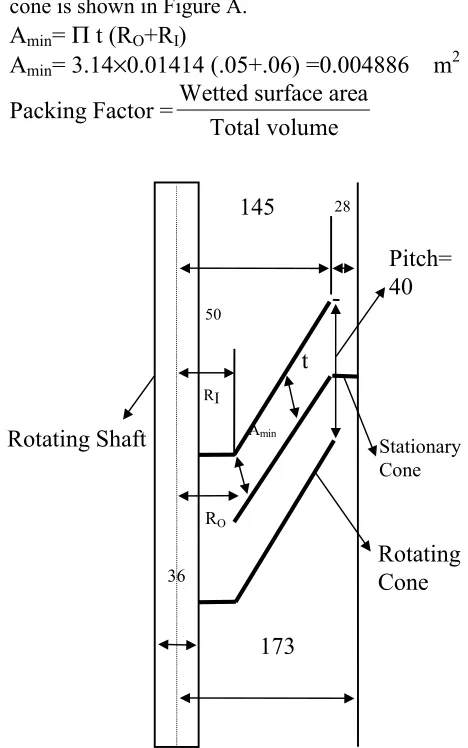
APPENDIX A: MINUMUM FLOW AREA AND PACKING FACTOR CALCULATIONS
A schematic diagram of a rotating and stationary cone is shown in Figure A.
Amin=
Π
t (RO+RI)
Amin= 3.14
×
0.01414 (.05+.06) =0.004886 m
2Packing Factor =
Wetted surface area
Total volume
Figure A: Schematic diagram of the spinning cone column. All units in mm.
Area of a stationary cone =
Π( . . ) Π( . . ) .
0 145 0 05
0 173 0 145 0 117
2 2
2 2
− + − =
Sin45
m
2
Area of a rotating cone =
Π( .0 0 52 0 0 3 6. 2) Π( .0 1 4 5 0 0 5. ) 0 0 9 5.
2 2
− + S in 4 5− =
m
2Total surface area = 30×(0.117+0.095)=6.36 m2
Packing factor = 6.36/(1.2×Π×0.1732) = 56.4 m-1
Note that the number of cones is 30 and the column height is 1.2 m.
After dismantling the column the pitch was
measured accurately and based on this value
new minimum flow area was calculated.
Amin,new= 3.14×0.0849 (0.05+0.056)=0.00283 m2
Percent reduction in flow area = ( 1 -0.00283/0.004886 ) ×100 = 42%
Please note that the pitch for the second case was measured 24mm.
APPENDIX B: MURPHREE VAPOUR EFFICIENCY CALCULATION
McCabe-Thiele method was used for binary
steam-stripping calculations. A computer
program was written which takes into account
the effect of heat loss on the vapour and liquid
flow rates at each stage in the column, and
applies a Murphree vapour efficiency so that
the output of the calculation matches the
experimental data.
Murphree vapour efficiency is defined as:
EMV = (yn-yn-1)/(y
*n-yn-1)(B.1)
It is a measure of deviation from ideal
equilibrium behaviour of vapour streams
145
2850
173
36Amin
RI
RO
Rotating
Cone
Stationary ConeRotating Shaft
Pitch=
40
International Journal of Engineering Vol. 14, No. 1, February 2001 - 7
leaving each tray, e.g., a Murphree vapour
efficiency of one means that the vapour
leaving the tray is in equilibrium with the
liquid leaving the same tray.
Heat loss from the column has a significant
effect on the slope of the operating line at each
stage. As a result of heat loss from the column,
the vapour rate is going to decrease as the
vapour flows from the bottom to the top of the
column. In addition, the liquid is going to
increase down the column due to the addition
of condensed vapour. If we define “Internal
Reflux”, Z, to be the total moles of vapour
condensing on the inside wall of the column
with 30 actual stages, we can write
Vn= Vtop + [(30-n)/30] Z
(B.2)
Ln= Ltop + [(30-n)/30] Z
(B.3)
where:
Vn = the vapour molar flow rate at stage n (n =
1 is bottom stage),
Ln = the liquid molar flow rate at stage n,
Vtop
= vapour flow rate at the top of the
column (equivalent to distillate molar flow
rate),
Ltop = liquid flow rate at the top of the column
(equivalent to feed molar flow rate).
From
McCabe-Thiele
analysis,
the
operating line is given by
xn+1 = xn + Vn/Ln (yn-yn-1)
(B.4)
Substitution from Equations B.1, B.2 and B.3
results in
xn+1 = xn +
D
n
n
Z
F
n
n
Z
+
−
+
−
30
30
[EMV(y*n-yn-1)] (B.5)where:
D= molar flow rate of distillate,
F= molar flow rate of the feed.
We can then calculate the liquid
composition on each stage by calculating each
stage in sequence starting at the bottom of the
column, with the following starting values:
n = 1 ; yn-1 = y0 = 0
xn = xB = measured bottom mole fraction of
ethanol.
By using the above equations, the Murphree
vapour efficiency was altered until the
calculated distillate compositions matched
those that were measured experimentally.
Multicomponent tray by tray calculations,
starting from the bottom, were used for ternary
mixture calculations. In this case Murphree
vapour efficiency for the two components have
to be specified and altered until the distillate
compositions match those obtained
experimentally.
APPENDIX C: THERMODYNAMIC CONSISTENCY TESTS
D =
A
B
A
B
' '
' '
〈 − 〉
+
×
100 (C.1)
150 T
T = J
MIN MAX〉×
∆
〈
(C.2)
A' and B' are the area above and below the x-axis, where plot of ln γ1/γ2 vs. X has been sketched. This
test is exclusive to isobaric VLE data.
For the ethanol/ water system the data published by Stabnikov [9] is recommended. This data includes data for very dilute ethanol concentration.
For acetic acid/ water binary mixture the data published by Chalov [10] or the use of recommended parameters published in DECHEMA [11] is recommended.
For the system acetic acid/ ethanol, the data published by Amezagas [12] is recommended.
REFERENCES
1. Zivdar, M., Langrish, T. A. G. and Prince, R. G. H., 5th
ational & 4th International Chem. Eng. Cong.,CD Rom, Shiraz, Iran, No. 140, (2000), 2.250-2.259. 2. Desho, S. Y., Langrish, T. A. G. Prince, R. G. H.,
Chemeca 94, 2, 205, EA Books, Sydney, (1994), 238-246.
3. Prince, R. G. H., Desho, S., Langrish, T. A. G., I. Chem. E. Symp. Series, 769-781, Netherlands,(1997).
4. Zivdar, M., Gao, B., Langrish, T. A. G. and Prince, R. G. H., Chemeca 96, 1, 55-60, EA Books, Sydney, (1996).
5. Zivdar, M., PhD. Thesis, The University of Sydney, (1998).
6. Maarse, H., Volatile Compounds in Food and Beverages, Mrcel Dekker, Inc., (1991).
7. VanNess, H. C., AICHE J., 19, 238, (1973), 345-350. 8. Redlich, O., Ind. & Eng. Chem., 40, 345, (1948),
49-53.
9. Stabnikov, V. N., Pishch Prom, (Keiv), 15, 49, (1972), 10-12.
10. Chalov, N. V., Gidroliz Lesokhim Prom-St, 10, 10, (1957), 569-571.
11. Gmehling, J., Dechema, Vol. 1, Part 1b (Suppl. 2), (1987).