International Journal of Engineering
J o u r n a l H o m e p a g e : w w w . i j e . i r
Dimensionality Reduction and Improving the Performance of Automatic Modulation
Classification using Genetic Programming
A. Latif*, K. Hessampour
Electrical and Computer Engineering Department, Yazd University, 89195741, Yazd, Iran
P A P E R I N F O
Paper history: Received 02 August 2013
Received in revised form 18 October 2013 Accepted 07 November 2013
Keywords:
Modulation Automatic Detection Genetic Programming Entropy
Multi-layer Neural Network Perceptron Decision Tree
A B S T R A C T
This paper shows how we can make advantage of using genetic programming in selection of suitable features for automatic modulation recognition. Automatic modulation recognition is one of the essential components of modern receivers. In this regard, selection of suitable features may significantly affect the performance of the process. Simulations were conducted with 5db and 10db SNRs. Test and training data released from real ones were recorded in an actual communication system. For performance analyzing of the proposed method, a set of experiments were conducted considering signals with 2PSK, 4PSK, 2FSK, 4FSK, 16QAM and 64 QAM modulations. The results show that the selected features by the model improve the performance of automatic modulation recognition substantially. During our experiments, we also reached the suitable values and forms for mutation and crossover ratio, fitness function as well as other parameters for the proposed model.
doi:10.5829/idosi.ije.2014.27.05b.05
1. INTRODUCTION1
Modulation plays an important part in electronic
communication systems. In electronics and
telecommunications, modulation is the process of varying one or more properties of a high frequency periodic waveform which is called carrier signal [1]. One of the newest research topics in modern communication is automatic modulation recognition. In modern receivers automatic modulation recognition is considered to be a necessary component. Recently, modulation classification is also widely used in military applications. In electronic warfare systems, this classification is used as an information source for receiving signals of enemy’s communication systems [2]. In civilian application, it is mostly used in frequency management, transmitter monitoring and unauthorized transmitter detection.
Modulation recognition is an important step between signal detection and the demodulation. In non-cooperative environments, it is hardly possible to detect
*Corresponding Author Email: [email protected] (A. Latif)
the applied modulation because only little information is available in the input signal.
Automatic modulation classification is accomplished in two main steps; preprocessing of the input signal, and selection of classification method. The second step is divided into two groups. The first is maximum likelihood approach. Likelihood base classifiers are optimal in the Bayesian sense, as they minimize the probability of classification error [3]. Likelihood approaches are composite hypothesis testing problems in which classification is performed by searching for the maximum a posteriori probability P(Hi|r(t)), or equivalently P(r(t)|Hi), given equally likely
modulation schemes; that is,
) | ) ( ( log max arg ˆ
i
H P r t H
H
i
= (1)
where r(t) is a function of the transmitted data, signal parameters (such as the symbol interval), the impulse response of the channel, and the noise distribution.
The latter is statistical pattern recognition approach. In this approach, first some features of the signal are extracted using mathematical methods and then the
classification would be accomplished. This approach has more diversity than the first method. Nothing is worth that generally modulation recognition methods are only applicable to some of the variants modulation. Considering above mentioned methods, the statistical ones require less computation, instead the signal features which are selected must resistant against non-ideal signal parameters [4].
Nandi and Wong have used artificial neural network and genetic algorithm for automatic modulation recognition [5]. Zhu, Aslam and Nandi have used
Genetic Programming (GP) and K-nearest
neighborhood for modulations classification [3]. Neshatian and Zhang have used GP for dimensionality reduction and performance improvement of standard data mining data sets [6, 7]. In this paper, it is tried to use GP intelligence selection of input features. However, this selection is done in such a way that the features number will be equal to output modulation number. Entropy concept was used for compute fitness function.
The structure of this paper is organized as follow. In section 2, signal model and signal statistical specifications have been described. The main structure of algorithm producing initial features of GP and GP structure have been introduced in section 3. In section 4, performance evaluation and result analyzing have been presented. Finally, the conclusions have been shown in section 5.
2. DATA AND MATERIAL
2. 1. Signal Model and Features For most communication systems the baseband wave form in receivers is considered as Equation (2):
å
¥ -¥ =+
+ + -=
l
T nT f j
n g T lT nT h l x
Ae n
y n
) ( ) (
) ( )
( (2 0 )
e
q p
(2)
where x(l) is symbols sequence, A is amplitude, T is symbols interval, eT is time regulation error or sampling phase error in filter output, f0 is deviation of
receiver oscillator frequency from carrier signal, h(×) is baseband channel specification, qn is carrier signal
phase deviation from receiver oscillator and g(n) is additive white Gaussian noise .
In this paper, it is assumed that the working conditions is ideal and only Gaussian noise presents, the channel compensation was done, and the channel effects can be neglected.
2. 2. Features In this paper, statistical pattern recognition approach was used for modulation automatic detection. So a set of features are considered as GP search input. These features will be presented in the following section.
2. 2. 1. Key Features gmax The first key feature
which is shown as gmaxpresents the maximum normal
and concentrated spectrum power density for received signal instant amplitude. In accordance with Parseval's theorem, the power spectrum density of a signal equals to its DFT sequence magnitude square. It is presented as follows:
s cn
N i a DFT 2 max
| )) ( ( | max
=
g (3)
1 ) ( ) (i =a i
-acn n (4)
a
n m
i a i
a ()= () (5)
å
=
= Ns
i a N ai m
1
) ( 1
(6)
s
N
is the sample in each part of signal and acn(k) is the normalized instant amplitude and centered related to (s
f k
t= )k=1,2,..., also fs is the sampling frequency of
each part of the signal and ma is the mean value of instant amplitude for each part of the signal.
2. 2. 2. Key Features
s
aps
apis the second key feature which is equal to standard deviation of absolute number of non-linear and concentrated component of received signal instant phase and is defined as follows. In instant phase, when the received signal is higher than threshold value, the absolute standard deviation is defind as follows:2
) ( )
(
2 () 1 | ()|
1
÷÷ ø ö çç
è æ -÷÷ ø ö çç
è æ
=
å
å
ñ
ñ t n t
n a i a
NL a
i
a NL
ap C f i C f i
s (7)
where
f
NL(
i
)
is the instant phase concentrated non-linear component for t so thats
f i
t= and i=1, 2,…., Ns ,
C equals to total samples related to instant phase fNL(i)
which their instant amplitude is higher than the threshold value. an(i) is the amplitude related to phase
) (i
NL
2. 2. 3. Key Features
s
aas
aa is the third key feature which is equal to standard deviation of absolute value of normalized instant amplitude when the received signal is higher than the threshold level.2
1 1
2 1 | |
1 ÷÷ ø ö çç è æ -÷÷ ø ö çç è æ
=
å
å
= = s s N i cn s N i cn s
aa N a N a
s (8)
2. 2. 4. Key Features
s
afs
af is the forth key feature which is equal to standard deviation of normalized instant frequency absolute value when the received signal is higher than the threshold level.2
) ( )
(
2( ) 1 | ( )|
1 ÷ ÷ ø ö ç ç è æ -÷ ÷ ø ö ç ç è æ
=
å
å
ñ
ñ t n t
n a i a
N a
i
a N
af f i
C i f C s (9) so that s f N r m i f i
f ()= ()- (10)
å
=
= Ns
i s
f N f i
m 1 ) ( 1 (11)
where
r
s is the input signal symbol rate.2. 2. 5. Second Order, Forth Order, Sixth Order and Eight Order Cumulants For a complex-valued stationary random process y(n) second order, forth order, sixth order and eight order cumulants based on moments can be calculated according to Equation (12) [8].
3. PURPOSED METHOD
3. 1. Intelligence Features Selection In this method, it is tried to reduce the dimensionality of modulation classification using GP in order to improve the classification performance. In preprocessing step, a diagonal linear transform is applied on main features set. The steps of this operation are as follows [7]. Let us consider the input data set as D (features explained in section 2.2), D=X®C is a transform of main features set into modulation types.
C
is a set of different modulations {c1,c2,…,cm}, and m is the number of different modulations , then goal is to find a new space as D' =Y®C to make the relations between the inputfeature space and modulation types easier. For applying class wise transformation, the training data set should be divided into m parts depending on their modulation types [7]. If each partition is considered as a spherical cloud, then its axial should be placed within modulations boundaries.
{
}
mi i
i x x c D c c where
X = |( , )Î , = È=1 (13)
[
p q q]
pq E y k y k
M M M M M M M M M M M M M M M M M M M M M C M M M M M M M M M M M M M M M M M M M C M M M M M M M M M M M M M M M M C M M M M M M M M M M C M M M M M C M M M M M M M M M M M C M M M M M M M M M M M C M M M M M M M C M M M M C M M M C M M M C M M C M C M C )) ( ( ) ( 96 72 144 96 12 432 144 54 16 18 360 270 30 180 120 90 30 5 540 90 90 240 60 30 20 15 210 210 630 35 420 630 35 18 3 3 12 9 24 6 8 6 30 10 5 30 15 2 | | 3 3 * 21 20 41 2 20 42 2 21 41 20 21 41 2 20 40 2 21 2 20 4 21 4 20 2 41 2 42 2 40 84 84 20 3 21 21 3 20 21 20 40 20 21 42 2 21 41 2 20 41 42 41 41 40 83 83 2 21 2 20 4 20 2 20 42 20 21 41 2 21 40 2 20 40 2 41 42 40 82 82 41 20 21 20 40 21 3 22 41 40 81 81 40 2 20 4 20 2 40 80 80 22 21 20 41 22 43 20 3 21 42 21 63 63 20 2 21 22 2 20 40 22 41 21 42 20 62 62 21 2 20 41 20 40 21 61 61 3 20 40 20 60 60 2 21 2 20 42 42 21 20 40 41 2 20 40 40 21 21 20 20 -= + + -+ + -= -+ + + + -= -+ + + + -= + + + -= + -= + -+ -= + + -= + -= + -= -= -= -= = = (12)
For finding a transform with above mentioned specifications, the data covariance should be diagonal in each part. The ith covariance is computed using Equation (13):
{
}
{ }
{ }
Ti i T
i i
i=E X X -E X E X
å
(14)where
å
i is a n×
n square matrix including featurecovariance depending on samples observed in ith
partition. This covariance matrix can be diagonal using data transform in each partition:
) ( :
, =
å
= i i i
i X where eigen
Y f f (15)
This equation transforms all training dataset but the computation of covariance and eigenvector are based on the data of each partitions. If n is the input space of training dataset, then each transformation will produce n
modulation recognition and consequently the problem dimensions are increased.
This can’t be used without using a suitable selection mechanism. GP search combines these elements for constructing the features of higher levels and uses a ranking function for selecting the features containing more information. The process of terminal sets construction is performed in preprocessing step. Since we have m separate modulations, m´n temporary features will be constructed and added with the main features of reference problem. They constitute the variable set of terminal pool in GP search. The variable number in intermediate buffer is n×(m+1). Dimension is increased in this step but the GP is allowed to find better feature with higher level. During the search process, an entropy-based fitness function is used to select the best features. A suitable fitness function should be able to separate informative and noninformative features. This function is used to classify all solutions in the population. Generally, entropy measurement on a modulation interval is an efficient tool for minimizing the possibility of other modulations occurrence in its interval. This measurement system has two parts: modulation limit and a metric for measuring uncertainty level in the intervals. The entropy of an interval’s data is considered as a criterion for measuring the uncertainty level. Here, Shannon’s entropy is used:
å
Î= C c pI c
H
) ( 1
log2 2
2 (15)
where I is the estimated interval, C is the sum of all modulations, P1(c) is the possibility of modulation c in
interval I which is computed using the occurrence frequency of modulation c in its related interval [7].
The new feature construction problem is formulated as an optimization problem for minimizing the previous equation.
å
ÎC
c I c
p2( )
should be maximized in order to
minimize the H2(I). This suggest that a feature can be
considered suitable if the modulation interval only includes samples from the specific modulation. The steps for evaluating a member of population I for target modulation of t (a feature to separate the t modulation samples) on a training data set S is as follows:
A program is used to transform each sample in S
data set into a transformed set S'. The main features are extracted from the terminals pool and produce a floating digit for each sample. Therefore, S' is one dimension.
An interval in S' including 99% of t modulation samples is considered as suitable interval. All samples of S' within I
t are gathered. Then
å
ÎC
c pI(c)
1
2 is calculated
on the data of that interval. In most samples of an interval which belong to a given modulation, the fitness function’s value is low. In this design, the lower fitness
function improves the program and consequently produces better features. Only one GP run should be performed for each modulation. In each run, the fitness function is only concentrated on a given modulation. At the end of each run, the best evaluated program is selected as the feature of that modulation [7]. Therefore, the features number equals to modulation types in automatic modulation recognition.
4. RESULTS AND ANALYSIS
GPLAB tools were used in this study
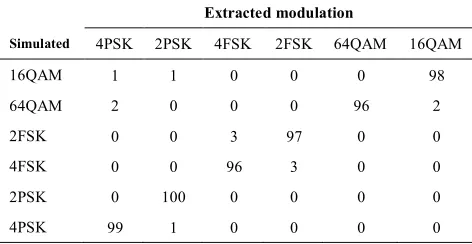
(http://GPlab.sourceforge.net). For evaluating the performance of the purposed method, the signals modulated with 10 db and 5db SNRs and 2PSK, 4PSK, 2FSK, 4FSK, 16QAM and 64 QAM modulations were studied [9]. The automatic modulation recognition involves two parts namely preprocessing and modulation classification. In the first one, the main features should be extracted. For this purpose, 600 different signals which were modulated randomly with one of the given modulations, as well as 4000 sequent samples of each signal sample which were sampled with 80 kHz sampling frequency, were gathered as training data [10]. GP was used to construct new features. The number of this feature equals to output modulations types.Six modulations were studied in this paper. Tree structure was used to present GP output. Each tree produces a floating point as the output. The GP functions set contain four basic operators + ,- ,× , ÷. The ramped half-and-half method was used to generate initial programs and the elitism policy was used to transfer the best parents to the next generation. The population size was 1024 and the maximum tree’s depth when initializing was considered as 6. This can be increased to 12 when running. The evolution process is stopped after 25 generations.The results obtained from signal classification with main and new features (extracted from GP) were compared with each other. Multi-layer neural network perceptron was used as classifier. The 10 fold cross validation method was used for classifiers test. Best results were shown as confusion matrix in the following tables (see Table 1-8). As it can be seen, the performance of multi-layer neural network perceptron and decision tree classifier in 5db and 10 db SNRs were improved considerably using features generated by GP. This is because the GP uses entropy fitness function to find features with higher classifying ability.
5. CONCLUSIONS
TABLE 1. Modulation classification using multi-layer neural network perceptron and extracted features using GP for SNR=10db
Extracted modulation
Simulated 4PSK 2PSK 4FSK 2FSK 64QAM 16QAM
16QAM 1 1 0 0 1 99
64QAM 3 2 0 0 98 0
2FSK 0 0 0 100 0 0
4FSK 1 0 99 0 0 0
2PSK 0 100 0 0 0 0
4PSK 100 0 0 0 0 0
TABLE 2. Modulation classification using multi-layer neural network perceptron and using main features for SNR=10db
Extracted modulation
Simulated 4PSK 2PSK 4FSK 2FSK 64QAM 16QAM
16QAM 1 1 0 0 1 97
64QAM 3 2 0 0 95 0
2FSK 0 0 2 98 0 0
4FSK 1 0 97 1 1 0
2PSK 0 100 0 0 0 0
4PSK 99 1 0 0 0 0
TABLE 3. Modulation classification using decision tree classifier and extracted features using GP for SNR=10db
Extracted modulation
Simulated 4PSK 2PSK 4FSK 2FSK 64QAM 16QAM
16QAM 0 1 0 0 0 99
64QAM 1 0 0 0 98 1
2FSK 0 0 0 100 0 0
4FSK 0 0 99 1 0 0
2PSK 0 100 0 0 0 0
4PSK 100 0 0 0 0 0
TABLE 4. Modulation classification using decision tree classifier and using main features for SNR=10db
Extracted modulation
Simulated 4PSK 2PSK 4FSK 2FSK 64QAM 16QAM
16QAM 1 1 0 0 0 98
64QAM 2 0 0 0 96 2
2FSK 0 0 3 97 0 0
4FSK 0 0 96 3 0 0
2PSK 0 100 0 0 0 0
4PSK 99 1 0 0 0 0
TABLE 5. Modulation classification using multi-layer neural network and extracted features using GP for SNR=5db
Extracted modulation
Simulated 4PSK 2PSK 4FSK 2FSK 64QAM 16QAM
16QAM 0 1 0 0 1 98
64QAM 1 2 0 0 97 0
2FSK 0 0 1 99 0 0
4FSK 1 0 98 0 0 1
2PSK 0 100 0 0 0 0
4PSK 100 0 0 0 0 0
TABLE 6. Modulation classification using multi-layer neural network perceptron and using main features for SNR=5db
Extracted modulation
Simulated 4PSK 2PSK 4FSK 2FSK 64QAM 16QAM
16QAM 1 2 0 0 1 96
64QAM 3 2 0 0 95 0
2FSK 0 0 2 98 0 0
4FSK 1 0 97 1 1 0
2PSK 0 100 0 0 0 0
4PSK 99 1 0 0 0 0
TABLE 7. Modulation classification using decision tree classifier and extracted features using GP for SNR=5db
Extracted modulation
Simulated 4PSK 2PSK 4FSK 2FSK 64QAM 16QAM
16QAM 0 1 0 0 1 98
64QAM 1 2 0 0 97 0
2FSK 0 0 0 100 0 0
4FSK 1 0 98 0 0 1
2PSK 0 100 0 0 0 0
4PSK 100 0 0 0 0 0
TABLE 8. Modulation classification using decision tree classifier and using main features for SNR=5db
Extracted modulation
Simulated 4PSK 2PSK 4FSK 2FSK 64QAM 16QAM
16QAM 1 1 0 0 1 97
64QAM 2 2 0 0 96 0
2FSK 0 0 2 98 0 0
4FSK 1 0 97 1 1 0
2PSK 0 100 0 0 0 0
In this research, by using orthogonal class-wise transformation, we converted the input feature space into more classifiable feature space. The research also reveals that genetic programming using entropy concepts for computation of fitness function can produce informative features. Simulation results with 5db and 10db SNRs signals show that using these features, the accuracy of the multi-layer perceptron and decision tree C4.5 classifier would be improved. Also C4.5 could recognize modulation type better than the MLP classifier. In addition, the number of the produced features would be equal to the desired modulation types.This also shows that our proposed method reduces the dimension of automatic modulation recognition regardless of the input feature space.
6. REFERENCES
1. Carlson, A. B., Crilly, P. and Rutledge, J., "Communication Systems", ISBN 0-07-112175-7, (2002)
2. Al-Jalili, Y., "Identification algorithm of upper sideband and lower sideband SSB signals", Signal Processing, Vol. 42, No. 2, (1995), 207-213.
3. Zhu, Z., Aslam, M. W. and Nandi, A. K., "Augmented genetic programming for automatic digital modulation classification", in
Machine Learning for Signal Processing (MLSP), IEEE International Workshop on, IEEE. (2010), 391-396.
4. Wong, M. and Nandi, A. K., "Semi-blind algorithms for automatic classification of digital modulation schemes", Digital
Signal Processing, Vol. 18, No. 2, (2008), 209-227.
5. Wong, M. D. and Nandi, A. K., "Automatic digital modulation recognition using artificial neural network and genetic algorithm", Signal Processing, Vol. 84, No. 2, (2004), 351-365. 6. Zhang, L., Jack, L. B. and Nandi, A. K., "Extending genetic programming for multi-class classification by combining k-nearest neighbor", in Acoustics, Speech, and Signal Processing, Proceedings.(ICASSP'05). IEEE International Conference on, IEEE. (2005), v/349-v/352 Vol. 5.
7. Neshatian, K. and Zhang, M., "Genetic programming for performance improvement and dimensionality reduction of classification problems", in Evolutionary Computation, CEC (IEEE World Congress on Computational Intelligence). IEEE Congress on, (2008), 2811-2818.
8. Swami, A. and Sadler, B. M., "Hierarchical digital modulation classification using cumulants", Communications, IEEE
Transactions on, Vol. 48, No. 3, (2000), 416-429.
9. Wong, M. and Nandi, A., "Automatic digital modulation recognition using spectral and statistical features with multi-layer perceptrons", in Signal Processing and its Applications, Sixth International, Symposium on. 2001, IEEE. Vol. 2, (2001), 390-393.
10. Nandi, A. K. and Azzouz, E. E., "Algorithms for automatic modulation recognition of communication signals",
Communications, IEEE Transactions on, Vol. 46, No. 4,
(1998), 431-436.
Dimensionality Reduction and Improving the Performance of
Automatic Modulation Classification using Genetic Programming
RESEARCH NOTE
A. Latif, K. Hessampour
Electrical and Computer Engineering Department, Yazd University, 89195741, Yazd, Iran
P A P E R I N F O
Paper history: Received 02 August 2013
Received in revised form 18 October 2013 Accepted 07 November 2013
Keywords:
Modulation Automatic Detection Genetic Programming Entropy
Multi-layer Neural Network Perceptron Decision Tree
هﺪﯿﮑﭼ
ا ﻦﯾ ﻣنﺎﺸﻧﻪﻟﺎﻘﻣ ﯽ
ﺪﻫد ﻣﻪﻧﻮﮕﭼ ﯽ ناﻮﺗ ﻪﻣﺎﻧﺮﺑزاهدﺎﻔﺘﺳاﺎﺑ ﻮﻧ
ﯽﺴﯾ ﺘﻧژ ،ﮏﯿ و ﯽﮔﮋﯾ يﺎﻫ ﺒﺳﺎﻨﻣ ﯽ اﺮﺑار ي ﺨﺸﺗ ﺺﯿ عﻮﻧرﺎﮐدﻮﺧ
ﺳﻻوﺪﻣ نﻮﯿ دﺮﮐهدﺎﻔﺘﺳا
.
ﺨﺸﺗ ﺺﯿ ﺳﻻوﺪﻣرﺎﮐدﻮﺧ نﻮﯿ
ﯽﮑﯾ ﮔﻢﻬﻣءاﺰﺟازا هﺪﻧﺮﯿ
يﺎﻫ ﺪﺟ ﺪﯾ ﺖﺳا
.
ﻤﻫﻪﺑ ﻦﯿ ﻟد ﻞﯿ
بﺎﺨﺘﻧا
و ﯽﮔﮋﯾ يﺎﻫ ورﺐﺳﺎﻨﻣ ي آرﺎﮐ ﯽﯾ ﺳ ﻢﺘﺴﯿ ﺛﺎﺗ ﺮﯿ ﯽﻤﻬﻣ ﺖﺷاﺬﮔﺪﻫاﻮﺧ
.
ﺒﺷ ﻪﯿ يزﺎﺳ ﺎﻫ ﺳﺖﺒﺴﻧﺎﺑ لﺎﻨﮕﯿ ﻮﻧﻪﺑ ﺰﯾ
5
و
10
ﺑد ﯽ
ﺖﺳاهﺪﺷمﺎﺠﻧا
.
هداد يﺎﻫ هدادزاشزﻮﻣآوﺖﺴﺗ يﺎﻫ
ﻌﻗاو ﯽ ﺳ ﻢﺘﺴﯿ ﺗاﺮﺑﺎﺨﻣ ﯽ ﻌﻗاو ﯽ ﻬﺗ ﻪﯿ ﺖﺳاهﺪﺷ
.
اﺮﺑ ي ﻟﺎﻧآ ﺰﯿ آرﺎﮐ ﯽﯾ
ﺳ ﻢﺘﺴﯿ ﭘ يدﺎﻬﻨﺸﯿ ﺎﻣزآ ﯽﺗﺎﺸﯾ ﺳ ﺎﺑ لﺎﻨﮕﯿ يﺎﻫ ﻪﻟوﺪﻣ عﻮﻧ زا هﺪﺷ
2PSK
،
4PSK
،
2FSK
،
4FSK
،
16QAM
و
64QAM
ﺖﺳاهﺪﺷمﺎﺠﻧا
.
ﺎﺘﻧ ﺞﯾ ﻣنﺎﺸﻧ ﯽ ﺪﻫد وﻪﮐ ﯽﮔﮋﯾ يﺎﻫ ﺳلﺪﻣﻂﺳﻮﺗهﺪﺷبﺎﺨﺘﻧا ﻢﺘﺴﯿ
آرﺎﮐ ﯽﯾ ﺨﺸﺗ ﺺﯿ رﺎﮐدﻮﺧ
ﺳﻻوﺪﻣ نﻮﯿ ﺖﺳاهداددﻮﺒﻬﺑار
.
ﺣرد ﻦﯿ ﺎﻣزآ ﺶﯾ ﺎﻫ دﺎﻘﻣﻪﺑ ﺮﯾ ﺒﺳﺎﻨﻣعﻮﻧو ﯽ اﺮﺑ ي ﮔﺪﻧزاﺮﺑﻊﺑﺎﺗ،ﺶﻬﺟوﻊﻃﺎﻘﺗخﺮﻧ ﯽ
ﺎﺳو ﺮﯾ
ﺎﻫﺮﺘﻣارﺎﭘ ي ﭘلﺪﻣ يدﺎﻬﻨﺸﯿ ﺖﺳد ﺪﺷﻪﺘﻓﺎﯾ
.
doi:10.5829/idosi.ije.2014.27.05b.05