*Corresponding author:Anuradha V ISSN: 0976-3031
Research Article
EXTRACTION OF CHITOSAN FROM CRAB SHELLS USING FIVE DIFFERENT CHEMICAL
METHODS AND ITS CHARACTERIZATION
Vanitha Priya D
1., Sudersan K
2., Arun Karthick S
3., Arumugam P
4., Gobi N
5.,
Siva Shankar. P
4., Anuradha V*
1and Sivasankar P
51
Department of Zoology, JBAS College for Women, Teynampet, Chennai
2Centre for Biotechnology, Anna University, Guindy, Chennai
3
Department of Biomedical Engineering, SSN College of Engineering, Chennai
4Armats Biotek Training & Research Institute (ABTRI)
5
Department of Textile Technology, Anna University, Chennai
DOI: http://dx.doi.org/10.24327/ijrsr.2018.0908.2472
ARTICLE INFO ABSTRACT
Chitosan is a polycationic polymer and the N-deacetylated derivative of the natural polymer chitin, the second most abundant polysaccharide found on earth next to cellulose. Effluent produced from the textile industry is considered threatful that can ultimately affects the ecosystem and therefore treatment is necessary. Hence, in this research, we aimed to extract chitosan from the biowaste using mild chemical extraction processes to applying it for the effluent treatment. Methods A, B, C, D, and E were carried out among which first three methods start with demineralization followed by deproteinization and the remaining two methods start with deproteinization followed by demineralization. The obtained yield in this process is called chitin which was further deacetylated to get chitosan. Thus formed chitosan samples are analyzed for color, yield percentage, and degree of deacetylation (DD); further thermogravimetric analysis, water and fat binding capacity, molecular weight and viscosity were determined. Among the five samples, chitosan obtained through Method C has the molecular weight of 365000, solubility of 87%, DD of 87% and viscosity of 714 cP, which is found to be approximately similar to commercially available chitosan that are used for effluent treatment.
INTRODUCTION
Chitin is a bio-polymer extracted from the crustacean shells that has versatile industrial applications (Muzzarelli, 1977; Poulicek and Jeunjaux 1991; Kramer et al., 1995). The shells of crab have low economic value and are treated as biowaste or sold to animal feed manufacturers (Suchiva et al., 2002). Therefore, this bio-waste can be used to produce value-added products such as chitosan. Chitosan is a polycationic polymer and the N-deacetylated derivative of the natural polymer chitin, the second most abundant polysaccharide found on earth next to cellulose (Alipour et al. 2009; Ignatova et al. 2007). Chitosan is insoluble in water and common organic solvents because of its rigid crystalline structure. It is soluble in acidic aqueous solution if the pH value is less than 6.5 (No et al. 2007). At a higher pH value, the molecule of chitosan may precipitate out of the solution and lose its charges because of deprotonation of the amine groups (No et al. 2007). Chitosan is
well known to be non-toxic, biocompatible, biodegradable, biofunctional and hydrophilic. (Deng et al. 2012; Huang et al. 2007; Ignatova et al. 2006; Li et al. 2008). Chitosan could be used as an antimicrobial and antiviral material in the field of biotechnology, pharmaceutics, wastewater treatment, cosmetics, agriculture, food science, and textiles because of its advantageous biological properties (Li et al. 2008; Lim and Hudson 2004; Lu et al. 2012).
MATERIALS AND METHODS
Collection of Samples
Crab shells were collected from the local market in and around Chennai and were placed in a Ziploc bags to avoid further contaminations and are cleaned several times with pure water to separate from the flesh. Collected shells were sundried in a clean environment for a week and completely dried.
Thus-Available Online at http://www.recentscientific.com
International Journal of
Recent Scientific
Research
International Journal of Recent Scientific Research
Vol. 9, Issue, 8(D), pp. 28512-28517, August, 2018
Copyright © Vanitha Priya D et al, 2018, this is an open-access article distributed under the terms of the Creative Commons Attribution License, which permits unrestricted use, distribution and reproduction in any medium, provided the original work is properly cited.
DOI: 10.24327/IJRSR
CODEN: IJRSFP (USA)
Article History:
Received 13thMay, 2018
Received in revised form 11th
June, 2018
Accepted 8thJuly, 2018
Published online 28th August, 2018
Key Words:
obtained samples are blended and made in to fine powder and preserved in a ziploc cover for further use.
In this research five different chemical methods are used for chitosan extraction
Metho d Step I Step II
A
Demineralization 10% HCl (room temp) for
8h
Deproteinization 10% NAOH (60 c) for 5h
B Demineralization
5% HCl (50 c) for 3h
Deproteinization 1% NAOH (room temp)
for 24h
C Demineralization
10% HCl (60 c) for 10h
Deproteinization 10% NAOH (90 C) for 6h
D 7% NaOH (40 C) for 21h Deproteinization 4% HCl (70C) for 6 h Demineralization
E Deproteinization
10% NAOH (70C) for 4h
Demineralization 10% HC1 (40C) for 2 h
Deacetylation of Chitin
Thus-obtained chitin is deacetylated using 60% NaOH for 72 hours (Muzzarelli and Rochetti, 1985).
Purification of Chitosan
Each chitosan sample is mixed with 1% v/v acetic acid in the ratio of 1mg/ml, respectively, and stirred continuously until homogenous solution is obtained. Finally, the insoluble residues are filtered. The homogenous solution is precipitated by titrating with 1N NaOH until the pH value of 8.5. The precipitated chitosan is washed several times and centrifuged at 8000rpm
Characterization of Chitosan Samples
Different techniques such as Yield Percentage, Solubility, TGA, Determination of degree of deacetylation, Degree of Crystallinity, Water Binding Capacity (WBC) and Fat Binding Capacity (FBC), Determination of Molecular Weight and Viscosity were carried out for the synthesized chitosan samples
RESULTS AND DISCUSSION
Colour measurement
Chitosan extracted using five different methods have different color. Chitosan from methods A and B are slightly pinkish in color due to incomplete extraction of chitin. Chitosan extracted though methods C, D, and E are creamy white to pale white in color. When the extraction method starts with demineralization process, the chitosan samples are in pinkish to creamy white in color. When the extraction process starts with deproteinization, due to protein degradation and bleaching of samples by HCl, they are in pale white color. Similar results were also observed by Lertsuthiwong et al, 2012. No and Meyers 1995 also evidenced that the color of chitosan is related to the extraction process and the color may varies from pale yellow to white. Seo et al. (2007) also reported that the tan colour of chitosan produced may be due to the degradation of the pigments the chitin during deacetylation process.
Yield percentage
Yield percentages of chitosan from all the five methods were calculated from the 20g of dry crab shell powder and the results are shown in Table1. From the results obtained, we can observe that the yield percentage differs with several criteria such as extraction methods, amount of removal of acetyl groups from
the polymer during deacetylation process (Fernandez-Kim 2004), concentration of acid and alkali and its reaction time with the shells. (Premasudha et al, 2015 and Yen et al, 19). It also differs according to the species and season (Cho et al., 1998).
We can observe that yield percentages of chitosan from Methods A, B, and C are higher when compared with that of Methods D and E. High yield of chitosan is observed when the extraction starts with demineralization followed by deproteinzation. This may be due to that fact that if the extraction starts with demineralization, the chitin will be protected by the adhering protein, and therefore results in less hydrolysis of the backbone that leads to higher yield. When the extraction starts with deproteination, the protective layer of protein is removed and the chitin that is unprotected is exposed to the HCl. This leads to efficient demineralization; but parallely due to more hydrolysis, high loss of material occurs in the solid chitin fraction, which leads to low yield percentage. The yield percentages through the Methods D and E were 13 and 18%, respectively, may be due to the abovementioned reason and polymer degradation (Brzeski, 1982 cited by No and Meyers, 1997). In this research, the yield of chitin though through Methods A, B, and C are 38, 43, and 29, respectively. Similar results were also observed by Cho et al., (1998) who reported that the shell waste of crustaceae is composed approximately of 30–40% protein, 30– 50% calcium carbonate and 20–30% chitin. Shahidi and Synowiecki, 1991 also added that Chinoecetesopilio crab contains about 17-32.2% chitin. Similarly, Hong and Mun, (1995) isolated 26.6% of chitin from the crab (Chionoecetesopilio). In Chinoecetesopilio chitin, the yield is about 32.2% (Shahidi and Synowiecki, 1991) and in Chionoecetesopilio it is about 26.6% (Hong and Mun, 1995).
Solubility
Chitosan has highly protonated free amino group that can highly attracts ionic compounds and therefore they are soluble in mild inorganic acid [Biswas and Gargi, 2013]. Hence, the solubility of chitosan is one of the important characteristics that determines its quality. The nature of solubility of the chitosan can be estimated by washing, drying and dissolving it in 1% acetic acid. Solubility of the chitosan can be affected by deacetylation temperature and time, concentration of alkali, particle size of chitosan and pretreatments to chitin before isolation, etc. (Ng, et al. 2001; and Pajak, et al. 1998). Among these characteristics, solubility is greatly determined by the degree of deacetylation and at least 85% of deacetylation percentage is needed for chitosan to obtain the solubility (No and Meyers, 1996).
Solubility of chitosan synthesized from five different methods are shown in Table 2. From the results, we can observe that, the solubility of chitosan obtained through Methods A, B, C, D, E are 59, 43, 91, 72, 79, respectively. Therefore, chitosan from Method C has a maximum solubility of 87. Hossain and Iqbal, (2014) evidenced that the high solubility of chitosan in acetic acid is due to at least 85% deacetylation degree of the chitosan sample.
International Journal of Recent Scientific Research Vol. 9, Issue, 8(D), pp. 28512-28517, August, 2018
Austin, 1981; Fernandez-Kim 2004). And the remaining amount of insoluble matter is probably related to chitosan particles with regions of insufficient deacetylation.
Degree of deacetylation (DD)
Determining the degree of deacetylation (DD) is most important because this nature has strong impact on several physicochemical properties such as solubility, chemical reactivity, and biodegradability, hence determines its appropriate applications (Rout, 2001; Lamarque et al. 2005). During the process of deacetylation, acetyl groups from the molecular chain of chitin is removed, and therefore a compound with a high degree of reactive amino group (-NH2) is formed named as chitosan (Fernandez-Kim 2004). So with the amount of free amino groups in the polysaccharides, the degree of deacetylation can be determined.
Table 3 shows the DD percentage of five different chitosan. From the results, we can observe that the DD of chitosan synthesized using five different methods are different due to different extraction methods as evidenced by (Martino et al. 2005; No et al. 1989; No and Meyers, 1995). Among the five samples, Sample C has the chitosan with high degree of deacetylation of 87%, followed by Methods E, D, A, and B with 73, 71, 65, and 55% of DD, respectively. As already stated by Knaul et al., (1999); Li et al., 1992; Muzzarelli & Rocchetti, 1985, chitosan with a DD of or above 70% is considered to be chitosan; therefore, in this research, Sample C with a DD% of 87% is chosen for the further process. From the results, we can infer that concentration of chemicals used for extraction, temperature and time had a great role in chitosan DD%. When the extraction starts with demineralization, more time and high concentration of HCl is required (Puvvadaetal., 2012). Parallely chitin, Methods D and E, that are exposed to the HCl after the removal of protective layer of protein have high DD with a short extraction time period.
Another factor that affects the degree of deacetylation is the concentration of alkali and time of treatment during deacetylation process. Robert (1992) stated that increase in the alkaline concentration will increase the DD%; because higher alkaline concentrations will cause more alkaline hydrolysis that results in a higher DD (Mirzadeh et al., 2001).
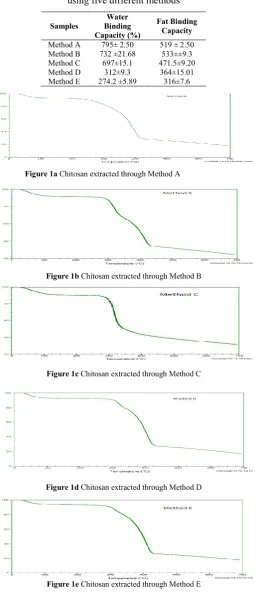
Thermogravimetric Analysis
Thermogravimetric analysis (TGA) is one of the important characterization techniques (Criado et al., 2007) carried out to examine the thermal degradation temperature of chitosan (Hefian et al., 2010) extracted using five methods and the results are shown in Figure 1a, b, c, d, and e The TGA curves of chitosan polymer from all the methods have two major degradation steps. The first stage of degradation for the chitosan extracted through Methods A, B, C, D, and E were at the temperature range of temperature range 205°C to 330 °C with 10, 20, 8, 10, and 12% of weight loss, respectively. Degradation at this stage may be due to the loss of water molecules because chitosan structures have strong affinity towards water and that may cause dehydration. This degradation may attribute to the loss of water molecules because the chitin and chitosan structures have strong affinity towards water and lead dehydration (Gonzalez et al., 2000; Yeh et al., 2006).
The second step is the actual degradation that occurs due to decomposition of chitosan. The second stage of degradation of chitosan from Methods A, B, C, D, and E is around 440 °C with 37, 39, 59, 54, and 57% of weight loss, respectively. This lose in weight is due to the actual pyrolysis of the chitosan samples (Mishra et al, 2009).
Results also shows that for the chitosan samples extracted through Methods A, B, D, E, the degradation is not yet completed even at 700°C and still some compounds may escape from the sample as vapour if the temperature raised. But definitely for chitosan extracted through Method C, there are two compounds degraded within this temperature range which can be observed by the slope of the thermogram changes but no weight stabilization was observed in the plot between this range. Therefore, the starting degradation temperature of the second compound cannot be identified and similarly as other samples, the degradation of the sample is not yet completed even at 700°C.
From the results, we can also observe that chitosan extracted through Methods A and B have less weight loss when compared to other three methods; this is because incomplete extraction of chitosan and presence of more chitin characteristics. Similar results were also observed by (Abdou et al., 2008; Zakaria et al., 2012). Sânia et al (2012) also infers that chitosan from have lower thermal stability.
Table 1 Yield percentage of chitosan extracted using five different methods
Sample Yield%
A 38
B 43
C 29
D 13
E 18
Table 2 Solubility of chitosan extracted using five different methods
Sample Solubility(%)
A 59
B 43
C 87
D 72
E 79
Table 3 Degree of deacetylation of chitosan extracted using five different methods
Samples
Degree of deacetylation (DD)
%
Method A 65 ± 2.50
Method B 58±
Method C 87±
Method D 71±
Method E 73±
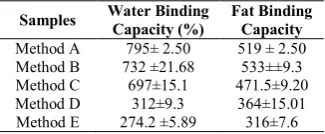
Table 4 Water and fat binding capacities of chitosan extracted using five different methods
Samples Water Binding
Capacity (%)
Fat Binding Capacity
Method A 795± 2.50 519 ± 2.50
Method B 732 ±21.68 533±±9.3
Method C 697±15.1 471.5±9.20
Method D 312±9.3 364±15.01
Table 4 Water and fat binding capacities of chitosan extracted using five different methods
Samples
Water Binding Capacity (%)
Fat Binding Capacity
Method A 795± 2.50 519 ± 2.50
Method B 732 ±21.68 533±±9.3
Method C 697±15.1 471.5±9.20
Method D 312±9.3 364±15.01
Method E 274.2 ±5.89 316±7.6
Figure 1a Chitosan extracted through Method A
Figure 1b Chitosan extracted through Method B
Figure 1c Chitosan extracted through Method C
Figure 1d Chitosan extracted through Method D
Figure 1e Chitosan extracted through Method E
Figure 1 TGA of the chitosan extracted using five different chemical methods
Water and fat binding capacity
Water binding capacity (WBC) and fat binding capacity (FBC) of chitosans extracted using five methods are shown in Table 4 and there was a significant difference among the values.
Water and fat binding capacities of chitosan extracted using five different methods
Fat Binding Capacity
519 ± 2.50 533±±9.3 471.5±9.20
364±15.01 316±7.6
Chitosan extracted through Method A
Chitosan extracted through Method B
Chitosan extracted through Method C
Chitosan extracted through Method D
Chitosan extracted through Method E
TGA of the chitosan extracted using five different chemical methods
Water binding capacity (WBC) and fat binding capacity (FBC) extracted using five methods are shown in Table 4 and there was a significant difference among the values.
Water binding capacities of chitosan from Methods A, B, C, D, and E are 795, 732, 697, 312, and 274, respectively. According to Knorr (1982), possible explanations for the differences in water uptake between chitinous polymers include differences in the crystallinity of the products, particles size of the chitosan, differences in the amount of salt
differences in the protein conte
We can also observe that fat water binding capacity of chitosans extracted through Methods D and E are very less when compared to others. The reason may be due to the extraction process proceeds with deproteinization first followed by demineralization. This is also evidenced by Rout (2001). Sarbon et al., 2015 also extracted chitosan from the mud crab shells showed a lower water binding capacity when deproteinization carried out first. The water binding capacity is comparatively high when the demineralization process carried out first, Methods A, B, and C.
Fernandez-kim, 2004; Rout, 2001 reported that both the water binding and Fat binding capacities of the
to have a high negative correlation with the other physiological characteristics like viscosity and molecular weight, degree of deacetylation, and moisture content. Another factor that affects the WBC is the concentration of NaOH so
deacetylation process. Mahdysamar (2013) reported that when 50% NaOH solution is used during the deacetylation process, chitosan with high degree of deacetylation and the excellent functional properties like WBC and FBC can be obtained. Water binding capacity of chitosan extracted through Method C, which is used for further processes in this research, is 697%. And the results are in agreement with several studies. Kucukgulmez et al (2011). Reported that chitosan extracted from M. sstebbingi shells had 712.99
capacity. Rout (2001) also added that WBC for chitosan basically ranges between 581 to 1150%.
Fat binding capacity
The fat binding efficiency of chitosan synthesized through five different methods are shown in Table 4. Fat binding efficiency of chitosan extracted using Method C is 471%, whereas for chitosan from Methods A, B, D, E are 519, 533, 364, and 316, respectively. When demineralization is conducted prior to deproteinization fat binding capacity is high and vice versa when deproteinization is conducted prior to demineralization and finally deacetylation. Another reason may be due to the particle size of the chitosan samples (Moorjani
study by Cho et al. (1998) presented that the FBC of different commercial chitosans were reported to range from 314 to 535 % which is comparable with the mud crab chitosan extracted in this study. A study by Knorr, 1982, also evidenced the FBC of the chitosan ranged from 315 to 170%. No (2000) evidenced that WBC
were in the range of 355–611% and 217
MolecularWeight and Viscosity
Molecular weight (MW) of the chitosan indicates the length of the chitosan chain and molecular weight increases with the chain length. Molecular weight is expressed as dalton or gram per mole of chitosan. The molecular weight of chitosan is one of the most important properties as it considerably affects the physicochemical and functional properties (Yen
Water binding capacities of chitosan from Methods A, B, C, D, and E are 795, 732, 697, 312, and 274, respectively. According ble explanations for the differences in water uptake between chitinous polymers include differences in the crystallinity of the products, particles size of the chitosan, differences in the amount of salt-forming groups, and differences in the protein content of the materials.
We can also observe that fat water binding capacity of chitosans extracted through Methods D and E are very less when compared to others. The reason may be due to the extraction process proceeds with deproteinization first followed demineralization. This is also evidenced by Rout (2001).
., 2015 also extracted chitosan from the mud crab shells showed a lower water binding capacity when deproteinization carried out first. The water binding capacity is when the demineralization process carried out first, Methods A, B, and C.
; Rout, 2001 reported that both the water binding and Fat binding capacities of the chitosan is also found to have a high negative correlation with the other physiological characteristics like viscosity and molecular weight, degree of deacetylation, and moisture content. Another factor that affects the WBC is the concentration of NaOH solution used during deacetylation process. Mahdysamar (2013) reported that when 50% NaOH solution is used during the deacetylation process, chitosan with high degree of deacetylation and the excellent functional properties like WBC and FBC can be obtained. Water binding capacity of chitosan extracted through Method C, which is used for further processes in this research, is 697%. And the results are in agreement with several studies.
). Reported that chitosan extracted shells had 712.99 % of water binding capacity. Rout (2001) also added that WBC for chitosan basically ranges between 581 to 1150%.
The fat binding efficiency of chitosan synthesized through five different methods are shown in Table 4. Fat binding efficiency of chitosan extracted using Method C is 471%, whereas for chitosan from Methods A, B, D, E are 519, 533, 364, and 316, ly. When demineralization is conducted prior to deproteinization fat binding capacity is high and vice versa when deproteinization is conducted prior to demineralization and finally deacetylation. Another reason may be due to the san samples (Moorjani et al. 1975). A ) presented that the FBC of different commercial chitosans were reported to range from 314 to % which is comparable with the mud crab chitosan extracted in this study. A study by Knorr, 1982, also evidenced the FBC of the chitosan ranged from 315 to 170%. No et al (2000) evidenced that WBC and FBC of chitosan products
611% and 217–477%, respectively.
Weight and Viscosity
International Journal of Recent Scientific Research Vol. 9, Issue, 8(D), pp. 28512-28517, August, 2018
Molecular weight and Viscosity of the chitosan depends on several factors such as concentration of alkali used during deacetylation process, reaction time and temperature, pretreatment of the chitin before deacetylation, particle size of the chitin, dissolved oxygen concentration and shear stress (Guo et al, 2002; Li et al., 1992; Nemtsev et al., 2002; Oh et al., 2001; Tolaimate et al, 2000). No et al. (1999); Bough et al. (1978; Moorjani et al. (1975) decerase when NAOH used in high condemonstrated that the viscosity chitosan is considerably affected by physical (grinding, heating, autoclaving, ultrasonication) and chemical (ozone) treatments, except for freezing, and decreases with an increase in treatment time and temperature.
Molecular weight and viscosity of the chitosan synthesized from all the five methods are measured using modified method of Wang and Kinsella (1976) and the results are tabulated in Table 5.
Molecular weight and viscosity are two most important parameters that influence the physiochemical characteristics of chitosan such as solubility, degree of deacetylation, and electrical charge properties, which determine the potential applications of this polymer. Renault et al, (2009) stated that degree of deacetylation is related to charge density of chitosan and molecular weight corresponds to inter-particle bridging (Faust & Aly, 1998), From the results obtained in this research, we can observe that chitosan with lowest DD% has high molecular weight; this may be due to incomplete extraction of chitin and incomplete deacetylation of chitin. Khor and Lim, 2003; Kumar, 2000; Prashanth et al., 2002; Cao et al., 2005; Tsaih et al., 2003).
Generally, chitosan synthesized through demineralization followed by deproteinzation has high molecular weight (Methods A, B, C) when compared to chitosan synthesized through deproteinization followed by demineralization (Methods D and E). The reason is the protective effect of the shrimp protein layer against the hydrolytic action on the chitin backbone during demineralization process carried out first using HCl (Stevens, 2001), whereas in the second method the protein shield is removed and polymer structure is more exposed to HCl and chains are destroyed (Rout, 2001).
From the overall results, we can observe that chitosan obtained through Method A has a molecular weight of 1070000 Da, solubility of 59%, DD of 65% and viscosity of 816 cP.
Method B has a molecular weight of 1200000, solubility of 43%, DD of 58% and viscosity of 1100 cP.
Method C has a molecular weight of 365000, solubility of 87%, DD of 87% and viscosity of 714 cP.
Method D has a molecular weight of 29,000, solubility of 72%, DD of 71% and viscosity of 210 cP.
Method E has a molecular weight of 35,000, solubility of 79%, DD of 73% and viscosity of 296 cP.
All the above-mentioned characteristics of chitosan are inter-related. With the increase in molecular weight viscosity increased (Qiu et al, 2007), DD and solubility of the chitosan decreases. In this research, with the aim of applying the chitosan for effluent treatment, choosing the chitosan with high deacetylation rate and solubility is of essence. Chitosan obtained through Methods A and B have DD less than 70% and therefore not considered as chitosan. Chitosan obtained though
Methods D and E have low molecular weight and and therefore less viscosity (Bough and others 1978; Sophanodora and Hutadilok 1995) due to polymer degradation. Chitosan obtained through Method C has high molecular weight with maximum DD% and solubility and hence utilized for further processes. Results of this research also correlate with several studies as follows. Domard et al (1989) used different molecular weight chitosan for kaolinite removal and found that higher molecular weight chitosan adsorbed more kaolin than lower molecular weight. Chen et al (2003) applied four different molecular weight chitosans in his coagulation-flocculation study and inferred chitosan with high molecular weight in the range of 300,000 Da has better bentonite removal, whereas the lowest MW (27,900 Da) almost had no effect on the removal. Roussy et al (2005) also found bentonite removal increased when high molecular weight chitosan used upto 100,000 daltons. Zeenat et al., 2013 also used high molecular weight chitosan for the treatment of wastewater from the Local Ghee Industry.
Relationship between water and fat binding capacities, degree of deacetylation, molecular weight and viscosity
From the results of this research, we can observe that there is a significant correlation among WBC and FBC, DD%, solubility, molecular weight and viscosity of chitosan from all the methods. Chitosan with highest WBC and FBC has highest DD% but low molecular weight and viscosity. Similar results were also observed by Ocloo et al. (2011).
CONCLUSION
Five different chemical methods were followed to extract chitosan and according to extraction processes, the quality and quantity of chitosan samples differed extremely, which were confirmed by several analyses. Since the main aim of obtaining chitosan is for effluent treatment, chitosan sample obtained through Method C with molecular weight of 365000, solubility of 87%, DD of 87% and viscosity of 714 cP is found to be optimal.
References
Abdou ES, Nagy KSA, Elsabee MZ. Extraction and characterization of chitin and chitosan from local sources, Bioresources Technology. 2008, 99, p.1359-1367.
Brine CJ and Austin PR. Chitin variability with species and method of preparation. Comparative Biochemistry and Physiology Part B: Comparative Biochemistry. 1981, 69(2), pp. 283 – 286
Brzeski MM. Concept of chitin/chitosan isolation from Antarctic Krill (Euphausiasuperba) shells on a technique scale. In Proceedings of the Second International Conference on Chitin and Chitosan; S. Hirano and S. Tokura (Ed.), p.15. 1982. The Japan Society of Chitin and Chitosan, Sapporo, Japan. Bough WA, Salter WL, Wu ACM, and Perkins BE.
Cho YI, No HK, Meyers SP. Physicochemical characteristics and functional properties of various commercial chitin and chitosan products. Journal of Agricultural and Food Chemistry. 1998, 46(9), pp. 3839-3843
Criado JM, Perez-Maqueda LA, Gotor FJ, Malek J, Koga NJ. Therm. Anal. Calorim. 2003. (72): 901-906.
Domard, A. Determination of N-acetyl content in chitosan samples by C.D. measurements. Int.J.Biol.Macromol. 1987. 9, 333-6
El-Hefian, EA, Elgannoud, I E, Maina, L A, Yahaya, AH. (2010): Characterization of chitosan in acetic acid: Rheoloical and thermal studies. Turk J Chem. (34): 47 – 56.
Fernandez-kim SO. Physicochemical and functional properties of crawfish chitosan as affected by different processing protocols. Dissertation of MSc.: Graduate Faculty of Seoul National University. 2004. p. 107. García MA, Montelongo I, Rivero A, de la Paz N, Fernández
M. Treatment of Wastewater from Fish Processing Industry using Chitosan Acid Salts. Int Water Wastewater Treat 2(2). 2012. 2381-5299.
Hossain MS, Iqbal A. Production and characterization of chitosan from shrimp waste. Journal of the Bangladesh Agricultural University. 2014;12(1):153-60.
Kurita, K. Polymer Degradation and Stability, 1998. 59. p.117-120.
Lamarque G. et al. Physicochemical behavior of homogeneous series of acetylated chitosans in aqueous solution: role of various structural parameters. Biomacro-molecules, 2005; 6(1): 131-142
Li Q, Dunn ET, Grandmaison EW, and Goosen MFA.Applications and properties of chitosan. Journal of Bioactive Compatible Polymers. 1992. 7, 370–397. Mirzadeh H., Yaghobi N., Amanpour S, Ahmadi H,
Mohagheghi M.A and Hormozi F. Preparation of Chitosan Derived from Shrimp's Shell of Persian Gulf as a Blood Hemostasis Agent. Iranian Polymer Journal, 2002; 11(1): 63-68.
Martino AD, Sittinger M, Risbud MV. Chitosan: a versatile biopolymer for orthopaedic tissue-engineering. Biomaterials. 2005; 26:5983–5990.
Muzzarelli RAA. Some modified chitosan and their niche applications, In Chitin Handbook, by Muzzarelli R.A.A., Peter M.G. (ed). European Chitin Society, Italy, 1997, p.47-52.
Muzzarelli RAA and Rocchetti R. Determination of the degree of acetylation of chitosan by first derivative ultraviolet spectrophotometry. Carbohydrate Polymer. 1985, 5, 461–472.
Puvvada YSS, Vankayalapati S, Sukhavasi A. Extraction of chitin from chitosan from exoskeleton of shrimp for application in the pharmaceutical industry. IntCurr. Pharm. Journal. 2012, 1(9): 258-263
PraneeLertsutthiwong Ng Chuen How,
SuwaleeChandrkrachang and Willem F. Stevens. Effect of Chemical Treatment on the Characteristics of Shrimp Chitosan. Journal of Metals, Materials and Minerals.2002, Vol. 12 No. 1 pp. 11-18.
Rout SK. Physicochemical, Functional, and Spectroscopic analysis of crawfish chitin and chitosan as affected by process modification. 2011. Dissertation
QiuJin, Huahua Yu, Xueqin Wang, Kecheng Li, and Pengcheng L. Effect of the molecular weight of water-soluble chitosan on its fat-/cholesterol-binding capacities and inhibitory activities to pancreatic lipase. PeerJ. 2017; 5
Robert GAF. Preparation of chitin and chitosan. The Macmillan UK: London Press, 1992.
SâniaMBdA, Rasiah L, Brismak G d R, Débora D B, Alcione O G.The Use of Exoskeletons of Shrimp (Litopenaeusvanammei) and Crab (Ucidescordatus) for the Extraction of Chitosan and Production of Nanomembrane. Mater. Sci. Appl. 2012. 3(7):495-508 Shahidi F, Synowieck J. Isolation and charactrization of
nutrients and value-added products from snow crab (Chinoecetesopilio) and shrimp (Pandalus borealis) processing discards, Journal of Agricultural Food Chemistry, 1991, 39, p. 1527-1532.
Sarbon NM, Sandanamsamy S, Kamaruzaman SFS, and Ahmad F. Chitosan extracted from mud crab (Scylla olivicea) shells: physicochemical and antioxidant properties. J Food Sci Technol. 2015; 52(7): 4266–4275.
Stevens WF. Production of chitin and chitosan: Refinement and sustainability of chemical and biological processing. In Uragami, et al. (eds.) Chitin and Chitosan: Chitin and Chitosan in Life Science. Tokyo, Kodansha Scientific, et al. 2001, 293-300.
Shahidi F, Synowiecki J. Isolation and characterization of nutrients and value- added products from snow crab (ChionoecetesOpilio) and shrimp (Pandalus Borealis) processing discards. J Agric Food Chem. 1991; 39(8):1527–1532.
Shahidi F and J Synowiecki. Isolation and characterization of nutrients and value-added products from snow crab (Chionoecetesopilio) and shrimp (Pandalus borealis) processing discards. J Agri Food Chem. 1991, 39: 1527-1532.
ZainohaZakaria, ZatilIzzah, Mohammad Jawaid and Azman Hassan. Effect of degree of deacetylation of chitosan on thermal stability and compatibility of chitosan-polyamide blend. Bioresources. 2012. 7(4), 5568-5580. Zeenat M. Ali, Abdul JabbarLaghari, Abdul Khalique
Ansari, Mohammad YarKhuhawar. Extraction and Characterization of Chitosan from Indian Prawn (FenneropenaeusIndicus) and its Applications on Waste Water Treatment of Local Ghee Industry. IOSR Journal of Engineering. 2013. 2250-3021.