GLOBAL SUPPLY CHAIN MANAGEMENT UNDER THE
CARBON EMISSION TRADING PROGRAM USING MIXED
INTEGER PROGRAMMING AND GENETIC ALGORITHM
A. Sadegheih*
Department of Industrial Engineering Yazd University, P. O. Box: 89195-741, Yazd, Iran
P. R. Drake, D. Li, and S. Sribenjachot
E-Business and Operations Management Division University of Liverpool Management School
Post code L69 7ZH, Liverpool, U.K.
[email protected], [email protected], [email protected]
* Corresponding author
(Received: May 21, 2009 – Accepted in Revised Form: March 11, 2010)
Abstract In this paper, the transportation problem under the carbon emission trading program is modelled by mathematical programming and genetic algorithm. Since green supply chain issues become important and new legislations are taken into account, carbon emissions costs are included in the total costs of the supply chain. The optimisation model has the ability to minimise the total costs and provides the best solutions, which are both cost-effective and environmentally friendly. Moreover, a mathematical model and genetic algorithm are used to simulate the developments when carbon emission costs are changed and when companies are committed penalty charge. Finally, the result is shown the genetic algorithm technique is feasible in transportation network planning.
Keywords Discrete models, Genetic algorithm, Supply chain, Carbon emission trading, Network
planning
ﻜﭼ
ﻴ
ﻩﺪ
ﻪﻟﺎﺴﻣ ،ﻪﻟﺎﻘﻣ ﻦﻳﺍ ﺭﺩ ﻪﻣﺎﻧﺮﺑﻪﻣﺎﻧﺮﺑ ﻪﻠﻴﺳﻭ ﻪﺑﻦﺑﺮﮐ ﻪﻣﺎﻧﺮﺑ ﻦﺘﻓﺮﮔ ﺮﻈﻧ ﺭﺩ ﺎﺑﻞﻘﻧ ﻭﻞﻤﺣﯼﺰﻳﺭ ﯼﺰﻳﺭ
ﯽﺿﺎﻳﺭ ﺖﺳﺍ ﻩﺪﺷﯼﺯﺎﺳﻝﺪﻣﮏﻴﺘﻧﮊﻢﺘﻳﺭﻮﮕﻟﺍﻭ .
ﻳﺍﻦﻤﺿﺭﺩ ﻪﮑﻨ
ﻳﺮﻳﺪﻣ ﻪﻟﺎﺴﻣ ﺖ
ﺮﻋﻩﺮﻴﺠﻧﺯ ﺿ
ﯽﻤﻬﻣﻉﻮﺿﻮﻣﻪ
ﯽﻣ ﺖﺳﺍ ﻩﺪﺷ ﻪﺘﻓﺮﮔ ﺭﺍﺮﻗﻪﺟﻮﺗ ﺩﺭﻮﻣﻞﮐ ﻪﻨﻳﺰﻫ ﺭﺩﻦﺑﺮﮐ ﻪﻨﻳﺰﻫ،ﺪﺷﺎﺑ .
،ﻝﺪﻣ ﻪﻨﻴﻤﮐ ﻥﺩﺮﮐ ﻪﻨﻳﺰﻫ ﻞﮐ ﻭ ﺖﺳﺪﺑ
ﻥﺩﺭﻭﺁ ﻦﻳﺮﺘﻬﺑ ﻩﺍﺭ ﻞﺣ ﯼﺍﺮﺑ ﻪﻨﻳﺰﻫ ﻭ ﻂﻴﺤﻣ ﺖﺴﻳﺯ ﯽﻣ ﺪﺷﺎﺑ . ﻪﻣﺎﻧﺮﺑ ﯼﺰﻳﺭ ﯽﺿﺎﻳﺭ ﻭ ﻢﺘﻳﺭﻮﮕﻟﺍ ﮏﻴﺘﻧﮊ ﯼﺍﺮﺑ ﻞﺣ
،ﻝﺪﻣ ﻪﮑﻴﻧﺎﻣﺯ ﻪﻨﻳﺰﻫ ﯼﺎﻫ ﺮﮐ ﻦﺑ ﺮﻴﻴﻐﺗ ﯽﻣ ﻭﺪﻨﮐ ﺎﻬﺘﮐﺮﺷ ﺭﻮﺒﺠﻣ ﻪﺑ ﺖﺧﺍﺩﺮﭘ ﻪﻤﻳﺮﺟ ،ﺪﻨﺘﺴﻫ ﻩﺩﺎﻔﺘﺳﺍ ﻩﺪﻳﺩﺮﮔ ﺖﺳﺍ .
ﺭﺩ ﺖﻳﺎﻬﻧ ﺞﻳﺎﺘﻧ ﻥﺎﺸﻧ ﯽﻣ ﺪﻫﺩ ﻪﮐ ﻢﺘﻳﺭﻮﮕﻟﺍ ﮏﻴﺘﻧﮊ ﮏﻴﻨﮑﺗ ﯽﺒﺳﺎﻨﻣ ﯼﺍﺮﺑ ﻪﻣﺎﻧﺮﺑ ﯼﺰﻳﺭ ﻞﻤﺣ ﻭ ﻞﻘﻧ ﯽﻣ ﺪﺷﺎﺑ .
1. INTRODUCTION
Logistics management is essentially an integrative process that seeks to optimize the flows of materials and supplies through the organization and its operations to customer. Logistics has always been a central and essential feature of all economic activity. Transportation decisions can involve mode selection, shipment size and routing and scheduling. These decisions are influenced by
effect. Transportation refers to the movement of product from one location to another as it makes its way from the beginning of a supply chain to the customer. Transportation is an important supply chain driver because products are rarely produced and consumed in the same location. Transportation is a significant component of the costs incurred by most supply chains. At this moment environmental issues have the most serious problem to be concerned within every part of the world. Global warming, which is mainly caused by the emissions of green house gases (GHGs), is said to be a serious part of these environmental problems. These green house gases usually consist of different sort of gases, such as Carbon dioxide, Methane, amongst others. Because these gases are emitted through the atmosphere in excessive quantities, the average temperature of the globe is continuously increasing every year. This problematic situation results in vast turbulence in global atmosphere and the environment in many ways. This simply means that the changed atmosphere of our world directly affects human lives and all species. There are a number possible approaches to mitigate this problem such as, promoting the growth of economies, controlling population, studying the possibility of removing carbon from fuels, developing other energy sources and energy efficient technology. Carbon trading is one of those ways to be focused on in this study and it is said to be the best choice that contribute to the reduction of carbon emissions. As the danger of this situation is realised, many efforts which have been made to resolve this problem lead to new business opportunities.
The carbon emission trading scheme under the Kyoto Protocol can be considered as one of the substantial efforts [1]. This protocol is an environmentally friendly means of pollution control. Demonstrating motivations in economics so as to reach the level of reducing pollutant emission known as Cap and Trade is how this Protocol works. The trading of carbon as one is considered as the carbon market these days. There is no limitation of GHG emission for the developing countries, thus they can sell their emission permits to the developed countries under the Kyoto Protocol. Therefore, the carbon emission trading schemes have become a procedure for the developed countries to avoid penalties from
excessive pollutant emissions.
agreement. Bohringer [11] provided a critical assessment of the Protocol’s potential performance and discusses amendments to foster its effectiveness and efficiency. It concludes that, even without any effective emission reductions in the initial commitment period, the ratification of Kyoto is important for the further policy process of climate protection. The Kyoto Protocol has established a flexible, broad-based, international mechanism that provides a valuable starting point for shaping efficient climate policies in the future. Parry [12] provided simple formulas for adjusting the costs of carbon taxes and tradable carbon permits to account for interactions with pre-existing tax distortions in the labour market. Both policies reduce labour supply as they increase product prices and reduce real household wages; the resulting efficiency losses in the labour market can be substantial relative to partial equilibrium abatement costs. However, much of this added cost can be offset and perhaps more than offset when additional distortions from the tax system are considered, if revenues from carbon taxes or auctioned permits are used to reduce distortionary taxes. Consequently, there can be a strong case on efficiency grounds for using carbon taxes or auctioned permits over grandfathered carbon permits. Helm et al. [13] set out the credibility problem in carbon policy, provided a number of examples of non-credibility in recent energy policy, and identified the costs of failing to address it. Callan et al. [14] studied the effects of carbon tax and revenue recycling across the income distribution in the Republic of Ireland.
Transportation policy sets direction for the amount of national resources that go into improving transportation infrastructure. Transportation policy also aims to prevent abuse of monopoly power, promote fair competition, and balance environmental, energy, and social concerns in transportation. By considering the supply chain management, the level of carbon produced will be increasingly important for the supply chain in the forthcoming future. Companies are forced to control their production of GHGs and reduce the carbon emission to the specified levels stated in the standard regulations. In the mean time, a variety of environmentally friendly products is increasingly considered to be significant amongst companies. These products are
seen to be distinctively different and make the company stay competitive by displaying a new label stating the quantity of carbon produced. This paper involves considering the carbon emitted across the supply chain members. CO2 emission information must be added to the production in every process in the supply chain and is required to be collected. Using new types of infrastructures to collect information on CO2 emitted and the creative strategies are necessary for the era of globalised economy. The main purpose of emissions trading is to achieve effective environmental control. It is therefore important to ensure that implementation of the system does not entail too high an administrative or financial burden for regulating authorities or participating sources, and that it is designed in such a way as to ensure that specified environmental targets are achieved. In the case of pollutants that have local health or environmental impacts, this may require restrictions on total emissions by sources, on the direction of trades, or on the geographical area from which allowances/credits can be purchased, to ensure that trading ensures local environmental benefits. In all cases emissions trading require accurate monitoring of emissions and effective enforcement of compliance to ensure that the environmental target is achieved [15-16]. This paper focuses on supply chain management under the carbon emission trading program. Since this paper involves choosing transportation modes and factories to deliver products to the wholesaler with the lowest costs and the carbon emissions consideration, this fits with minimising the total costs as the objective function in the mixed-integer programming. The theoretical basis of MILP is involved with minimising and maximizing the linear objective function which is subject to a number of linear constraints [17]. As a matter of fact, this programming model can deal with non-linear cases called mixed integer non-non-linear programming (MINLP) but it is more difficult than MILP to solve the problems. In some cases, MILP models require high memory and computational times due to special problems. There are a large number of researches relevant to the use of MIP models, one of which is using an MILP model to design multiple products logistics networks proposed by Ma and Suo [18].
parts: A designed model using an MIP model, Inventory planning, and a delivery route model. These three phases are concerned as an iterative design. Their proposed MIP model is divided into two parts as mentioned in the basic concept. The first is the objective function and the constraints refer to the second part. Its aim is to minimise the total costs consisting of product delivery costs from factories to wholesalers, fixed and variable costs at wholesalers, and product delivery cost from wholesalers to retailers as a description of the objective function. The constraints for this model are the production and throughput capacity, customer demands and material flow requirement. There is a type of constraints specifying the number of products must be positive and another constraint involves controlling binary variables. It is indicated that using those three steps mentioned above leads to more accurate results and the model can be quickly adapted to market changes.
Chopra and Meindl proposed the network optimization models for facility location and capacity allocation using an MILP model to find the best locations for company facilities [19]. Similar to the paper provided by Ma and Suo, the model is composed of the objective function and constraints. In that case, the demands in areas, economies of scale, the total costs are the factors that contribute to the decision making process. The benefit of using this model is the reduction of transportation costs. For the drawback, the size of facilities is limited to the demands, thus the economies of scale are not fully manipulated. Another research proposed by Canel and Khumawala [20] involves locating international facilities using a mixed-integer programming model. The main reason for this is that exporting products to foreign markets is difficult due to expensive transportations. International facilities location (IFL) problems are resolved by using the 0-1 mixed-integer programming (MIP) model concentrating on capacitated and incapacitated multi-period IFL problems. The model is based on a manufacturing process including factories in the home country, foreign facilities, and customers. The objective function of the model is used to select the best country to locate facilities and also find the amount of products to be delivered to customers. The structure of the objective function is set to maximise the profits, which is different to
those objective functions mentioned before. The constraints are based on shortages, open-close facilities, demands for shipping, etc. However, further scenarios are analysed in order to obtain more solutions. For instance, the objective function is changed to minimising costs. The results are discussed in various aspects. For example, the total costs are higher when the constraint “shortage” is not concerned. Thus, the optimised solutions can be different depending on scenarios. In addition to MIP models, Ostermark [21] provided a mixed integer non-linear programming model for designing a flexible platform. It aims to develop a new MINLP framework used for analysing complex models. The designed platform contains a combination between non-linear optimisation approach and innovative numerical techniques. The solutions to this methodology are able to decrease searching processes because discrete searching areas and non-integer discrete variables are included in the system.
also to identify the most appropriate production volume with respect to fuzzy demands and capacities in order to minimize the deviation from the desired production and balanced machine workload.
2. TRANSPORTATION SYSTEMS
Transportation is one of the factors that play an important role in logistics and supply chain management. Nowadays, it is well known that global warming has become the most serious threat because it could cause many disasters, such as extremely changed weather, heat wave, severe storm, etc. However, high quality transportation can improve the global warming problems. It is obvious that reducing carbon emissions are reducing in all other sectors whereas the emissions from the transportation sector show a tendency to increase continuously. Thus, various changes in the supply chains will definitely occur in the forthcoming future corresponding to new legislations and transportation will increasingly play a crucial role in the reduction of carbon emissions.
The main types of trading scheme designs are: i. Baseline and credit; ii. Cap and trade; iii. Open and closed systems; iv. Voluntary versus mandatory schemes; v. Offset [24]. There are a number of schemes to reduce carbon emissions. The first is the European Emission Trading Scheme (EU-ETS). The next programme is called the Tradable Energy Quotas (TEQs). The third approach refers to Personal Carbon Allowances or Rationing (PCAs). Within the transport sector, trading of CO2 emissions permits could take place amongst individuals or companies. The latter option could include fuel suppliers and vehicle manufacturers and is referred to as an ‘upstream’ scheme. A scheme where individuals are the trading entity is referred to as a ‘downstream’ scheme i. Tradable fuel permits refers to a scheme for individuals proposed by Dobes [25]. ii. Voluntary tradable fuel permits with taxation iii. Tradable carbon permits for road transportations is developed by Watters [26].
Finally, trading amongst vehicle manufacturers, vehicle manufacturers could achieve reductions in
goal is to minimize costs through consolidation without hurting delivery time and reliability.
All transportation decisions made by shippers in a supply chain network must take into account their impact on inventory costs, facility and processing costs, the cost of coordinating operations, as well as the level of responsiveness provided to customers. Managers must consider the following trade-offs when making transportation decisions: i. Transportation and inventory cost trade off, two fundamental supply chain decisions involving this trade off are: a. Choice of transportation mode; b. Inventory aggregation. ii. Transportation cost and customer responsiveness trade-off. Managers must use information technology to decrease costs and improve responsiveness in their transportation networks. Software helps managers do transportation planning, modal selection, and build delivery routes and schedules. Available technology allows carriers to identify the precise location of each vehicle as well as the shipments the vehicle carries. Satellite based communication system allow carriers to communication with each vehicle in their fleet. Information technology also comes into play in the use of Global Positioning Systems (GPS) and electronic notification of impending arrivals. GPS systems monitor the real time location of vehicles. This real time information improves a firm’s response to customer questions regarding deliveries. These technologies help carrier’s lower costs and become more responsive to changes. The main benefits of emissions trading in the transport sector are: Reduced impacts of climate change; Reduced local air pollution; Reduced congestion; Increased trend towards localisation; Improved health and fitness; Enhanced community spirit; Increased use of public transport; Increased uptake of clean fuels and vehicles. Finally, the alternative policy approaches to a tradable permit scheme are: i. Carbon tax on fuel, fuel tax increases are an alternative approach to tradable permits. Using price flexibilities of fuel demand, it would be possible to design a system of fuel price increases that could achieve significant reductions in CO2 emissions; ii. Mandatory enforcement of clean technology/fuel, vehicle manufacturers and fuel producers could be forced to achieve preset environmental standards with the aim of reducing
greenhouse gas emissions from the transport sector [30].
Kaboli et al. [31] presented a holistic approach of the multi-criteria decision making (MCDM) methodology to select the optimal location(s), which fits best for both investors and managers. Rassafi et al. [32] proposed an endeavour to quantify the concept of sustainable transportation. The prevailing idea in the context of sustainable development (SD) emphasizes on the reduction of transportation demand in order to reduce the environmental and social consequences of it. The study shed some light on the SD of transportation supply and demand, reflecting the harmony of social, environmental and economic development with respect to transportation supply and demand development. The study confirmed the significance of transportation supply and demand balancing and sustainability challenges of the 21st century. The methodology may be applied to any other time and geographic scope for addressing pertinent issues for balancing and SD of transportation systems.
3. MIXED INTEGER lINEAR PROGRAMMING
transportation modes. Those factors are prices, time, quality, flexibility, and reliability. In recent years, new legislation involving environmental issues was established to reduce carbon emissions focusing on the green supply chain. Any enterprises that still used traditional procedure were significantly affected by the increase in the total costs stemming from purchasing carbon permits. Although this situation has not yet come about in the logistics and supply chain sector, it is highly likely proclivity in the forthcoming future that such regulations will be engaged in this sector. Transportation is said to be the largest sector emitting carbon to the atmosphere. Therefore, a design network and made of transportation optimisation model must be created considering carbon emissions trading. Its direct benefit is lowering the total costs and its indirect benefit involves environmentally friendly issues, especially, the global warming problems. Transportation optimisation models are developed to enhance the decision making procedure to choose: the number of suppliers, the amount of products, and transportation types. They aim to meet the demands of finding the lowest costs and meeting targets of carbon emission trading. In that case, the design model is able to answer these following questions: how many units of products to be ordered and which factories and transportation modes to be selected when costs of carbon emissions are applied. The optimisation model is developed by using mixed-integer programming. Its structure can be divided into two parts: the objective function and constraints. A transportation service incurs a number of costs, such as labour, fuel, maintenance, terminal, roadway, administrative, and others. This cost mix can be arbitrarily divided into those costs that vary with services or volume, variable costs, and those that do not fixed costs. Of course, all costs are variable if a long enough time period and a great enough volume are considered. For purposes of transport pricing however, it is useful to consider costs that are constant over the normal operating volume of the carrier as fixed. All other costs are treated as variable. Specifically, fixed costs are those for roadway acquisition and maintenance, terminal facilities, transport equipment, and carrier administration. Variable costs usually include line-haul costs such as fuel and labour, equipment
maintenance, handling, and pickup and delivery. This is not a precise allocation between fixed and variable costs, as there are significant cost differences between transportation modes, and there are different allocations depending on the dimension being examined. All costs are partly fixed and partly variable, and allocation of cost element into one class or the other is a matter of individual perspective. The objective function, equation (1), it refers to the purpose of the model which focuses on minimising total costs consisting of production costs, fixed cost from factories, fixed and variable transportation costs, carbon emission costs and opportunity costs. The constraints comprise demands, capacity and material flows. The designed objective function (1) and constraints (2-7) can be written as a formula and equation shown below: Objective function: (1) ) (
1 1 1
1 1 1
1 1 1
1
1 1 1
ftw Z w NF f NT t ftw ftw Z w NF f NT t ftw ftw tw NF f Z w NT t ftw f NF f f ftw Z w NF f NT t f Q UCEC UVTC Q UOC T FTC T FC Q UPC Cost Min
Where
w
;
Z;f
;
NF
;
t
;
NT
;
UPC
f;
Q
ftw;
;
FC
fT
f;
FTC
ftw;
T
tw;
UOC
ftw;
UVTC
ftw;
and
UCEC
ftw;
are the wholesaler index; the number of wholesaler; the factories index; the number of factories; the transportation modes index; the number of transportation modes; the unit production cost from factoryf
; the quantity shipped from factoryf
to wholesalerwby using modet
; the fixed cost from factoryf
; 1 if factoryf
is open, 0 otherwise; the fix transportation cost from factoryf
to wholesalerwholesalerwby using transportation mode
t
; and the unit carbon emission cost from factoryf
to wholesalerwby using transportation modet
respectively.Subject to:
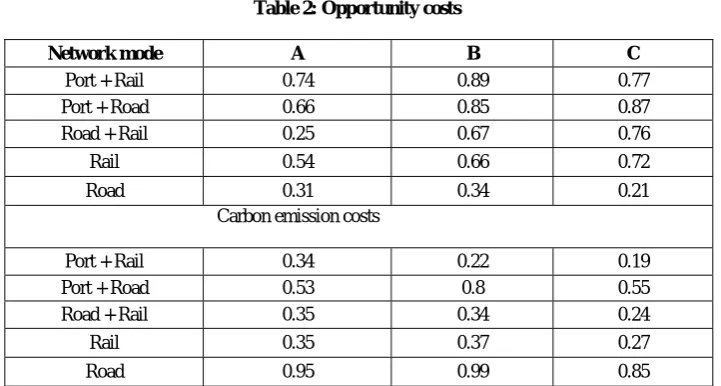
In order to give a description of each component in the objective function, the production costs component refers to the price per unit of products ordered from factories. Fixed transportation costs involve expenses (e.g. handling costs) which are never changed no matter how many products delivered from factories whereas variable transportation costs are product volume-varying costs (e.g. rising fuel costs). Opportunity costs mean the calculated expenditure when the other best choices have passed during the decision making process. For example, rail transportation is selected due to low costs but its movement is slower than Lorries. This forces companies to keep their stocks a little longer in order to wait for the product delivery. The last component of the objective function is carbon emissions costs. These expenses are incurred by purchasing carbon emissions credits. This component is a very significant factor because environmental issues will be increasingly considered. For the constraints, the constraint (2) simply indicates all the products delivered from the factories must be equal to the demand.
Z w NW Q w NT t NF f
ftw 1,...,
1 1
(2) WhereNW
w is the Demand at wholesalerw. The constraint (3) means none of the factories can supply more than their capacity.NF f
T PCF
Q f f
Z
w NT
t
ftw 1,..., 1 1
(3) WherePCF
f is the Potential capacity of factoryf
.The constraint (4) involves each mode of transportation not being able to exceed its capacity.
Z w NT t T PCT
Q tw tw
NF f ftw ,..., 1 ,..., 1 1
(4)
Where
PCT
tw is the Potential capacity of transportation modet
to wholesalerw.For the constraint (5), the amount of products shipped must be in positive numbers.
Z w NT t NF Qftw ,..., 1 ,..., 1 ,..., 1 f 0 (5)
The constraints (6) and (7) specify each transportation mode and factory are either open or closed respectively. Z w NT t Ttw ,..., 1 ,..., 1 } 1 , 0 { (6)
NF
,...,
1
f
}
1
,
0
{
T
f
(7) These two constraints are used as a binary variable.4. THE MANAGEMENT PLANNING PROCESS
Multi-Criteria Decision Making (MCDM) is the study of methods and procedures by which concerns about multiple conflicting criteria can be formally incorporated into the management planning process. MCDM is also referred as:
information processing. Ultimately, these methods and techniques may lead to better decisions [33]. The first step of calculations is assuming values for all the parameters to be calculated in the objective function and constraints. This problem is resolved by using the Solver Parameter in Excel. Tables 1 and 2 show fixed and variable transportation costs per unit, factory and transportation modes capacities, production costs per unit, wholesaler demand, opportunity costs per unit, and carbon emissions costs per unit, respectively. In this case the unit used to define costs is the Euro currency. Therefore, the results indicate that the best way to deliver 30000 units of products to factory “A” is i. Delivering 19000 units of products from factory “A” using road and rail transports and ii. Delivering 11000 units of products from factory “B” using port and rail transports. The minimised total costs and the carbon emission, opportunity, variable, fixed transportation and production costs
are 84540, 9070, 14540, 9180, 1050 and 50700 EUR, respectively. The carbon emission costs are shown to be 11percent, opportunity costs 17 percent, variable transportation 11 percent, fixed transportation 1 percent and production costs 60 percent of the total costs, respectively.
The traditional approach refers to a general procedure to select transportation modes and factories to deliver products to wholesaler in this case. The wholesaler ordered products of 30000 units from three factories (A, B, and C). 10000 units were delivered from factory “A” using Lorries. Factory “B” was also ordered to deliver 10000 units to the wholesaler but used rail transportation. The other 10,000 units were delivered from factory “C” by using waterways and railroads. The results of the traditional procedure shows total costs of 82990, production cost 52000, fixed transportation cost 1490, variable transportation cost 12100, opportunity cost 17400
Table 1: Variable Network costs per unit and fixed costs, network modes and factory supplies, demand and production costs per unit
Network mode A B Fixed C Supplycost
Port + Rail
0.11 0.23 0.25 700 170000
Port + Road
0.28 0.38 0.36 450 180000
Road + Rail
0.35 0.44 0.38 350 170000
Rail
0.4 0.45 0.35 390 120000
Road
0.51 0.56 0.44 400 80000
Factory supply
19000 18000 20000 Demand 30000
Production cost/unit
1.8 1.5 1.9 -
-Table 2: Opportunity costs
Network mode A B C
Port + Rail
0.74 0.89 0.77
Port + Road
0.66 0.85 0.87
Road + Rail
0.25 0.67 0.76
Rail
0.54 0.66 0.72
Road
0.31 0.34 0.21
Carbon emission costs
Port + Rail
0.34 0.22 0.19
Port + Road
0.53 0.8 0.55
Road + Rail
0.35 0.34 0.24
Rail
0.35 0.37 0.27
Road
EUR and 0% of carbon emissions cost respectively because carbon emissions are not considered in this case. The new legislation regulated carbon emissions will be included in transportation sector. From the review of literatures, it can be seen that there are many carbon emissions schemes proposed.
This paper assumes the carbon emissions costs from purchasing carbon permits from other companies having excess credits. Thus, the costs of carbon emissions become part of the total costs, which leads to an increase in total costs. The calculations in this case refer to the traditional procedure considering a new factor, carbon emissions costs. It can be seen that the total costs increase to 98090 EUR due to the new legislation to reduce carbon emitted into the atmosphere, of which carbon emission costs are 15100 EUR or roughly 15% of the total costs.
Due to the increase in the total costs, companies must find a new approach to making decisions considering carbon emissions costs. The new approach is the optimisation model. The optimisation model, it is obvious that this model leads to changes in the decision making process, 19000 units from factory “A” by Lorries and railroads and 11000 units from factory “B” by waterways and railroads, and a decrease in the total costs. The total costs decrease from 98090 to 84540 by 13550 EUR. It is clearly visible that the optimisation model can help reduce the total costs of transportation by 13.81%. In order to study the tendency of making decisions because of the changes of carbon emissions costs, reducing and increasing the carbon emissions costs by ±5%, ±10%, ±20%, and ±30% are applied to the optimisation model.
The major reason is that unstable carbon prices in markets are predicted. Therefore, studying this expected situation by expanding the range of carbon emissions costs leads to understanding the impacts on the decision making process in the supply chains. Despite the changed costs of carbon emissions, the decision to select the factories, the amount of products, and transportation modes stay the same as that of the optimisation model. There are also no changes in the amount of products ordered, transportation modes, and the factories to deliver products. It can be seen that the total costs are changed corresponding to only the increase and
decrease in the carbon emissions costs. However, in order to obtain further results, the carbon emissions costs increase dramatically. The penalty charge of 40 EUR per tonne carbon was indicated in the first phase of the EU-ETS and 100 EUR per tonne carbon in the second phase. The current carbon prices mentioned in the above are 22-25 EUR per tonne carbon. The penalty charge of carbon emissions is higher than the market prices by 100% for phase I and 300% for phase II approximately.
Thus, this paper will increase the carbon emissions costs by 100% and 300% in order to see whether or not the decisions will be impacted. The transportation modes and factories selected are the same as those of the optimisation model when the carbon emissions costs increase by 100%. However, the amount of products is changed from 19000 to 12000 units for factory “A” and 11000 to 18000 for factory “B”. Moreover, after the carbon emissions costs increase by 300%, both transportation modes and the factories to deliver products are changed. The intermodal transportation of waterways and railroads is selected to deliver 12000 units of products from factory “C” and 18000 units of products from factory “B”.
Now, it can be seen that the decision is changed when the carbon emissions costs increase by 100% and or more (see table 3).
Thus, it can be concluded that the decisions can be dramatically affected by changing only one factor which is the carbon emissions costs in this case. This situation may happen in the future in case the demand for carbon permits is higher than the supply because there may be only a few carbon permits traded in the markets. In this case, many firms will incur the penalty charge due to the shortage of carbon permits. In terms of environmental impacts on logistics and supply chain management, when carbon emissions trading is implemented, costs of industrial development
Table 3: Calculated results in cases of the penalty charge
Costs (EUR)
MILP 100% 300%
Carbon emission cost
9070 16320 24960
Total cost
will increase because of the investment in new types of green technology for reducing carbon emissions. Furthermore, implementing the carbon emissions trading schemes results in new business strategies because environmental issues are included in decision-making processes by considering the environmental impacts of proposed actions and alternatives to those actions. The energy costs, taxations, legislations, demands, etc. are all the factors that contribute to carbon emissions strategies and decision-making processes. The approaches to reducing carbon emissions can be necessitate a strategy to adapt companies themselves to environmental issues. Carbon emissions reduction strategies can be beneficial because it encourages companies to analyse the solutions to green issues. Integrating environmental issues into decisions made in all parts of the supply chains leads the way for sustainable development. This principle is widely adopted in many countries and firms launching voluntary integration of environment into operations levels in the supply chain management. Environmental Impact Assessment (EIA) has been increasingly integrated into organizational policies to analyse and identify possibly significant impacts of logistics and supply chains on the global environment [34]. EIA is formally defined as a procedure used to collect and identify environmental impacts of any projects established and it can be used in various types of applications, such as a regional policy programme called Strategic Environmental Assessment (SEA) [35]. In this case, EIA can be used to develop carbon emissions reductions strategies and its results will be included in decision-making processes. However, to succeed in EIA implementation, well-defined regulations, monitoring systems, training programmes, environmentally efficient facilities, and other instruments are needed to be included to help develop this assessment. In the supply chain management, there are further factors such as measurement and calculations procedures of transportation emissions. Moreover, the co-operation between the supply chain members is very important for reducing carbon emissions arising from the transportation sector. Avoiding transportation is one of the means to reducing carbon emissions. There are many factors that contribute to decreasing demands for
transportation, most of which are related to rising fuel costs. However, carbon emissions airing from transportation are another major factor that companies should be aware of. Transport avoidance can be considered as a procedure used to integrate transportation with production logistics so as to avoid freight transports. This means configurations of production and distribution can reduce the demand for freight transports. Relocating facilities leads to carbon reduction.
5. GENETIC ALGORITHM
Genetic algorithms are heuristic search techniques that utilize an analogy to “survival of the fittest”. Genetic algorithms employ a population of solutions and, through the algorithm’s main operator of crossover, combine parts of good solutions in an attempt to create better solutions. Genetic algorithms success on variety of problem has led to their application in many fields. Genetic algorithms are widely used as optimization and adaptation tools, and they became important in artificial intelligence. Genetic algorithms are a member of the class of stochastic optimization procedures that are often referred to as evolutionary algorithms. All evolutionary algorithms are heuristic population-based search procedures that incorporate random variation and selection. Typically, such population-based search procedures generate offspring in each generation. A fitness value is assigned to each offspring. Depending on their fitness, each population member is given a specific survival probability. In addition to GAs, evolutionary algorithms also include evolutionary programming and evolution strategies. A comparison of these different methods can be found in [36], and the generic form can be formalized as follows:
Step (0): Initialize and evaluate the fitness of each population member;
Step (1): Select the parents according to a selection scheme;
Step (2): Vary some components according to a pre-specified probability;
Step (3): Go to Step (1).
populations of solutions in contrast to other search techniques that work on a single solution. Searching not on the real parameter solution space but on a bit string encoding of it, they mimic natural chromosome genetics by applying genetics-like operators in search of the global optimum. An important aspect of genetic algorithms is that although they do not require any prior knowledge or any space limitations such as smoothness, convexity or unimodality of the function to be optimised, they exhibit very good performance in the majority of applications. They only require an evaluation function to assign a quality value to every solution produced. Another interesting feature is that they are inherently parallel; therefore their implementation on parallel machines reduces significantly the CPU time required [37-43]. Cantarella and Vitetta [44] analysed a heuristic multi-criteria technique based on genetic algorithms. Both network layout and link capacity are optimised. Different optimisation criteria are included for users, non-users and public system managers. Demand is considered elastic with respect to mode choice. In addition, choice of parking location is simulated. The procedure is applied to a test and to a real transportation system. Altiparmak et al. [45] provided an optimal platform for efficient and effective supply chain management. It is an important and strategic operations management problem in supply chain management, and usually involves multiple and conflicting objectives such as cost, service level, resource utilization, etc. They proposed a new solution procedure based on genetic algorithms to find the set of Pareto-optimal solutions for multi-objective supply chain network (SCN) design problem. To deal with multi-objective and enable the decision maker for evaluating a greater number of alternative solutions, two different weight approaches are implemented in the proposed solution procedure. Altiparmak [46] presented a solution procedure based on steady-state genetic algorithms (ssGA) with a new encoding structure for the design of a single-source, multi-product, multi-stage SCN. The effectiveness of the ssGA has been investigated by comparing its results with those obtained. Moanta proposed [47] the principles of an evolutionary algorithm for non-linear transportation problem and presented the three-dimensional transport problem, the model
with double sum and the non-linear objective function in which the cost depends of the quantity that is conveyed. Usually, the hypothesis more likely found in reality is the functional relation between cost and quantity. Tavakkoli-Moghaddam et al. [48-49] presented a new mathematical model for a multi-criteria parallel machine scheduling problem minimizing the total earliness and tardiness penalties as well as machine costs. Machines are defined as unrelated parallel machines, so they have different speeds. To solve such a NP-hard problem, a meta-heuristic method based on genetic algorithms is proposed and developed. New operators are defined and applied in order to improve the quality of solutions. A number of test problems are carried out and the associated computational results are represented. The results showed that the proposed algorithm was effective.
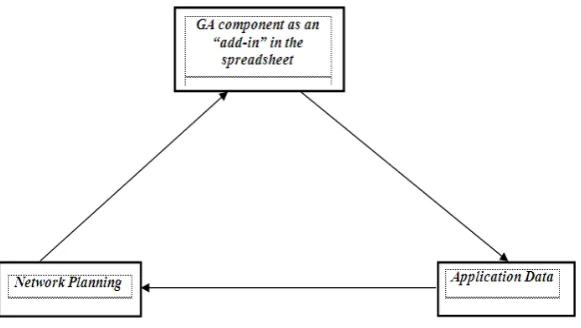
Spreadsheets are used widely in industry due to such factors as their versatility, ease of use, rapid development and ease of modification. For over a decade spreadsheets have provided intuitive applications. Bodily [50] stated that the adoption of spreadsheets as decision making aids by end-users was due to the natural interface that exists for model building, the ease of use in terms of inputs, solutions and report generation, and the ability to perform ‘what-if’ analysis. He continued that, because of these key properties, the spreadsheet medium could be used as a stepping stone for bringing operations research models and techniques to the end-user. Recent literature supports Bodily's conclusions, with successful applications in queuing systems, inventory management, aggregate planning, and analysis of manufacturing systems, financial planning, warehousing and transportation. Techniques and models include linear programming, integer programming, dynamic programming, simulation and heuristics. Spreadsheets are particularly suitable for network planning due to their fundamental representation of data in the form of easily understood tables.
presented. The cells represent the chromosome as follows:
.
.
.
,
A
,
A
,
A
,
A
,
2 3 4 51
A
(9) In the next step for solving the transportationplanning using a GA, equations are used to penalise solutions in the cost function. The final step in the implementation of the system planning using a GA is the fitness function. The fitness value of a chromosome is a measure of how well it meets the desired objective. In this case the objective is the minimisation of the network’s cost function. Choosing and formulating an appropriate objective function is crucial to the efficient solution of any given genetic algorithm problem. When designing an objective function for an optimisation problem with constraints, penalty functions can be introduced and applied to individuals that violate the imposed constraints. The fitness function in equation 1 with penalty functions is used to calculate the fitness value of
each individual. In the GA approach the parameters that influence its performance include population size, crossover rate and mutation rate. In this paper, for each combination of the parameters - crossover rate 0.15, 0.35, 0.68, 0.96, mutation rate 0.0016, 0.0055, 0.10, population size 80, 130, 230, 300 - the GA is run for twelve different random initial populations - these twelve populations being different for each combination. Thus, in total, the GA is run five hundred and seventy six times.
In order to study the tendency of making decisions because of the changes of carbon emissions costs, reducing and increasing the carbon emissions costs by ±5%, ±10%, ±20%, 100% and 300% are applied to the genetic algorithm. Table 4 shows the effects of unstable carbon emissions costs on the total costs and the
Figure 1: Integration of GA and spreadsheet
80000 84000 88000 92000 96000 100000
0 1000 2000 3000
Iterations
T
o
tal
co
st
s
Figure 2: Performance of genetic algorithm
approach to the minimum cost flow problem and transportation problem and also enables the immediate implementation, by any reader, of the methods presented here. This is a key aspect of this paper. The model of network planning developed in this research is built in ExcelTM using the spreadsheet's built-in functions. After building the model, the GA is run to optimise the network given an objective function. The fitness value and decision variables are passed back to the GA component which is independent of the spreadsheet model. At the end of the GA run, when the stopping criterion is met, the best network is presented in a tabular form in the spreadsheet. A spreadsheet model for solving this problem is presented (see Figure 1). The cells represent the chromosome (decision variables) these cells correspond to the arcs in transportation and indicate the number of units of products to be transported between each of the locations. When it comes to reproduction a GA may operate in a generation mode or in a steady-state mode. In generation mode iteration of the GA produces a whole new generation of chromosomes. In contrast, the steady-state GA produces, at iteration, just one new child chromosome from two selected parents. This child is added to the existing population and the least fit member of the population is then deleted to maintain the population size. The steady-state GA is used in this paper. The advantage of using steady-state reproduction is that all the genes are not lost as is the case in generational replacement where after replacement many of the best individuals may not be produced at all, and their genes may be lost. For the network distribution example, there are decision variables
Q
ijp as follows:....
,
Q
,
Q
,
Q
Q
Q
111, 121, 131 141 151 (8) A spreadsheet model for solving this problem isresults obtained with the genetic algorithm. These results are the same as that obtained with mixed-integer programming. Table 4 and Figures 2 and 3 also show average iterations of effects of changing carbon emissions costs by genetic algorithm. The results support the argument that genetic algorithms reduce the need for mixed integer programming since ultimately it targets an optimal solution whilst being easily adapted to different applications and, consequently, a generic
engineering tool. The results presented here support the extension of this argument into the field of topological configuration of network system in transportation. Genetic algorithms are suitable for traversing large search spaces since they can do this relatively rapidly and because the mutation operator diverts the method away from local optima, which will tend to become more common as the search space increases in size. Furthermore, genetic algorithms can work on very large and complex spaces. These properties give genetic algorithm the ability to solve many complex real-world problems. From the above result, the following conclusions are drawn regarding previous methods: 1. Most require a large number of decision variables; 2. Long computation times; 3. Most allow no user interaction; 4. Models fixed by program formulation; 5. considerable effort and good mathematical knowledge is usually required for adaptation to specific problems. Compared with other optimisation methods, genetic algorithm is suitable for traversing large search spaces since it can do this relatively rapidly and because the use of mutation diverts the method away from local minima, which will tend to become more common as the search space increases in size. Genetic algorithm gives an excellent trade-off between solution quality and computing time and flexibility for taking into account specific constraints in real situations.
6. CONCLUSIONS
equity, efficiency and costs. These issues become more or less apparent depending on the system design, in terms of scope, permit allocation and monitoring processes and efficiency. The various carbon emission control methods are: tax models; trading schemes; system of fuels (internal combustion engine technologies, electric vehicle technologies and hybrid); traffic control systems; political acceptability control costs; global climate change policy; improving vehicle maintenance standards; reduced emissions standards; global and local emissions; lowering demands for transport; global sourcing; supply chain and logistics network design; environment integration into decision making processes and improvement of energy efficiency. Supply chain and logistics network design result in positive changes of energy consumption. Environmental issues are added to the design as carbon emissions to obtain environmentally and cost effective decisions. In this case, new green developments are needed to be included in the supply chain management. The design optimisation model falls in this approach because it includes the carbon emissions costs, which allows companies to obtain cost effective and environmentally friendly solutions. Moreover, the collaborative network design can be advantageous. The collaborative logistics network design can lower carbon emissions per unit of products and the parties still have competitive advantages. Furthermore, the increase in fuel prices, limited transportation capacity, and carbon emissions trading will affect decisions of sourcing in the forthcoming future. In addition, information movement can be improved by using electronic data transfer systems instead of physical data transport. These systems include such as electronic maps or GPS navigators to improve distribution systems. Carbon emissions trading is one of the mechanisms used to reduce carbon emitted to the atmosphere. Implementing carbon emissions trading leads to the increase in total costs. This demonstrated the reason why the transportation design model under carbon emissions trading programme using mixed-integer programming and GA are developed in this paper. The value of this research is providing companies with the best decisions to select modes of transport, the amount of products, and factories. The solutions can be achieved by minimising the total costs which
include the carbon emissions costs and those decisions are cost-effective and environmentally friendly. As a result of this study, when the carbon emissions costs are considered as one of the financial burdens, the decisions of the optimisation model are changed with the lower total costs compared to the traditional procedure. Furthermore, in case the carbon emissions costs is expanded into a small range, which means the carbon emissions market prices are unstable, the decisions made are not affected. But, the decisions will change if companies are committed the penalty charges, which represents a dramatic increase in carbon emissions costs. Therefore, it can be concluded that carbon emissions costs affect the decision-making processes. The performance of genetic algorithm technique has been studied and the results compared with mixed integer programming. The genetic algorithm shows to be a very good option for transportation problem given that it obtains much accentuated reductions of iteration, which is very important for transportation planning. Finally, forthcoming future 1. Global supply chain management under the carbon emission trading program can be solved using tabu search, simulated annealing, ant colony optimization, bee algorithms, particle swarm optimization algorithm, and shuffled frog leaping algorithm. 2. The other modes of networks such as pipes etc. can be considered in new research
7. ABBREVIATIONS
TEQs: Tradable Energy Quotas.
PCAs: Personal Carbon Allowances or Rationing. EIA: Environmental Impact Assessment.
EU-ETS: European Emissions Trading Scheme. GA: Genetic Algorithm.
GHG: Green House Gas. GHGs: Green House Gases.
MILP: Mixed Integer Linear Programming. MINLP: Mixed Integer Non-Linear Programming. SEA: Strategic Environmental Assessment. SCN: Supply Chain Network.
MCDM: Multi-Criteria Decision Making. SD: Sustainable Development.
CFP: Cell Formation Problem. DM: Decision Making.
MCDA: Multi-Criteria Decision Analysis. MDDM: Multi-Dimensions Decision-Making. MADM: Multi-Attributes Decision Making. DSS: Decision-Support System.
8. ACKNOWLEDGEMENTS
The work was supported by the University of Yazd (Iran) and Liverpool (UK). I would also like to thank three anonymous reviewers for their suggestions to improve this work.
9. REFRENCES
1. Decanio, S.J., “International cooperation to avert global warming: economic growth, carbon pricing, and energy efficiency”, The Journal of Environment and Development, Vol. 1, No. 1, (1992), 41-62.
2. Metcalf, G.E., “Corporate tax reform paying the bills with a carbon tax”, Public Finance Review, Vol. 35, No. 3, (2007), 440-459.
3. Lutter, R. and Shogren, J.F., “Tradable permit tariffs: How local air pollution affects carbon emissions permit trading” Land Economics, Vol. 78, No. 2, (2002), 159– 170.
4. Babiker, M.H., Criqui, P., Ellerman, A.D., Reilly, J.M. and Viguier, L.L., “Assessing the impact of carbon tax differentiation in the European Union”, Environmental Modelling and Assessment, Vol. 8, (2003), 187–197. 5. Herber, B.P. and Raga, J.T., “An international carbon
tax to combat global warming: An economic and political analysis of the European Union proposal”, The American journal of Economics and Sociology, Vol. 54, No. 3, (1995), 257-267.
6. Spru, S.S., “Carbon trading in the policy mix”, Oxford Review of economic Policy, Vol. 19, No. 3, (2003), 420-437.
7. Monni, S., Syri, S., Pipatti, R. and Savolainen, I., “Extension of EU emissions trading scheme to other sectors and gases: Consequences for uncertainty of total tradable amount”, Water Air Soil Pollut: Focus, Vol. 7, (2007), 529–538.
8. Reilly, J., Mayer, M. and Harnisch, J., “The Kyoto Protocol and non-CO2 greenhouse gases and carbon sinks”, Environmental Modelling and Assessment, Vol. 7, (2002), 217–229.
9. Dumanski, J., “Carbon sequestration, soil conservation, and the Kyoto Protocol: Summary of implications”,
Climatic Change, Vol. 65, (2004), 255–261.
10. Clementon, R., “The bail road map: A first Step on the difficult journey to a Post-Kyoto Protocol Agreement”, The Journal of Environment Development, Vol. 17, No. 1, (2008), 70-94.
11. Bohringer, C., “The Kyoto Protocol: A review and perspectives”, Oxford Review of economic Policy, 2003, 19, (3), pp. 451-466.
12. Parry, I.W.H., “Fiscal interactions and the case for carbon taxes over grandfathered carbon permits”, Oxford Review of economic Policy, Vol. 19, No. 3, (2003), 385- 399.
13. Helm, D., Hepburn, C. and Mash, R., “Credible carbon policy”, Oxford Review of economic Policy, Vol. 19, No. 3, (2003), 438-450.
14. Callan, T., Lyons, S., Scott, S., Tol, R.S, J. and Verde, S., “The distributional implications of a carbon tax in Ireland”, Energy Policy, Vol. 37, No. 2, (2009), 407-412.
15. Keppens, M. and Vereeck, L., “The design and effects of a tradable fuel permit system”, Association for European Transport, Presented at the European Transport Conference, (2003).
16. Watters, H. and Tight, M., “Designing an emissions trading scheme suitable for surface transport”, Institute for transport studies, Faculty of environment, University of Leeds, (2007).
17. Kengpol, A., “Design of a decision support system to evaluate logistics distribution network in Greater Mekong Subregion Countries”, International Journal of Production Economics, Vol. 115, No. 2, (2008), 388-399.
18. Ma, H. and Suo, C., “A model for designing multiple products logistics networks”, International Journal of Physical Distribution & Logistics Management, Vol. 36, No. 2, (2006), 127-135.
19. Chopra, S. and Meindl, P., “Supply chain management strategy, planning and operations”, 3rd ed., Pearson Education, Inc., New Jersey, (2007).
20. Canel, C. and Khumawala, B.M., “A mixed-integer programming approach for the international facilities location problem”, International Journal of Operations & Production Management, Vol. 16, No. 4, (1996), 49-68.
21. Ostermark, R., “Invited Paper: A flexible platform for mixed-integer non-linear programming problems”, Kybernetes, Vol. 36, No. 5/6, (2007), 652-670.
22. Tavakkoli-Moghaddam, R., Sayarshadand, H.R. and ElMekkawy, T.Y., “Solving a new multi-period mathematical model of the rail-car fleet size and car utilization by simulated annealing”, International Journal of Engineering, Transactions A: Basics, Vol. 22, No. 1, (2009), 33-46.
23. Tavakkoli-Moghaddam, R., Minaeian, S. and Rabbani, M., “A new multi-objective model for dynamic cell formation problem with fuzzy parameters”, International Journal of Engineering, Transactions A: Basics, Vol. 21, No. 2, (2008), 159-172
collaborating centre on energy and environment (UCCEE), (2003). [NEP Collaborating]
25. Dobes, L., “Tradable permits in transport”, Paper to Kyoto the Impact on Australia Conference Organised by the Australian APEC Study Centre, Melbourne, (1998).
26. Watters, H., “Tradable carbon permits: Reducing CO2 from the transport sector”, Presentation at European Transport Conference, Strasbourg, (2005).
27. Starkey, R. and Anderson, K., “Domestic Tradable Quotas: A policy instrument for reducing greenhouse gas emissions from energy use”, Tyndall Technical Report 39, Tyndall Centre for Climate Change Research, (2005).
28. Waters, D., “Global logistics: News directions in supply chain management”, 5th ed., Kogan page limited, London, (2007).
29. Wadud, Z., Noland, R.B. and Graham, D.J., “Analysis of personal tradable carbon permits for the road transport sector”, Environmental Science & Policy, Vol. 11, No. 6, (2008), 533-544.
30. Raux, C., “The use of transferable permits in transport policy”, Transportation Research Part D, Vol. 9, No. 3, (2004), 185- 197.
31. Kaboli, A., Aryanezhad, M.B., Shahanaghi, K. and Tavakkoli-Moghaddam, R., “A holistic approach based on MCDM for solving location problems”, International Journal of Engineering, Transactions A: Basics, Vol. 20, No. 3, (2007), 251-262.
32. Rassafi, A.A. and Vaziri, M., “Benchmarking sustainability with respect to transportation supply and demand”, International Journal of Engineering,
Transactions A: Basics, Vol. 17, No. 4, (2004), 357-368. 33. Zak, J., “Multiple criteria evaluation & optimization of
transportation systems”, Journal of advanced transportation, Vol. 43, No. 2, (2009), 91-94.
34. Angell, L.C. and Klassen, R.D., “Integrating environmental issues into the mainstream: an agenda for research in operations management” Journal of Operations Management, Vol. 17, No. 5, (1999), 575-598.
35. Robert, L. and Bradley, Jr., “‘Climate alarmism reconsidered”, Institute of Economic Affairs, London, (2003), 41-143.
36. Back, T. and Schwefel, H.P., “An overview of evolutionary algorithms for parameter optimization”, Evolutionary Computation, Vol. 1, No. 1, (1993), 1-23. 37. Sadegheih, A. and Drake, P.R., “System network
planning expansion using mathematical programming, genetic algorithms and tabu search”, Energy Conversion & Management, Vol. 49, No. 6, (2008), 1557-1566.
38. Sadegheih, A., “Evolutionary algorithms and simulated
annealing in the topological configuration of the spanning tree”, WSEAS Transactions on Systems, Vol. 7, No. 3, (2008), 114-124.
39. Sadegheih, A., “Models in the iterative improvement and heuristic methods”, WSEAS Transactions on Advances in Engineering Education, Vol. 3, No. 4, (2006), 256-261.
40. Sadegheih, A., “Sequence optimization and design of allocation using GA and SA”, Applied Mathematics and Computation, Vol. 186, No. 2, (2007), 1723-1730. 41. Sadegheih, A., “A novel method for designing and
optimization of network”, International Journal of Engineering, Trans. A: Basics, Vol. 20, No. 1, (2007), 17-26.
42. Sadegheih, A. and Drake, P.R., "A novel experimental analysis of the minimum cost flow problem", International Journal of Engineering Transaction A: Basics, Vol. 22, No. 3, (2009), 251-268.
43. Sadegheih, A., “New formulation and analysis of the system planning expansion model”, European Transactions on Electrical Power, Vol.19, (2009), 240-257.
44. Cantarella, G.E. and Vitetta, A., “The multi-criteria road network design problem in an urban area”, Transportation, Vol. 33, (2006), 567–588.
45. Altiparmak, F., Gen, M., Lin, L. and Paksoy, T., “A genetic algorithm approach for multi-objective optimization of supply chain networks”, Computers & Industrial Engineering, Vol. 51, (2006), 196-215. 46. Altiparmak, F., “A steady-state genetic algorithm for
multi-product supply chain network design”, Computers & Industrial Engineering, Vol. 56, (2009), 521-537.
47. Moanta, D., “The principles of an evolutionary algorithm for non-linear transportation problem”, Economic Computation and Economic Cybernetics Studies and Research, Vol. 42, No.1-2, (2008), 227-235.
48. Tavakkoli-Moghaddam, R., Jolai, F., Khodadadeghan, Y. and Haghnevis, M., “A Mathematical Model of a Multi-Criteria Parallel Machine Scheduling Problem: A Genetic Algorithm”, International Journal of Engineering, Transactions A: Basics, Vol. 19, No. 1, (2006), 79-86.
49. Tavakkoli-Moghaddam, R. and Mehdizadeh, E., “A new LIP model for identical parallel-machine scheduling with family setup times minimizing the total weighted flow time by a genetic algorithm”, International Journal of Engineering, Transactions A: Basics, Vol. 20, No. 2, (2007), 183-194.
50. Bodily, S.E., “Spreadsheet modelling as a stepping stone”, Interfaces, Vol. 16, No. 5, (1986), 34-52. 51. “Evolver user’s guide”, Axcelis, Inc., Seattle, WA,