IJE TRANSACTIONS B: Applications Vol. 28, No. 2, (February 2015) 234-242
Please cite this article asS. Kahrobaee, M. Kashefi,Applications of Impedance Plane and Magnetic Differential Permeability in Microstructural Characterization of AISI D2 Tool Steel , International Journal of Engineering (IJE), TRANSACTIONS B: Applications Vol. 28, No. 2, (February 2015) 234-242
International Journal of Engineering
J o u r n a l H o m e p a g e : w w w . i j e . i rApplications of Impedance Plane and Magnetic Differential Permeability in
Microstructural Characterization of AISI D2 Tool Steel
S. Kahrobaee *, M. Kashefi
Department of Materials Science and Metallurgical Engineering, Engineering Faculty, Ferdowsi University of Mashhad, Mashhad, Iran
P A P E R I N F O
Paper history: Received 09 August 2014
Received in revised form 09 October2014 Accepted 13 November2014
Keywords:
Nondestructive Method Microstructural Changes Impedance Point
Magnetic Differential Permeability Cold Work Tool Steel
A B S T R A C T
Two nondestructive electromagnetic techniques, hysteresis loop and eddy current methodologies, have been used to characterize the microstructural changes of D2 tool steel in the course of quench and tempering treatments. To measure the retained austenite fraction in the quenched microstructure, six specimens were austenitized in the range of 1000-1130 °C. Samples austenitized at 1080 °C were also tempered in the range of 200-650 °C for characterization by eddy current and magnetic hysteresis loop outputs.. Impedance point movement and maximum differential permeability were measured as a function of austenitizing/tempering temperature to characterize the microstructural features. The study showed that good correlations exist between microstructural variations detected by destructive methods (hardness, XRD and microscopic observation) and outputs of the nondestructive techniques.
doi: 10.5829/idosi.ije.2015.28.02b.09
1. INTRODUCTION1
AISI D2 is a high-carbon, high-chromium cold work tool steel characterized by its high wear resistance, hardness, compressive strength and stability in hardening [1, 2]. The properties make the steel suitable for applications such as heavy-duty cutting tools (dies and punches).
In as quenched microstructure, the presence of high amounts of the unwanted soft phase of retained austenite (gr) poses a major problem which could negatively affect the desired mechanical properties such as hardness and wear resistancen [1-3]. As a result, controlling the amount of gr is one of the major
challenges in the heat treatment of tool steels.
Tempering, as the final stage of the heat treatment, modifies the working properties of the quenched steel, producing a desirable combination of strength, hardness and toughness [4, 5]. Tempering could be divided into the following stages [6]: 1. Up to approximately 200 °C, formation of transition carbides and lowering of carbon
1*Corresponding Author’s Email: [email protected] (M. Kashefi)
content in the martensite structure [7-9]. 2. In the range of 200-400°C, dissolving ɛ carbides and independently nucleating cementite M3C [9, 10]. 3. Above 300-400°C,
transformation of the retained austenite to lower bainite [11]. 4. At temperatures above 450 °C, precipitation of secondary carbides in the form of M7C3, MC and M2C
from the elements such as Cr, V, and Mo, respectively [9, 12, 13]. Precipitation of carbides is the main reason for secondary hardening effect. 5. At temperatures above 600 °C, carbides start to spheroidize. The conventional methods for evaluating the microstructural changes occur during the tempering of tool steels are hardness measurement to detect secondary hardening [14], X-ray diffraction techniques for assessment of retained austenite [15] and metallographic examinations to evaluate the degree of carbide spheroidization [16]. These destructive methods are not normally utilized in quality inspection of the heat treated parts due to the high cost of the tests.
In recent years, there is a growing demand for fast and reliable nondestructive methods to be applied for
materials characterization [17-20]. Magnetic/
electromagnetic techniques such as eddy current (EC) and hysteresis loop measurements with a high
sensitivity to microstructural changes have the potential as an alternative to the traditional methods for nondestructive microstructural examination of quenched and tempered steel parts [21].
Amongstvarious forms of presenting test results for eddy current nondestructive method, impedance plane is the most theoretically well-established one. Impedance plane and movement of the location of impedance point are common ways for the investigation of cracks in materials [22, 23]. Generally, changes in coil impedance with and without sample being inserted in the coil will be calculated to form impedance plane. The variables affecting the position of impedance point in the plane are resistance and reactance which change as a result of microstructural variations of the specimen being tested[21].
Bray et al. [22] and Shull [23] have theoretically investigated the effect of parameters such as lift off and resistance on impedance plane. Kashefi et al. have demonstrated the effect of decarburizing layer [24] and case depth [25] on impedance plane and illustrated the movement of impedance point in different conditions of
heat treatment process. Tempered martensite
embrittlement (TME) in high strength steel has also been detected using impedance point movement [26]. The effects of lift off and grain size of microstructure on the impedance plane have also been examined by Zergoug et al. [27]. They showed that the eddy current testing is sensitive to changes in microstructure for Al-Zn alloy and three types of steels. Foyet has studied the corrosion behavior of Al-2024 aluminum alloy coated with a chromate-free primer using impedance measurement[28]. Sheikh Amiri et al. [29] have studied the effect of surface carbon content and the variables affecting impedance plane, such as temperature, fill factor and edge effect on carburized steel.
Microstructural changes during tempering heat treatment of cold work tool steels are very complex due to the simultaneously occurring phenomena such as
retained austenite decomposition and carbide
precipitation. Thus, it is important to investigate the combined effects of the microstructural changes on electromagnetic outputs. In the present study, the effects of microstructural changes under different conditions of austenitizing and tempering temperatures of the AISI D2 steel on electrical resistivity (r) and differential permeability have been separately evaluated and their combined effects on the EC outputs have been taken into account
.
2. EXPERIMENTAL PROCEDURE
The specimens 100 × 21 × 4 mm in size were prepared from AISI D2 tool steel. Table 1 gives the chemical composition of the steel. The practical austenitizing
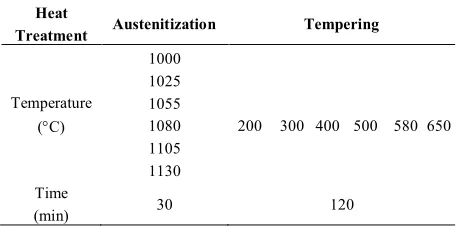
temperatures for cold work tool steels are 1000 to 1130°C. Austenitization at six temperatures was done in a vacuum furnace to avoid oxidation and decarburization. Quenching was done in oil and tempering was performed at 5 different temperatures for 2 hours, as indicated in Table 2.
The samples were polished and etched with Vilella's reagent (2 g picric acid and 5 ml HCl in 100 ml ethyl alcohol) for metallographic investigations. The cross sections of the specimens were evaluated using a scanning electron microscope (SEM VP 1450).
Hardness was measured in Rockwell C scale at 5 locations for each specimen.
A four-probe method was used for electrical resistivity measurements on the samples with the dimension of 90 ´ 4 ´ 1 mm.
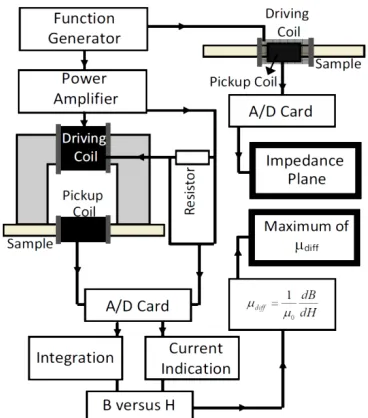
The block-scheme of the home-made testing devices of the eddy current and magnetic differential permeability (mDiff) measurement systems are shown in
Figure 1. The number of turns in the driving and pickup coils were 500 and 600, respectively. The pickup coil was placed in the center of the driving coil and the EC outputs (impedance points) were evaluated for different microstructures. For measurement of mDiff, the probe
was made using a driving copper coil of 1000 turns and a pickup coil of 500 turns wound on a U-shaped ferrite core and the sample, respectively. The driving coil gets an amplified triangular waveform signal with stepwise increasing amplitudes and fixed slope magnitude. This, produces a triangular time-variation of the effective field, V1(t), in the magnetizing circuit which can be converted to the magnetic field strength.
TABLE 1. Nominal composition of the investigated AISI D2 steel
Elements C Si Mn P S
Amount (wt%) 1.51 0.32 0.27 0.019 0.016
Elements Cr Mo Ni V Fe
Amount (wt%) 11.60 0.63 0.20 0.91 Balance
TABLE 2. Applied heat treatment cycles Heat
Treatment Austenitization Tempering
Temperature (°C)
1000 1025 1055
1080 200 300 400 500 580 650 1105
1130 Time
S. Kahrobaee and M. Kashefi / IJE TRANSACTIONS B: Applications Vol. 28, No. 2, (February 2015) 234-242 236
The induction signal for the hysteresis
measurements was recorded by induced signals in the pick-up coil, V2 (t).
In order to plot B-H curve, the measured induced voltage was used to calculate the magnetic induction (B) according to the induction law[30]:
dt dB NA t
V2()=- (1)
where A and N are the sample cross-section and number of turns round the pickup coil, respectively.
Equation 2 was also used to calculate the differential magnetic permeability (mDiff). The results were used to
plot the mDiff curve as a function of magnetic field
strength.
dH dB
Diff 0
1
m
m = (2)
where B is magnetic flux density, H magnetic field strength andm0 4π´10-7 Henry/m.
3. RESULTS AND DISCUSSION
3. 1. Destructive Characterization Figure 2
shows the scanning electron microscopic image of the sample quenched from austenitizing temperature of 1130°C. The microstructure consists of martensite (M), primary carbides (C) and retained austenite (gr).
Figure 3 shows the SEM images of the microstructures of the sample austenitized at 1080°C and tempered at 200, 580 and 650°C.
Figure 1. Block-scheme of the EC and mDiff measurement system
Figure 2. SEM image of the steel, austenitized at 1130 °C and quenched in oil
Figure 3. SEM micrograph for samples austenitized at 1080
In the microstructure of the sample tempered at 200°C (Figure 3(a)), transition carbides (mainly ɛ carbide [9]) are formed from them artensite plates. In the sample tempered at 580 °C (Figure 3(b)), carbides are precipitated in all areas of the matrix, indicating the completion of the retained austenite decomposition. In this situation, the microstructure contains carbides distributed in the ferrite matrix. Figure 3(c) shows that as the tempering temperature rises to 650°C, the carbide precipitates are spheroidized.
XRD graph of the sample quenched from austenitizing temperature of 1080 °C is presented in Figure 4. Five peaks corresponding to 2q angles of 43.47°, 50.67°, 74.67°, 90.67° and 95.94° are observed which are attributed to the (111), (200), (220), (311) and (222) planes of the austenite, respectively. The diffraction line coinciding with the (110), (200), (211) and (220) planes at 2q = 44.67°, 65.02°, 82.33° and 98.94° were considered as martensite phase. The volume fractions of the retained austenite are calculated by comparing the integrated X-ray diffraction intensity of martensite and austenite phases. The volume fraction of total carbide content was first measured by image analysis techniques. The intense peaks of the martensite and austenite were then used to estimate the retained austenite content. Details of the procedure could be found in ASTM E975-03[31].
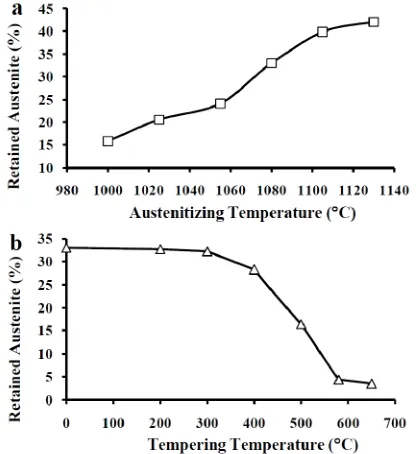
Results of the quantitative determination of the retained austenite for the quenched samples, presented in Figure 5(a), indicate a change in the volume fraction of gr from 15.7 to 42.0% with increasing austenitizing
temperature. The increase in the amount of retained austenite is attributed to the increase in dissolved carbides at higher austenitizing temperatures. The presence of higher carbon and alloying elements in the austenite solid solution results in the further reduction of both Ms (martensite-start temperature) and Mf, and, in turn, a higher amount of retained austenite.
Figure 4.X-ray diffraction pattern of austenitized sample at 1080 °C
Figure 5. Retained austenite fraction for samples a) austenitized at different temperatures, b) austenitized at 1080
°C and tempered at different temperatures
S. Kahrobaee and M. Kashefi / IJE TRANSACTIONS B: Applications Vol. 28, No. 2, (February 2015) 234-242 238
Figure 6. Variation of hardness for samples a) austenitized at different temperatures, b) austenitized at 1080°C and tempered at different temperatures
The peak in the hardness at 500°C is attributed to the precipitation of fine alloying carbides from the matrix. The subsequent decrease in the hardness with tempering at 580 °C is attributed to the formation of ferrite due to the complete decomposition of retained austenite. As the tempering temperature rises to 650°C, alloy carbides precipitate from the matrix, grow and start to spheroidize, and residual stresses are almost completely relieved, and hence the hardness is minimum.
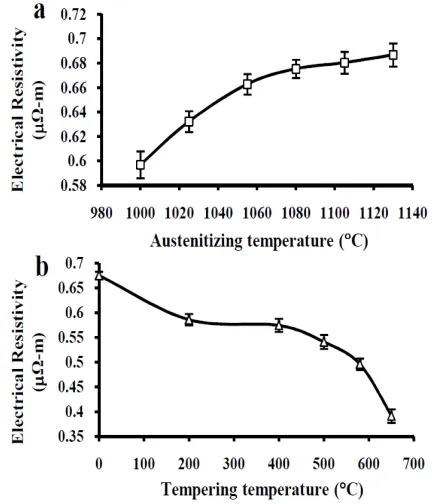
Figure 7 shows the variation of electrical resistivity for samples austenitized and tempered at different temperatures. In the as-quenched samples (Figure 7(a)), the increase in electrical resistivity can be related to the increase in dissolving of alloying elements in the matrix as well as the presence of higher amounts of retained austenite at higher austenitizing temperatures.
Correlating electrical conductivity with tempering temperature (Figure 7(b)), the tendency is different: The resistivity curve shows three stages, i.e. a decrease up to 200°C and then leveling off up to 400°C, followed by a relative decrease at higher tempering temperature (beyond 400°C). Reduction during the initial stage is attributed to the removal of carbon from martensite and decrease in point defects and dislocations densities. Further decrease in the resistivity at higher temperatures (up to 580°C) can be attributed to precipitation of the alloying carbides due to the removal of chromium, vanadium and molybdenum from solid solution as well as decomposition of retained austenite having higher electrical resistivity than martensite. At final stage of tempering, spheroidization of carbides causes a reduction in the electrical resistivity.
Figure 7. Variation of electrical resistivity for samples a) austenitized at different temperatures, b) austenitized at 1080°C and tempered at different temperatures
3. 2. Nondestructive Characterization
3. 2. 1. Differential Permeability Variations of
magnetic differential permeability (mdiff) as a function of
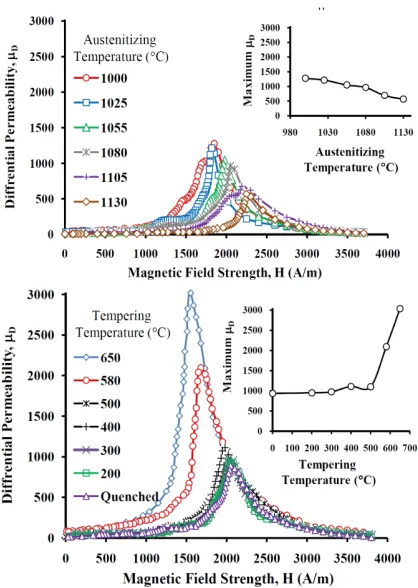
applied magnetic field for the samples austenitized and tempered at different temperatures are presented in Figure 8.
As can be seen in Figure 8(a), maximum mdiff
decrease with increase in austenitizing temperature; the highest and the lowest values of the maximum mdiff were
observed for the samples austenitized at 1000 and 1130°C, respectively.
The observed magnetic response is due to the reduction in ferromagnetic martensite volume fraction (from 77.0 to 53.2%) and an increase in concentration of carbon and alloying elements in the crystal structure of the matrix. Figure 8(b) shows mdiff changes versus
applied magnetic field for the samples tempered at 200, 300, 400, 500, 580 and 650°C.
As can be seen, the maximum mdiff increased in a
very low level with tempering at 200 and 300°C followed by an increase at 400 °C and then leveling off up to 500 °C. Finally, a continuous sharp increase can be seen at higher tempering temperatures. The initial increase in the maximum mdiff up to 200-300°C is
Figure 8.Differential permeability as a function of magnetic field strength for samples a) austenitized at different temperatures and b) austenitized at 1080 °C and tempered at different temperatures
An increase in the maximum mdiff at 400°C is due to
two factors: 1. A small amount of retained austenite is decomposed to bainite which have high fraction of soft magnetic ferrite, and 2. At 400°C, ε-carbides are replaced with cementite and thus, the crystal structure of martensite loses its tetragonality, and dislocation density reduces.
As observed, maximum mdiff for the samples
tempered at 400 and 500°C remained almost constant. This can be attributed to manifestation of two opposing mechanisms which take place simultaneously during tempering. The expected increase in maximum mdiff due
to the decomposition of retained austenite is compensated by the precipitation of secondary carbides. Formation of secondary carbides for samples tempered at 500°C, which was observed by secondary hardening effect (Figure 6(b)), provides obstacles to the movement of domain walls during magnetization. On the other hand, the reduction of paramagnetic retained austenite from 28.2to 16.3% or, in other words, formation of bainite containing magnetically soft ferrite increases the maximum mdiff, significantly.
By increasing the tempering temperature up to 580°C, as the decomposition of retained austenite is
completed, a large increase in mdiff can be seen (from
1100 to 2090). In this stage, the dominant effect on the drastic increase is attributed to the more favorable response of ferrite (matrix containing of carbides) to the applied magnetic field in comparison to the hard magnetically martensite and nonmagnetic retained austenite phases.
As presented in Figure 8(b), the highest maximum
mdiff reading was obtained for the sample tempered at
650°C. Since the decomposition of retained austenite completed at 580°C, spheroidization of carbides (as shown in Figure 3(c)) has a dominant effect on the maximum mdiff. For the sample tempered at 580°C, the
nature of pinning sites for domain walls is mainly determined by carbide lamellae in ferrite grains. The large interfacial area of carbide lamellae, which in turn, increases volume fraction of pinning sites, and subsequently increases the energy loss and restricts the movement of domain walls during the magnetization process. In carbide spheroidization process, average distance between pinning sites increases allowing domain walls to move more freely. These morphological changes as well as complete relief in residual stresses result in a drastic increase in the mdiff
from 2090 to 3040.
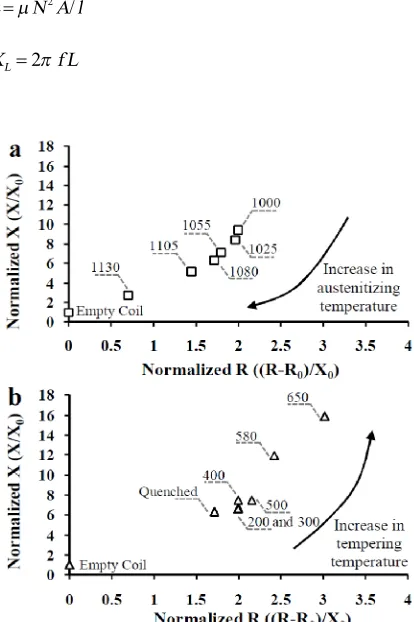
3. 2. 2. Impedance Plane The details of the
impedance plane calculations can be found elsewhere in literature [24, 33]. Impedance plane is formed by drawing normalized R (total resistance) as a function of normalized X (total reactance) which is shown in Figure 9. The normalized ones are calculated using Equations (3) and (4).
Normalized R=(R-R0)/X0 (3)
Normalized X=X/X0 (4)
where, R0 and X0 are the free space probe resistance and reactance, respectively.
Variables which can affect the position of impedance point in the plane are resistance and reactance. The results of calculations for characterization of tempered microstructures are presented in Figure 9.
· In the presence of the ferromagnetic sample, the probe inductance (reactive impedance) increases contrary to the EC effect, which decreases inductance. Simply, the magnetic flux density is in phase with the applied field for an increase in the magnetic permeability (μr) (neglecting hysteresis losses caused by
S. Kahrobaee and M. Kashefi / IJE TRANSACTIONS B: Applications Vol. 28, No. 2, (February 2015) 234-242 240
and major increase due to the effect of large mr of the
ferromagnetic sample.
· As shown in Figure 9(a), normalized R (which
is equal to the resistive losses) decreases with austenitizing temperature. It is attributed to the increase in ρ, which in turn, reduces eddy current flow in the sample[23].
· Increasing the austenitizing temperature leads to an increase in the fraction of retained austenite which acts as strong pinning sites to domain wall motion. Thereby, a reduction in magnetic permeability is expected.
· As shown in Figure 9(b), normalized R
increases with temping temperature which is due to the decrease in electrical resistivity (according to Figure 7(b)). Increase in mdiff at 200-300°C tempering and
subsequent increase in mdiff at 400°C leads to an increase
in the inductance. Increase in inductance at higher tempering temperatures is also attributed to the increase in the mdiff.
According to Equations (5) and (6), inductance and reactance decrease with austenitizing temperature due to the decrease in mdiff and increase with tempering
temperatures as a result of increase in the mdiff, (as
observed in Figure 8).
l A N
L=m 2 / (5)
L f
XL=2p (6)
Figure 9. Impedance plane and effect of a) austenitizing temperature, and b) tempering temperature, on location of impedance point
where L is coil inductance, μ the magnetic permeability,
N the number of turns round the coil, A the cross sectional area, l the coil length, XL reactance and f the
frequency of applied current.
4. CONCLUSION
In the present paper, the microstructural changes due to application of different heat treatment cycles on AISI D2 tool steel have been evaluated by nondestructive eddy current and hysteresis loop measurements. The main conclusions from this work are as follows: 1. The points on impedance plane move downwards and maximum magnetic differential permeability decreases as the retained austenite fraction increases in quenched samples.
2. The relative changes of the differential permeability due to the tempering treatment were:
·
A small increase (3 %) with tempering at 200 and 300°C due to the precipitation of carbides and cementite, respectively.·
A moderate increase at 400°C (18%) related to the retained austenite decomposition. The constant value was obtained at 500°C which is attributed to the manifestation of two opposing agents, precipitation of alloying carbides and retained austenite decomposition.·
Finally, a sharp increase at 580°C (124%) and 650°C (225%) as a result of the complete decomposition of the retained austenite and the spheroidization of carbides, respectively.3. A good agreement between destructive (hardness, XRD, microscopic observation) and nondestructive
results showed the applicability of the
electromagnetic/magnetic methods in microstructural characterization of the heat treated tool steel.
5. REFERENCES
1. Roberts, G.A. and Kennedy, R., "Tool steels, ASM International, (1998).
2. Thelning, K.-E. and Black, C.M., "Steel and its heat treatment, Butterworths London, Vol. 1, (1984).
3. Totten, G.E. and Howes, M.A., "Steel heat treatment handbook, CRC Press, (1997).
4. Unterweiser, P.M., "Heat treater's guide: Standard practices and procedures for steel, Asm Intl, (1982).
5. Avner, S.H., "Introduction to physical metallurgy", (1964). 6. Carlson, E., "Cold treating and cryogenic treatment of steel in
asm handbook, vol. 4 heat treating", ASM International, 10th
Ed., Metals Park, OH, (1990), 203-206.
8. Williamson, D., Nakazawa, K. and Krauss, G., "A study of the early stages of tempering in an fe-1.2 pct alloy", Metallurgical
Transactions A, Vol. 10, No. 9, (1979), 1351-1363.
9. Gavriljuk, V.G., Sirosh, V.A., Petrov, Y.N., Tyshchenko, A.I., Theisen, W. and Kortmann, A., "Carbide precipitation during tempering of a tool steel subjected to deep cryogenic treatment",
Metallurgical and Materials Transactions A, Vol. 45, No. 5,
(2014), 2453-2465.
10. J., P. and B., P., "Effect of tempering temperature on 30hgsa steel toughness", Metallurgy and Casting, Vol. 10, No., (1984), 409-421.
11. Kokosza, A. and Pacyna, J., "Evaluation of retained austenite stability in heat treated cold work tool steel", Journal of
Materials Processing Technology, Vol. 162, No., (2005),
327-331.
12. Bała, P., Pacyna, J. and Krawczyk, J., "The kinetics of phase transformations during tempering of cr-mo-v medium carbon steel", Journal of Achievements in Materials and
Manufacturing Engineering, Vol. 20, No. 1-2, (2007), 79-82.
13. Bała, P., Pacyna, J. and Krawczyk, J., "The influence of the kinetics of phase transformations during tempering on the structure development in a high carbon steel", Archives of
Metallurgy and Materials, Vol. 52, No. 1, (2007), 113-120.
14. Handbook, M., "Heat treating", vol, Vol. 4, No., (1991), 744. 15. Tavares, S.S.M., Mello, S.R., Gomes, A.M., Neto, J.M., da
Silva, M.R. and Pardal, J.M., "X-ray diffraction and magnetic characterization of the retained austenite in a chromium alloyed high carbon steel", Journal of Materials Science, Vol. 41, No. 15, (2006), 4732-4736.
16. Samuels, L.E., "Optical microscopy of carbon steels, American Society for Metals, (1980).
17. Farrahi, G.H. and Lebrun, J.L., "Surface hardness measurement and micro-structural characterization of steel by x-ray diffraction profile analysis", International Journal of Engineering, Vol. 8, No. 3, (1995), 159-167.
18. Farrahi, G.H., "The dc electrical potential method for the measurement of fretting cracks", International Journal of
Engineering, Vol. 9, No. 1, (1996), 19-27.
19. Rakideh, M., Dardel, M. and Pashaei, M., "Crack detection of timoshenko beams using vibration behavior and neural network", International Journal of Engineering-Transactions
C: Aspects, Vol. 26, No. 12, (2013), 1433.
20. Wang, Y. and Wu, Q., "Experimental detection of composite delamination damage based on ultrasonic infrared thermography", International Journal of Engineering
(1025-2495), Vol. 27, No. 11, (2014).
21. Hagemaier, D.J., "Fundamentals of eddy current testing, American Society for Nondestructive Testing, (1990).
22. Bray, D.E. and Stanley, R.K., "Nondestructive evaluation: A tool in design, manufacturing and service, CRC press, (1996). 23. Shull, P.J., "Nondestructive evaluation: Theory, techniques, and
applications, CRC press, (2002).
24. Kashefi, M. and Kahrobaee, S., "Dual-frequency approach to assess surface hardened layer using nde technology", Journal of
materials engineering and performance, Vol. 22, No. 4,
(2013), 1108-1112.
25. Kashefi, M., Rafsanjani, A., Kahrobaee, S. and Alaee, M., "Magnetic nondestructive technology for detection of tempered martensite embrittlement", Journal of Magnetism and
Magnetic Materials, Vol. 324, No. 23, (2012), 4090-4093.
26. Zergoug, M., Lebaili, S., Boudjellal, H. and Benchaala, A., "Relation between mechanical microhardness and impedance variations in eddy current testing", NDT & E International, Vol. 37, No. 1, (2004), 65-72.
27. Foyet, A., Wu, T., Kodentsov, A., van der Ven, L., de With, G. and van Benthem, R., "Impedance evaluation of permeability and corrosion of al-2024 aluminum alloy coated with a chromate free primer", Progress in Organic Coatings, Vol. 65, No. 2, (2009), 257-262.
28. Amiri, M.S. and Kashefi, M., "Investigation of variables affecting impedance plane in eddy current testing of carburized steels", Journal of materials engineering and performance, Vol. 20, No. 3, (2011), 476-480.
29. Stupakov, O., "Investigation of applicability of extrapolation method for sample field determination in single-yoke measuring setup", Journal of Magnetism and Magnetic Materials, Vol. 307, No. 2, (2006), 279-287.
30. Standard, A., "E975-03: Standard practice for x-ray determination of retained austenite in steel with near random crystallographic orientation", ASTM, West Conshohocken, PA, Vol., No., (2008).
31. Davut, K. and Gür, C.H., "Monitoring the microstructural changes during tempering of quenched sae 5140 steel by magnetic barkhausen noise", Journal of Nondestructive
Evaluation, Vol. 26, No. 2-4, (2007), 107-113.
S. Kahrobaee and M. Kashefi / IJE TRANSACTIONS B: Applications Vol. 28, No. 2, (February 2015) 234-242 242
Applications of Impedance Plane and Magnetic Differential Permeability in
Microstructural Characterization of AISI D2 Tool Steel
S. Kahrobaee, M. Kashefi
Department of Materials Science and Metallurgical Engineering, Engineering Faculty, Ferdowsi University of Mashhad, Mashhad, Iran
P A P E R I N F O
Paper history: Received 09 August 2014
Received in revised form 09 October 2014 Accepted 13 November 2014
Keywords:
Nondestructive Method Microstructural Changes Impedance Point
Magnetic Differential Permeability Cold Work Tool Steel
هﺪﯿﮑﭼ
شورزاﺮﺿﺎﺣﺶﻫوﮋﭘرد
يﺎﻫ ﺴﯿﻃﺎﻨﻐﻣوﺮﺘﮑﻟا ﯽ
/
ﻪﺼﺨﺸﻣردﯽﺑادﺮﮔنﺎﯾﺮﺟوﺲﯾزﺮﺘﺴﯿﻫﻪﻘﻠﺣﯽﺴﯿﻃﺎﻨﻐﻣ
راﺰﺑادﻻﻮﻓﯽﺑﺎﯾ
رﺎﮐدﺮﺳ
D2
ﺖﺤﺗﻪﮐ
زاتوﺎﻔﺘﻣﻂﯾاﺮﺷ
ﺖﺳاهﺪﺷهدﺎﻔﺘﺳا،ﻪﺘﻓﺮﮔراﺮﻗﺮﭙﻤﺗوﭻﻨﺋﻮﮐتﺎﯿﻠﻤﻋ
.
هزاﺪﻧارﻮﻈﻨﻣﻪﺑ
ﺮﺴﮐيﺮﯿﮔ
ﺑﺖﯿﻨﺘﺳآ
،ﭻﻨﺋﻮﮐتﺎﯿﻠﻤﻋزاﻞﺻﺎﺣرﺎﺘﺧﺎﺳﺰﯾرردهﺪﻧﺎﻤﯿﻗﺎ
6
ﻣردﻪﻧﻮﻤﻧ
ﺤ
ﯽﯾﺎﻣدهدوﺪ
1000
ﺎﺗ
1130
ﯽﺘﻧﺎـﺳﻪـﺟرد
داﺮـﮔ
ﺪﻧﺪﺷﻪﺘﯿﻨﺘﺳآ
.
ﻪﻧﻮﻤﻧ،ﻦﯿﻨﭽﻤﻫ
ﯾﺎﻫ
ﺪﺷﻪﺘﯿﻨﺘﺳﺂ
ﻫ
يﺎﻣدرﺪ
1080
ﯽﺘﻧﺎﺳﻪﺟرد
داﺮﮔ
ﯽﯾﺎـﻣدهزﺎﺑردﺮﭙﻤﺗتﺎﯿﻠﻤﻋﺖﺤﺗ
200 ﺎـﺗ
650
ﯽﺘﻧﺎﺳﻪﺟرد
ﺪﻨﺘﻓﺮﮔراﺮﻗداﺮﮔ
ﺑيﺎﻫرﺎﺘﺧﺎﺳﺰﯾرﺎﺗ
ﻪ
شورزاهدﺎﻔﺘـﺳاﺎـﺑهﺪـﻣآﺖـﺳد
ﻪـﻘﻠﺣوﯽـﺑادﺮﮔنﺎـﯾﺮﺟيﺎـﻫ
بﺮﺨﻣﺮﯿﻏترﻮﺻﻪﺑﺲﯾزﺮﺘﺴﯿﻫ
ﯽﯾﺎﺳﺎﻨﺷ ﺪﻧﻮﺷ
.
رﻮﻈﻨﻣﻪﺑ
ﯽﯾﺎﺳﺎﻨﺷ تاﺮـﯿﯿﻐﺗ يرﺎﺘﺧﺎـﺳﺰﯾر
هﺪـﺷدﺎـﺠﯾا
ﻪـﻄﻘﻧﺖـﮐﺮﺣ،
ﻦﯿﻨﭽﻤﻫوﻪﻃﻮﺑﺮﻣﻪﺤﻔﺻردﺲﻧاﺪﭙﻣا
ﻢﻤﯾﺰﮐﺎﻤﺗاﺮﯿﯿﻐﺗ
ﯽﻠﺿﺎﻔﺗيﺮﯾﺬﭘذﻮﻔﻧ
يﺎـﻫﺎﻣدزاﯽﻌﺑﺎـﺗترﻮﺻﻪﺑ
ﺮـﭙﻤﺗوﻪﺘﯿﻨﺘـﺳآ
ﺪﺷﯽﺳرﺮﺑ
.
ﯽﺳرﺮﺑ ﺮﮕﻧﺎﯿﺑﺎﻫ
شورﺎﺑهﺪﺷﯽﯾﺎﺳﺎﻨﺷيرﺎﺘﺧﺎﺳﺰﯾرتاﺮﯿﯿﻐﺗﻦﯿﺑﯽﺑﻮﺧطﺎﺒﺗرا
بﺮﺨﻣيﺎﻫ
)
،ﯽﺘﺨﺳ ﺷاﺮﭘ ﻪﻌﺷﺎ
ﯽﭘﻮﮑﺳوﺮﮑﯿﻣتاﺪﻫﺎﺸﻣوﺲﮑﯾا
(
ﯽﺟوﺮﺧو
يﺎﻫ ﮏﯿﻨﮑﺗ يﺎﻫ بﺮﺨﻣﺮﯿﻏ ﺖﺳا
.