A b s t r a c t. Soil scientists often examine the soil structure and macroporosity by observing sections using a variety of micro-scopic and photographic techniques. The most frequent parameters used in the image analysis to characterize pores are: shape factors (like circularity, compactness, elongation,etc.), size parameters (surface area, Crofton perimeter,etc.) and arrangementegMBR (minimum bounding rectangle) angle. The pores are usually classified according to equivalent pore diameter estimated from the area of pores.
This paper presents a proposal of a method for separating macropores according to their real diameter. Aphelion, the image analysis system, was used to prepare a procedure for splitting soil macropores and dividing them into selected fractions according to the diameter. The procedure was tested on porous and compacted soil samples which differ in their porosity, pore shape and size. The results show that the detection of macropores according to the real pore diameter is suitable for the characterization of the actual state of soil macroporosity, especially in porous soils with continuous branching macropore system.
K e y w o r d s: macroporosity, pore diameter, image analysis
INTRODUCTION
Soil macroporosity is an important indicator of soil structure conditions. Management practices in agriculture as well as meteorological factors, amelioration, and root and earthworm activity, induce changes in soil porosity (Bryket al., 2000; Pagliai and Vignozzi, 2002). Soil macroporosity is also a well-known factor influencing soil fertility, gas exchange, and water movement (Bullock and Thomasson, 1979; Gliñski and Stêpniewski, 1985). The importance of macropores in many soil-plant-root relations has motivated many researches to describe their features like shape, size, orientation and arrangement. To quantify soil structural
changes, pore space measurements are being increasingly used. Image analyses on sections prepared from undisturbed soil samples allow precise quantification of soil macro-porosity (Pagliaiet al., 1983; Ringroase-Voase and Bullock, 1987). Pore size distribution is often used to characterize soil pores with pore diameter as the criterion for this distribution. The pore diameter is usually equal to an equivalent pore diameter (EPD) calculated from the surface area (S) of pores (Bryk, 2001):
EPD=2 ( /S p). (1)
In fact pores have a wide range of size and shape, especially pores of soils in agricultural use (Czachor and Lipiec, 2004; Pagliai and Vignozzi, 2002). In some cases pores are rounded and they are classified as chambers, channels or spherical pores. These pores are the result of earthworm, root or gas bubble activity. In many other cases pores are irregular, with numerous links, and they develop continuous pore space around soil aggregates (Fitzpatrick, 1980; Ringroase-Voase and Bullock, 1987). Equation (1) is suitable only for such regular and oval pores. When calcu-lating the equivalent pore diameter, the whole continuous pore space is treated as one object with an enormous area. In this case the equivalent pore diameter calculation does not make any sense.
The developments in image analysis provide a possibility of introducing more accurate methods for macropore cha-racteristics. The aim of this study is to propose a new me-thod for macropore identification based on real pore diame-ter and not dependent on the surface area of particular pores.
Application of image analysis for soil macropore characterization according
to pore diameter
T. G³¹b
Department of Machinery Exploitation, Ergonomics and Agronomy Fundamentals, University of Agriculture Mjra £upaszki 6, 31-198 Cracow, Poland
Received September 25, 2006; accepted January 8, 2007
© 2007 Institute of Agrophysics, Polish Academy of Sciences
Corresponding author’s e-mail: [email protected]
A A
Agggrrroooppphhyhyysssiiicccsss w
w
MATERIALS AND METHODS
In 2005 soil samples were taken from a pot experiment located in Mydlniki near Cracow, with different levels of soil compaction as the treatment (G³¹b, 2005). The pot experiment was conducted in 2003-2005. The treatment of this experiment was soil compaction in completely randomi-zed design with four replications. The three levels of soil compaction were established according to the degree of compactness (D): 70% (D70), 80% (D80) and 90% (D90). The range of D from 70 to 90% is characteristic for agri-cultural soils and corresponds to results obtained by Hakans-son and Lipiec (2000). The degree of compactness is defined as the dry bulk density as a percentage of reference bulk density obtained by a standardized uniaxial compression test (Proctor test) at 200 kPa (Håkansson, 1990; Håkansson and Lipiec, 2000). The reference bulk density of the soil used in the experiment was 1.65 g cm-3. Table 1 reports the soil characteristics. The D70 compaction level was established using a 1 kg compaction hammer dropped from a height of 50 cm. For the D80 and D90 levels, 5 and 10 kg hammers were used, respectively. After compaction, alfalfa (Medicago sativa) seeds were sown at a rate of 16 plants per pot. For further analysis soil samples from two treatments: very porous (D70) and strongly compacted (D90) were taken into consideration (Table 2). The soil sections were prepared from undisturbed soil samples (Jongerius and Heintzberger, 1975; Murphy, 1989; S³owiñska-Jurkiewicz and Dom¿a³, 1988). They were taken from the 10-18 cm soil layer in a ver-tical position using metal boxes (80x90x40 mm). Samples were dried at room temperature for 4 weeks. Then they were saturated with polyester resin (POLIMAL 109 32K) at a
tem-perature of 20°C. The samples were put in a vacuum cham-ber. The pressure was cyclically (5 times) changed from -85 kPa to atmospheric pressure in order to remove any entrap-ped air. The hardening of the resin took approximately two months. Then the samples were cut to slices (5 mm thick) using a diamond cutting machine with a water cooling system. After cutting the surfaces of the slices were grinded to remove any scratches.
The surfaces of samples were scanned, at a resolution of 600 dpi, using Epson Perfection 4870 Photo scanner and the images were saved as tiff files. The images were analysed using the APHELION software for image analysis (ADCIS SA, AAI Inc., 2002). The whole procedure of image analyses was composed of 4 main steps: filtering, segmen-tation, pore detection and measurements (Wojnar and Majorek, 1994). For every image two procedures of image analysis were applied. One of them was pore selection according to their real pore diameter. The real pore diameter (RPD) can be defined as the length (mm) of straight line that extends
from one
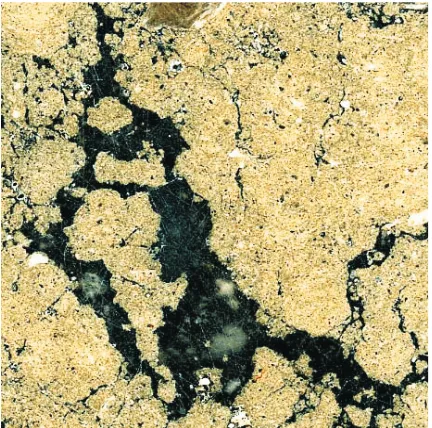
edge of the object (pore) to the opposite edge, through the centre of the object (circular pores), or perpendicular to the longitudinal axis of the object (elongated pores). The following Aphelion functions were used to prepare this procedure:1. ImgColorToRGB - the input image (Fig. 1) was split into three bands: red (R), green (G) and blue (B). Because of the best contrast, grey image based on the red band (R) was prepared for further processing.
2. ImgLowPass3x3 – to perform low-pass filtering on an image using a 3x3 kernel in order to remove noise from the image.
Parameters Units Values
pH (KCl) (-) 6.5
Total organic C g kg-1 25.8
Total N g kg-1 2.10
C/N (-) 12.3
Reference bulk density g cm-3 1.65
Sand g kg-1 290
Silt g kg-1 670
Clay g kg-1 40
T a b l e 1. Chosen paprameters of the investigated soil (silty loam)
Para-meters
Density of solid phase (g cm-3)
Bulk density (g cm-3)
Total porosity (cm3cm-3)
Penetration resistance
(MPa)
D70 2.53 1.20 0.526 1.1
D90 2.53 1.56 0.383 3.2
T a b l e 2.Physical parameters of tested soils
Fig. 1.Cross section of soil from 10-18 cm soil layer (fragment
3. ImgMaximumContrastThreshold – this operator picks a set of thresholds that give maximal contrast. It automatically selects thresholds that maximize the global average contrast of edges detected by the thresholds across the image (Fig. 2).
4. ImgOpen – this operator performs a morphological opening on all the regions and it was used to remove small objects with 1 pixel area.
5. ImgThinSkeleton - thinning of the objects to get a line in the middle of the object (Fig. 3).
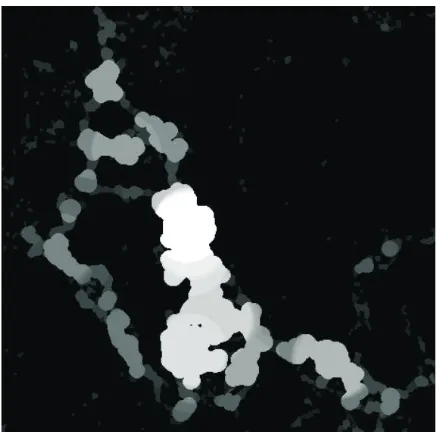
6. ImgGraphDistance - this operator computes for every white point of a binary input image the distance to the background (distance to the nearest black point) (Fig. 4).
7. ImgDilate – this operator is used to perform a morpholo-gical dilation of the source objects due to increase of grey level filling from the centre to the border of objects (Fig. 5).
Fig. 2.Macropores selected by ImgMaximumContrastThreshold
operator (pores appear red).
Fig. 3.Skeleton of macropores after ImgThinSkeleton operator. Fig. 5.Dilated pixels fill in the objects with full range grey level
value.
Fig. 4.Image after mgGraphDistance operator. The brightness of
8. ImgTreshold – to create the binary image. Using six different ranges of threshold bounds allows to get six groups of objects differing in size (Fig. 6).
9. ObjComputeMeasurements – the final operator which computes a variety of measurements for different spatial objects.
Then the second procedure for selecting pores according to the equivalent pore diameter was applied (steps of procedure described above):
1. ImgColorToRGB 2. ImgLowPass3x3
3. ImgMaximumContrastThreshold 4. ImgOpen
5. ObjComputeMeasurements – calculation of equiva lent pore diameter based on the area of pores (Eq. 1).
Finally two sets of objects (pores), resulting from both methods of pore selection, were divided according to their shape and size. The pores were divided into six fractions according to their diameter:
– >2000 µm, – 1000-2000 µm, – 500-1000 µm, – 200-500 µm, – 100-200 µm, – 50-100 µm.
The pores of every fraction were also divided according to their shape as expressed by circularity (Eq. 2) as the shape factor (Pagliai, 1983):
c= 4ðA/P2
(2)
where:c– circularity,A– area,P– perimeter.
The macropores were divided into three shape classes: – regular – circularity of 0.5-1.0,
– irregular – circularity of 0.2-0.5, – elongated – circularity of 0.0-0.2.
RESULTS
Two methods of splitting macropores, according to EPD and RPD, were compared for two kinds of soils differing in their macroporosity. The results showed that for porous soil with large continuous pore space (Fig. 7) the
Fig. 6.Macropores divided into six fractions according to pore
diameter. (>2000 µm, red; 1000-2000 µm, green; 500-1000 µm, blue; 200-500 µm, yellow; 100-200 µm, light blue; 50-100 µm, purple color).
Fig. 8.Example of compacted (D90) soil sample (pores appear
black).
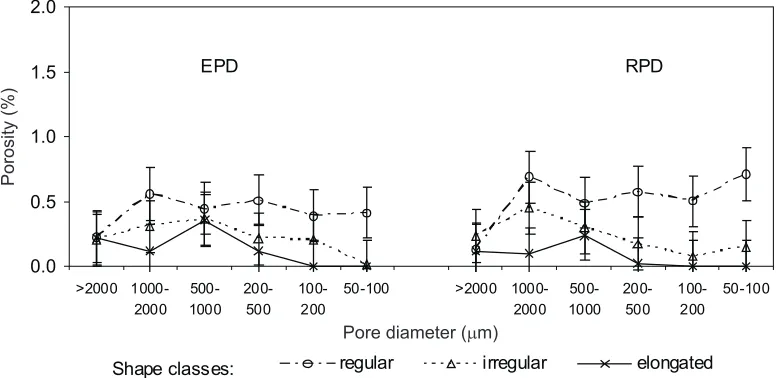
method of splitting pores based on the RPD provides better characterization of their geometry. Pore characterization according to the EPD treated all connected pores as one pore with big area and it yielded an enormously big pore diameter (Fig. 9). The final result showed considerable participation of pores with >2000 µm in diameter, approximately 9% (42% of the total pores area). All of these pores were in 100% recognized as elongated. Whereas, the pores with >2000 µm in diameter, determined according to the RPD, were only 5% of total macroporosity. There was different participation of regular, irregular and elongated pores, 81, 11, and 8% respectively. For other fractions of pores similar relationships were noticed.
As the compacted soil was considered, the results were very similar for both methods of pore quantification. This
soil was characterized by discrete, separated and rounded pores, usually produced by earthworms and roots (Fig. 8). For this kind of pores there were no significant differences between the compared methods of pore quantification in the participation of different pore fractions, in terms of both shape and diameter classification (Fig. 10).
Summarizing the above considerations it was found that proposed method of splitting macropores according the RPD is suitable for all types of soil structure. Particularly for branching pores system, the results reflect the real pore arrangement. In fact most of the soils in agricultural use (including grasslands and forests) are characterized by such a type of structure. The proposed method would be recom-mended for structure analysis in the investigation of the influence of tillage, crop rotation, organic fertilization, etc.
0 2 4 6 8 10 12 >2000 1000-2000 500-1000 200-500 100-200
50- 100 >2000 1000-2000 500-1000 200-500 100-200 50-100
regular irregular elongated
p
oro
si
ty
(%)
pore diameter (µm)
Shape classes:
EPD RPD
Fig. 9.Pore distribution of porous soil (D70) according to EPD and RPD detection. Bars represent standard error.
0.0 0.5 1.0 1.5 2.0 >2000 1000-2000 500-1000 200-500 100-200
50-100 >2000 1000-2000 500-1000 200-500 100-200 50-100
regular irregular elongated
p oro si ty (% )
pore diameter (µm)
Shape classes:
EPD RPD
Fig. 10.Pore distribution of compacted soil (D90) according to EPD and RPD. Bars represent standard error.
Porosity
(%)
Porosity
(%)
Pore diameter (mm)
CONCLUSIONS
1. Application of presented image analysis procedure in soil structure characterization allows to separate the pore classes according to their real diameter
2. Soil macropore classification based on equivalent pore diameter does not reflect the real macropore arran-gement, especially in porous soil with continuous branching macropore system.
3. The detection of macropores according to the real pore diameter is a proposition for the characterization of the actual state of soil macroporosity corresponding with air-water properties of soil.
REFERENCES
Aphelion Image and Understanding Software, version 3.2f, ADCIS S.A. and Amerinex Applied Imaging, Inc.,2002.
Bryk M., 2001. Computer-aided image analysis as a tool for
examination on soil structure (in Polish). Acta Agrophysica, 48, 41-45.
Bryk M., Dom¿a³ H., Pranagal J., and S³owiñska-Jurkiewicz A., 2000. An attempt to characterise soil macroporosity on the basis of structure standards. Acta Agrophysica, 35, 23-30.
Bullock P. and Thomasson J., 1979.Rothamsed studies of soil
structure. II. Measurement and characterization of macro-porosity by image analysis and comparison with data from water retention measurements. J. Soil Sci., 30, 391-413.
Czachor H. and Lipiec J., 2004. Quantification of soil
macro-porosity with image analysis. Int. Agrophysics, 18, 217-223.
Fitzpatrick E.A., 1980. Micromorfology of Soils. Chapman and
Hall Press, London-New York.
Gliñski J. and Stêpniewski W., 1985.Soil Aeration and Its Role
for Plants. CRC Press, Boca Raton, FL, USA.
G³¹b T., 2005.The influence of roots of perennial legumes on the water retention of soil. Bericht uber die 11 Lysimetertagung, Lysimetrie Im Netzwerk Der Dynamik Von Okosystem, BAL Gumpenstein, Austria.
Håkansson I., 1990.A method for characterizing the state of
compactness of the plough layer. Soil Till. Res., 16, 105-120.
Håkansson I. and Lipiec J., 2000.A review of the usefulness of relative bulk density values in studies of soil structure and compaction. Soil Till. Res., 53, 71-85
Jongerius A. and Heintzberger G., 1975. Methods in Soil
Micromorphology. A technique for the preparation of large thin sections. Soil Survey Papers, 10, Soil Survey Institute Press, Wageningen, The Netherlands.
Murphy C.P., 1989.Thin Section Preparation of Soils and
Sedi-ments. AB Academic Publishers, Herts, UK.
Pagliai M., La Marca M., and Lucamate G., 1983.
Micromor-phometric and micromorphological investigation of a clay loam soil in viticulture under zero and conventional tillage. J. Soil Sci., 34, 391-403.
Pagliai M. and Vignozzi N., 2002. The soil pore system as an
indicator of soil quality. Advances in GeoEcology, 35, 65-90.
Ringroase-Voase A.J. and Bullock P., 1987.The automatic
re-cognition and measurement of soil pore types by image analysis and computer programs. J. Soil Sci., 35, 673-684.
S³owiñska-Jurkiewicz A. and Dom¿a³ H., 1988.Application of
the morphological analysis in soil structure investigations (in Polish). Roczn. Glebozn., 39(4), 7-19.
Wojnar L. and Majorek M., 1994.Computer Image Analysis (in