R E S E A R C H
Open Access
The effect of industry-related air pollution
on lung function and respiratory symptoms
in school children
Arnold D. Bergstra
1,3*, Bert Brunekreef
2,4and Alex Burdorf
1Abstract
Background:Heavy industry emits many potentially hazardous pollutants into the air which can affect health. However, the effects of air pollution from heavy industry on lung function and respiratory symptoms have been investigated scarcely. Our aim was to investigate the associations of long-term air pollution from heavy industry with lung function and respiratory symptoms in school children.
Methods:A cross-sectional lung function study was conducted among school children (7–13 years) in the vicinity of an area with heavy industry. Lung function measurements were conducted during school hours. Parents of the children were asked to complete a questionnaire about the health of their children. A dispersion model was used to characterize the additional individual-level exposures to air pollutants from the industry in the area. Associations
between PM2.5and NOXexposure with lung function and presence of respiratory symptoms were investigated by
linear and/or logistic regression analysis.
Results:Participation in the lung function measurements and questionnaires was 84% (665/787) and 77% (603/787) , respectively. The range of the elevated PM2.5and NOXfive years average concentrations (2008–2012) due to heavy industry were 0.04–1.59μg/m3and 0.74–11.33μg/m3respectively. After adjustment for confounders higher exposure to PM2.5and NOX(per interquartile range of 0.56 and 7.43μg/m
3
respectively) was associated with lower percent predicted peak expiratory flow (PEF) (B -2.80%, 95%CI -5.05% to−0.55% and B -3.67%, 95%CI -6.93% to−0.42% respectively). Higher exposure to NOX(per interquartile range of 7.43μg/m3) was also associated with lower percent forced vital capacity (FVC) and percent predicted forced expiration volume in 1 s (FEV1) (B -2.30, 95% CI -4.55 to−0.05 and B -2.73, 95%CI -5.21 to−0.25 respectively). No significant associations were found between the additional exposure to PM2.5 or NOX
and respiratory symptoms except for PM2.5 and dry cough (OR 1.40, 95%CI 1.00 to 1.94).
Conclusion: Exposure to PM2.5 and NOX from industry was associated with decreased lung function. Exposure
to PM2.5 was also associated with parents’ reports of dry cough among their children.
Keywords: Air pollution, Heavy industry, Respiratory symptoms, Lung function, School children
Background
Air pollution is a complex mixture of different gaseous and particulate components and can cause several health effects. Both long- and short-term exposure to air pollu-tion can cause cardiovascular diseases, respiratory dis-eases (e.g. asthma, chronic obstructive pulmonary
disease) and mortality [1]. Children are more susceptible to the effects of air pollution than adults. The lack of a fully developed pulmonary metabolic capacity in chil-dren make them more susceptible to air pollutants com-pared with adults [2]. Moreover, children are in general more exposed because of greater physical activity of chil-dren compared with adults, as well a greater time spent out of doors.
Investigations often focus on emissions from road traffic, smog and urban or regional differences in air pol-lution. The influence of air pollution from heavy * Correspondence:arnold.bergstra@ggdzeeland.nl
1
Department of Public Health, Erasmus MC, University Medical Centre, POBox 2040, 3000CA, Rotterdam, the Netherlands
3The Zeeland Public Health Service, POBox 345, 4460AS, Goes, the
Netherlands
Full list of author information is available at the end of the article
industry on lung function or respiratory symptoms is less often explored [3–6]. The impact of localised air pollution from industry on health is a major concern in some areas. However, it is often a problem to disentan-gle the effects of the exposure of traffic from exposure of industry.
Lung function is unlike respiratory symptoms an ob-jective measure of respiratory health. Some studies have observed a reduction in lung function or a higher preva-lence of respiratory symptoms among children living in the neighbourhood of industry compared to a control area while other studies found no association. In Canada a cross-sectional study among children (aged 6 to 18 years) found a significant reduction of 1% in pre-dicted FEV1 (1-s forced expiratory volume) due to an in-crease of 190 t of industrial air PM2.5(particulate matter
with an aerodynamic diameter < 2.5 μm) emissions within 25 km of residence. This association was only ob-served among boys, but not among girls [7]. A cross-sectional study in Argentina children (aged 6 to 12 years) living near petrochemical industry had a lower lung function (13% FEV1 percent predicted) and significant more asthma (24.8% vs 10.1%), asthma exacerbations (6. 7 vs 2.9 per year) and respiratory symptoms (average 24. 4% vs 14.0%) compared to children in a semirural region [8]. In Italy a cross-sectional study among children (aged 6 to 14 years) living in the vicinity of petrochemical in-dustry showed a lower lung function (10.3% FEV1 and 12.9% MMEF (maximum midexpiratory flow)) and an increase in wheezing symptoms (adjusted prevalence ra-tio of 1.70) compared to children in a reference area [9]. A Spanish cross-sectional study among children (aged 13 to 14 years) living in the neighbourhood of petro-chemical industry versus children with no industry in surrounding areas found no significant associations between exposure and lung function or respiratory symptoms [10].
To the best of our knowledge, studies about the asso-ciation between industry-related air pollution and health among children are rare. Therefore, the aim of this study was to investigate the effect of air pollution from indus-try on lung function and respiratory symptoms in children.
Methods
Study design and population
A cross-sectional study was conducted among school children (aged 7–13 years) in the vicinity (about 2– 35 km) of the large industrial areal (Sloe area) near East Vlissingen in the Southwest of the Netherlands. At the time of the study several heavy industries were active in the area such as a coal power plant, terminals for storing and shipping of coal, a plastic recycling company, a
phosphorus chemical company, an oil refinery and an aluminium smelter.
The parents of the school children received an invita-tion letter with a consent form for conducting a lung function of their child and also a request to complete an online questionnaire on their child’s health by using a login code provided in the letter. The invitation letters were distributed by the school of the child. Two re-minders were sent in case of non-response.
The lung function measurements were conducted at school from 19 November to 9 December 2012. The questionnaires were collected from 15 November 2012 to 1 February 2013.
Exposure assessment
A variety of components were emitted by plants in the industrial area near East Vlissingen in the Southwest of the Netherlands like particulate matter (PM), nitrogen oxide (NOX), sulphur dioxide (SO2), ethylene,
formalhyde, toluene, benzene, and dioxins. It is difficult to de-fine an exposure measure of relevance when the biological mechanisms are largely unknown. Moreover, the air pollution mix varied greatly by locality and time [11]. For this study relevant compounds were selected in two steps.
First, the emission (kg/year) of a compound was di-vided by the European Commission limit values or if not available the maximum permissible risk levels (MPR) in air (μg/m3) from the National Institute for Public Health and the Environment, The Netherlands (RIVM). The compounds with a high fraction (more than 5000) were selected. Next, the annual mean concentrations of these compounds were estimated with a dispersion model. The compounds with the highest scatter were selected.
The emission data was obtained from the Emission Register [12]. The Netherlands National Institute for Pub-lic Health and the Environment (RIVM) co-ordinates the annual compilation of the Emission Register on behalf of the Dutch Ministry of Infrastructure and Environment. Emission factors are derived from measurements and cal-culations of a model or from (the international) literature.
system QGIS (version 2.18.0) was used to geocode (by means of a plugin) the home and school addresses of the children. The x,y coordinates of the home and schools addresses were used for the receptor file in the OPS model. Thus, the dispersion model estimates the expos-ure to specific compounds attributable to industry, in addition to background exposure due to other exposure sources including traffic and agriculture. After the dis-persion calculations the air pollution data were linked to the lung function data and questionnaires by means of a Trusted Third Party to ensure confidentiality of personal information.
Dutch law requires primary schoolchildren to attend classes for 940 h a year. A time weighted average ure was calculated taking in account the time and expos-ure at school (940 h a year) and at home (7820 h a year). Holiday time, travel time to school and time spent on sports were not included in the time weighted average exposure calculation.
After applying the first selection step (mentioned be-fore) the following compounds remained: PM2.5
(par-ticulate matter with an aerodynamic diameter < 2.5 μm), PM10(particulate matter with an aerodynamic diameter
< 10μm), SO2, and NOX. These compounds were highly
correlated (Pearson correlation coefficients ranged from 0.88 to 0.996). Because of the high correlation, associa-tions between the outcomes and these four components cannot be disentangled. NOXwas chosen because it had
the largest scatter of the four compounds. PM10 and
PM2.5 have the lowest correlation with NOX. PM10 en
PM2.5 also have a similar scatter. Therefore, the average
concentration of PM10 and PM2.5 was compared with
the European Commission limit value by dividing the average concentration by the limit value. PM2.5 was
chosen because it has a higher fraction than PM10.
Because of the high correlation between the time weighted average exposure of PM2.5 and NOX (Pearson
correlation of 0.88), the components must be regarded as indicators of the mixture of air pollution rather than particular causative factors of adverse health effects.
In the study area the exposure to air pollution form traffic is relatively low (less than 5000 vehicles per day or the distance between road and house is more than 100 m). Only three (trunk) roads (A58, N62 and N254) have more than 5000 vehicles per day (35,000, 18,000 and 12,000 vehicles per day respectively). To avoid inter-ference of traffic exposure, cases were excluded from the analysis if the distance between these three roads and a child’s home address was less than 100 m.
Lung function
School children aged 7–13 years underwent an examination of the lung function by one of the two experienced opera-tors, each using one of the two portable spirometers
(EasyOne, NDD Medical Technologies, Zürich, Switzerland). Quality control assessment was done electronically (software spirometer) and manually. End-of-Test criteria, quality criteria and quality grading in EasyOne-PC were based upon published standards [14–17]. Lung function measurement that met the quality criterion of at least 2 acceptable tests and a difference between the best two FEV1 and FVC values equal to or less than 200 ml were selected.
The lung function tests were reviewed by a pulmonary function technician who made the final decision on acceptance or rejection. The following variables were ob-tained from the current analysis: forced vital capacity (FVC), 1-s forced expiratory volume (FEV1), peak ex-piratory flow (PEF), the maximum midexex-piratory flow (MMEF) also known as forced expiratory flow between the 25th and 75th percent of FVC (FEF25–75) and the FEV1/FVC ratio, also called Tiffeneau-Pinelli index. To calculate the predicted lung function, the weight and height of the children were measured. Internal predic-tion formulas were developed. The natural logarithms of lung function variables were regressed on the logarithms of age and weight, and an interaction between sex and the logarithm of height [18]. In addition also low lung function, defined as < 85% of the internal predicted value, was calculated.
Lung function measurements were conducted only on days when the school had not been downwind from the industry for at least two days, to avoid acute effects of air pollutants on the days of the examinations.
Questionnaire on health and risk factors
The questionnaire consisted of four parts namely: socio-demographic characteristics, (respiratory) health prob-lems of the child, indoor air pollution and family history for asthma predisposition.
Socio-demographics
Demographic characteristics were gender and age of the school children (categorized in: 7–8, 9–10 and 11– 13 years). The question about education level of the par-ents was categorized in: 1) primary school or less (8 years of education or less), 2) lower general secondary educa-tion (12 years of educaeduca-tion), 3) higher general secondary education (14 years of education) and 4) college or uni-versity (more than 14 years of education). The highest educational level of the parents was used as indicator.
Respiratory symptoms
12 months? 2) In the past 12 months, has your child’s chest sounded wheezy during or after exercise? 3) In the past 12 months, has your child had a dry cough at night, apart from a cough associated with a cold or a chest in-fection? Reported “asthma” was defined from the ques-tion “Has your child ever had asthma?”. We defined a current asthma case as a child who ever had asthma and wheeze in the past 12 months. In addition to respiratory symptoms also questions about allergy to dust mite and animals has been asked (yes/no).
Proportion time exposed
The time a child was exposed was assessed by how many years the family have lived at the current address in the past five years.
Indoor pollution
Passive smoking was assessed by whether a family member smoked in house. After the following sources of indoor air have been asked: use of a wood stove, having domestic pets and molds in the living and/or sleeping room (yes/no). Sufficient ventilation was measured with the question: Can you indicate how long the living room is ventilated during winter? If the room was not con-tinuous ventilated, the ventilation was categorized as insufficient.
Family history for asthma predisposition
The family history of asthma was measured with the question: Has one or more people in the family ever suf-fered from asthma?
Statistical analyses
Multivariate linear and logistic regression analyses were performed to control for potential confounders. There were two models for each lung function parameter and respiratory symptom. Model 1 was the adjusted model for gender and age; Model 2 added education parents, molds, passive smoking, allergy, ventilation, fireplace, pets, proportion time exposed and family history for asthma predisposition. In the statistical models with a lung function parameter as dependent variable, adjust-ment was also done for possible differences between the two operators. When a potential confounder had a p-value greater than 0.3, then this variable was re-moved from the final model. The variables gender, age and operator (if applicable) were included in the model by default.
Because of non-responders to the questionnaire, the analyses with model 2 were conducted with a smaller study population than the analyses with model 1. Sensi-tivity analyses were conducted to evaluate whether the reduction of the study population had any influence on the reported associations.
The statistical analyses were conducted with the statis-tical package IBM SPSS version 21 (SPSS Inc., Chicago, IL, USA). Results are presented with 95% confidence in-tervals (CI). Ap value less than 0.05 was considered to be statistically significant.
Results
In total, 665 of the 787 school children aged 7–13 years underwent an examination of the lung function (re-sponse 84%). Parents filled in 603 questionnaires after two reminders (which results in an overall response of 77%). Children living near a busy road were excluded (11 cases). Of the remaining children 559 had a lung function measurement that satisfied the quality criteria
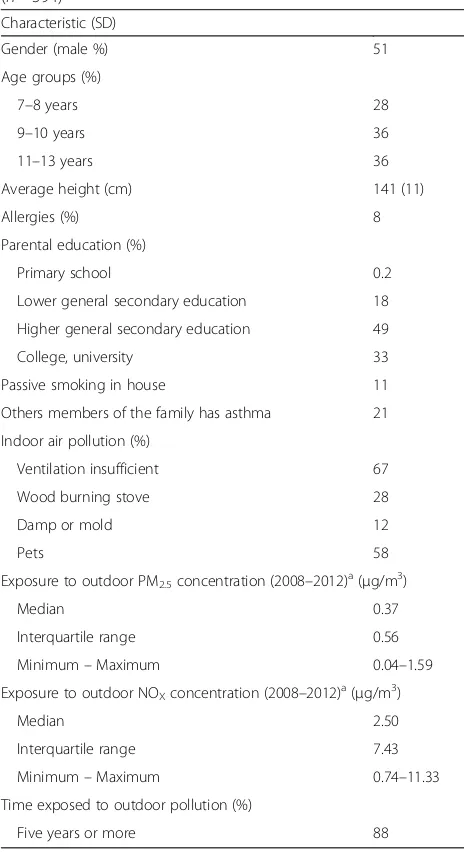
Table 1Characteristics of school children and their environment (n= 594)
Characteristic (SD)
Gender (male %) 51
Age groups (%)
7–8 years 28
9–10 years 36
11–13 years 36
Average height (cm) 141 (11)
Allergies (%) 8
Parental education (%)
Primary school 0.2
Lower general secondary education 18
Higher general secondary education 49
College, university 33
Passive smoking in house 11
Others members of the family has asthma 21
Indoor air pollution (%)
Ventilation insufficient 67
Wood burning stove 28
Damp or mold 12
Pets 58
Exposure to outdoor PM2.5concentration (2008–2012) a
(μg/m3)
Median 0.37
Interquartile range 0.56
Minimum–Maximum 0.04–1.59
Exposure to outdoor NOXconcentration (2008–2012) a
(μg/m3)
Median 2.50
Interquartile range 7.43
Minimum–Maximum 0.74–11.33
Time exposed to outdoor pollution (%)
Five years or more 88
a
(see methods). Among parents 594 persons had a com-pleted questionnaire. Hence, the study population con-sisted of 424 children-parent combinations with complete information on both lung function and respira-tory symptoms.
Table1shows the characteristics of the children, parents and their exposure. The exposure patterns showed that most persons in the study population had a modestly in-creased additional exposure to PM2.5 and NOX from
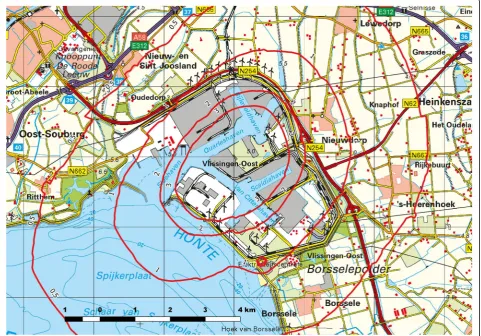
in-dustrial emissions. This is also reflected in the five years (2008–2012) average iso-concentration contours of PM2.5
and NOX without background concentration (see Fig. 1
and Additional file1: Figure S1 respectively).
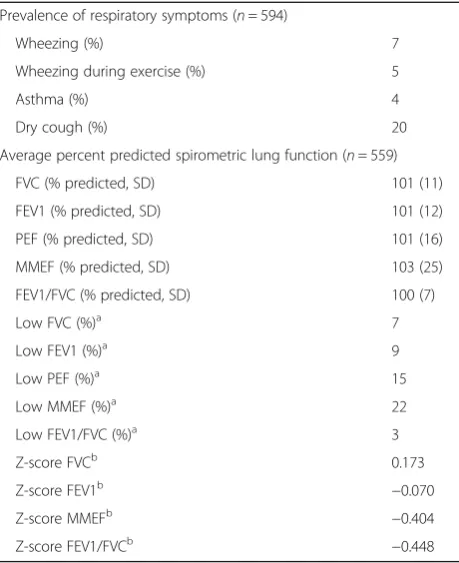
Table2 shows that the lung function parameters were comparable to the expected values from the reference equations. In this table also z-score, using the Global Lung Function (GLI) reference values [22], were added to make comparison possible with other study populations. The PEF and MMEF showed the highest prevalence of low lung function. The most common respiratory symp-tom among children was dry cough followed by wheezing, wheezing during exercise, and asthma.
Tables3and4shows that children exposed to PM2.5and
NOX (per interquartile range of 0.56 and 7.43 μg/m3
respectively) had a significantly lower percent predicted peak expiratory flow (PEF) (B -2.80%, 95%CI -5.05% to−0. 55% and B -3.67%, 95%CI -6.93% to−0.42% respectively). Children exposed to NOX (per interquartile range of 7.
43μg/m3) also had a significantly lower percent forced vital capacity (FVC) and percent predicted 1-s forced expiratory volume (FEV1) (B -2.30, 95%CI -4.55 to−0.05 and−2.73 95%CI -5.21 to−0.25 respectively). Gender and age were not significant associated with the percent predicted FVC, FEV1 and PEF. After adjustment for gender, age and oper-ator, exposure to PM2.5and NOX(per interquartile range of
0.56 and 7.43 μg/m3 respectively) was significantly associated with a low PEF (OR 1.42, 95%CI 1.01 to 1.99 and OR 1.75, 95%CI 1.07 to 2.87 respectively). With further adjustment for confounders no significant association was found.
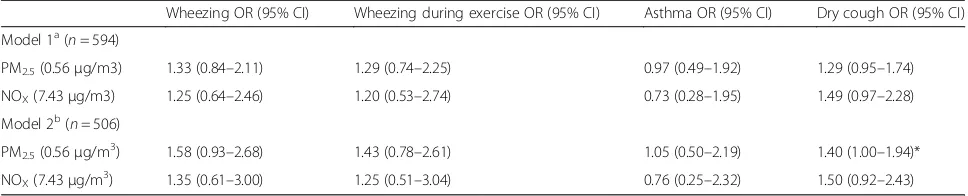
In Table 5 it is shown that odds ratios for the rela-tionship between industry-related exposure (PM2.5
and NOX) and respiratory symptoms among children,
with the exception of asthma, were all elevated. Only
Fig. 1Modelled PM2.5isoconcentration contours (μg/m3), five years average exposure (2008–2012) without background concentration (map reprinted
exposure to PM2.5 was statistically significant elevated
with the respiratory symptom ‘dry cough’ (OR 1.40, 95%CI 1.00 to 1.94).
Discussion
This study showed that higher exposure to PM2.5 and
NOXfrom industrial sources (per interquartile range of
0.56 and 7.43 μg/m3 respectively) was significantly associated with lower percent predicted PEF of 2.80% and 3.67% respectively. Higher NOX exposure (per
interquartile range of 7.43 μg/m3) was also significantly
associated with 2.30% and 2.73% lower percent predicted FVC and FEV1 respectively.
The odds ratios for the relationship between industry-related exposure (PM2.5and NOX) and respiratory
symp-toms among children, with the exception of asthma, were all elevated. Only higher exposure to PM2.5 was
significant associated with a 1.40 higher odds ratio of dry cough.
In 2011 a cross-sectional questionnaire study among children between 2 and 18 years was conducted in the same area which showed that higher PM2.5 and NOX
concentrations, as predicted by an exposure dispersion model, were statistical significant associated with an excess of wheezing and dry cough [23]. In the current study we observed similar associations between PM2.5
and NOX (per μg/m3) exposure and the presence of
respiratory symptoms with a statistically significant association between PM2.5 and dry cough. In the
previous study in 2011 PM2.5 and NOX were
significantly associated with presence of wheezing, wheezing during exercise, and dry cough. Due to the smaller study population in the current study compared to the study in 2011 (594 vs 1099) associations of similar magnitude lacked sufficient power.
Comparable studies about the influence of industry-related air pollution on lung function among children are rare. To the best of our knowledge there are no other studies which describe association of modelled PM2.5or NOXexposure from industry and lung function
level. Other studies have compared populations living in industrial areas with control areas or have relied on emission information instead of modelled exposure pat-terns. Several studies on the effects of air pollution from traffic on lung function have reported lower lung func-tion with higher exposure to air pollufunc-tion [24].
The population’s mean lung function decrement from exposure to PM2.5 and NOX is relative small, but this
was not the case for the percentage of children with a poor lung function. We found that a 3% decrease in Table 2Prevalence of respiratory symptoms in school children
(7–13 years) and the lung function among these children Prevalence of respiratory symptoms (n= 594)
Wheezing (%) 7
Wheezing during exercise (%) 5
Asthma (%) 4
Dry cough (%) 20
Average percent predicted spirometric lung function (n= 559)
FVC (% predicted, SD) 101 (11)
FEV1 (% predicted, SD) 101 (12)
PEF (% predicted, SD) 101 (16)
MMEF (% predicted, SD) 103 (25)
FEV1/FVC (% predicted, SD) 100 (7)
Low FVC (%)a 7
Low FEV1 (%)a 9
Low PEF (%)a 15
Low MMEF (%)a 22
Low FEV1/FVC (%)a 3
Z-score FVCb 0.173
Z-score FEV1b −0.070
Z-score MMEFb −0.404
Z-score FEV1/FVCb −0.448
a
< 85% predictedb
GLI reference
Table 3Associations between long-term exposure (2008–2012) to PM2.5and NOX(per interquartile range) and predicted lung function
among school children (7 to 13 years) in linear regression analysis
FVC (% predicted) FEV1 (% predicted) PEF (% predicted) MMEF (% predicted) FEV1/FVC (% predicted)
B (95% CI) B (95% CI) B (95% CI) B (95% CI) B (95% CI)
Model 1a(n = 559)
PM2.5(0.56μg/m3) −0.14 (−1.53–1.25) −0.34 (−1.85–1.18) −3.04 (−5.05 - -1.02)** −1.10 (−4.21–2.00) −0.24 (−1.10–0.63)
NOX(7.43μg/m3) −1.07 (−3.04–0.90) −1.41 (−3.56–0.74) −4.71 (−7.56 - -1.86)** −2.22 (−6.62–2.19) −0.35 (−1.58–0.89)
Model 2b( n= 424)
PM2.5(0.56μg/m3) −0.76 (−2.32–0.79) −1.15 (−2.86–0.56) −2.80 (−5.05 - -0.55)* −1.29 (−4.68–2.10) −0.29 (−1.26–0.69)
NOX(7.43μg/m3) −2.30 (−4.55 - -0.05)* −2.73 (−5.21 - -0.25)* −3.67 (−6.93 - -0.42)* −2.80 (−7.69–2.09) −0.35 (−1.75–1.06)
a
Adjusted for gender, age and operator
b
Adjusted for gender, age, education parents, molds, passive smoking, allergy, ventilation, fireplace, pets, family history for asthma predisposition, proportion time exposed in the last five years and operator (smaller study population due to non-responders of the questionnaire)
predicted PEF from exposure to PM2.5 (in model 1,
ad-justed for gender, age and operator) corresponds to a 40% higher odds ratio for a low PEF (< 85% predicted). A 5% decrease in predicted PEF (in model 1) from ex-posure to NOXcorresponds to a 75% higher odds ratio
for a low PEF. Thus, small decreases in the mean in the general population of healthy school children are associ-ated with a relevant increase in the number of children with a poor lung function.
This study has certain strengths and limitations. First, a strength of the study is the use of lung function as ob-jective measure of respiratory health. A second strength is that exposure to air pollution was based on a disper-sion model. Good agreement was found for both SOX
and NOX between modelled and measured
concentra-tions for the OPS dispersion model [13]. A dispersion model takes factors, such as stack height, exact distance between stack and the home of the children, weather and climate, into account. A limitation is the use of two components as indicators for the exposure to air pollution. A variety of components were emitted by the industry in the industrial area. The exposure of each component may vary by locality. Moreover, the differ-ent compondiffer-ents can have an additive, synergistic or
antagonistic effect. Because of the high correlation be-tween PM2.5 and NOX, it was not possible to single
out association specific to a particular air pollution component.
A second limitation is that most of the children were exposed for five or more years (88%). Also the propor-tion time exposed in the past five years was not associ-ated with the percent predicted FVC, FEV1 and PEF. In this study the effect of the moment (e.g. current year) of the exposure and duration could therefore not be disentangled.
A third limitation is that the presence of the industry in the neighbourhood can be perceived by residents as a threat to residents’ health. Families with asthmatic chil-dren may avoid living near a chemical plant or move away. Therefore, migration bias may have attenuated the ob-served associations with lung function and/or respiratory symptoms in our study population. On the other hand, concern about industry can increase the reported chil-dren’s respiratory symptoms when parents with a high risk perception are more likely to report the presence of re-spiratory symptoms in their children.
A fourth limitation is that we did not had complete in-formation on all parent-children pairs. Selective response Table 4Associations between long-term exposure (2008–2012) to PM2.5and NOX(per interquartile range) and low lung function
among school children (7 to 13 years) in logistic regression analysis
Low FVCc Low FEV1c Low PEFc Low MMEFc Low FEV1/FVCc
OR (95% CI) OR (95% CI) OR (95% CI) OR (95% CI) OR (95% CI)
Model 1a(n = 559)
PM2.5(0.56μg/m 3
) 1.05 (0.64–1.70) 1.07 (0.69–1.65) 1.42 (1.01–1.99)* 1.00 (0.74–1.36) 0.97 (0.43–2.20)
NOX(7.43μg/m 3
) 0.99 (0.49–1.99) 1.04 (0.56–1.95) 1.75 (1.07–2.87)* 1.13 (0.73–1.73) 1.17 (0.40–3.44)
Model 2b(n = 424)
PM2.5(0.56μg/m 3
) 1.34 (0.80–2.24) 1.26 (0.79–2.01) 1.37 (0.95–1.97) 1.00 (0.71–1.40) 0.88 (0.34–2.25)
NOX(7.43μg/m 3
) 1.43 (0.66–3.12) 1.41 (0.70–2.86) 1.63 (0.94–2.82) 1.10 (0.68–1.79) 0.95 (0.27–3.40) a
Adjusted for gender, age and operator
b
Adjusted for gender, age, operator, education parents, molds, passive smoking, allergy, ventilation, fireplace, pets, family history for asthma predisposition, proportion time exposed in the last five years and operator (smaller study population due to non-responders of the questionnaire)
c
< 85% predicted
*P< 0.05, **p< 0.01, ***p< 0.001
Table 5Associations between long-term exposure (2008–2012) to PM2.5and NOX(per interquartile range) and respiratory symptoms
among school children (7 to 13 years) in logistic regression analysis
Wheezing OR (95% CI) Wheezing during exercise OR (95% CI) Asthma OR (95% CI) Dry cough OR (95% CI)
Model 1a( n= 594)
PM2.5(0.56μg/m3) 1.33 (0.84–2.11) 1.29 (0.74–2.25) 0.97 (0.49–1.92) 1.29 (0.95–1.74)
NOX(7.43μg/m3) 1.25 (0.64–2.46) 1.20 (0.53–2.74) 0.73 (0.28–1.95) 1.49 (0.97–2.28)
Model 2b( n= 506)
PM2.5(0.56μg/m3) 1.58 (0.93–2.68) 1.43 (0.78–2.61) 1.05 (0.50–2.19) 1.40 (1.00–1.94)*
NOX(7.43μg/m3) 1.35 (0.61–3.00) 1.25 (0.51–3.04) 0.76 (0.25–2.32) 1.50 (0.92–2.43)
a
Adjusted for gender and age
b
Adjusted for gender, age, education parents, molds, passive smoking, allergy, ventilation, fireplace, pets, family history for asthma predisposition, proportion time exposed in the five years and asthma predisposition (smaller study population due to non-responders of the questionnaire)
in the questionnaire may cause bias in reported associa-tions. Sensitivity analyses were performed to evaluate possible change of the reported associations by compar-ing the analysis performed on persons with information about lung function with the analysis on cases with complete information on both lung function and respira-tory symptoms. This sensitivity analysis revealed no meaningful influence of the restriction in study popula-tion on the associapopula-tions between air pollupopula-tion and lung function.
A fifth limitation is that the variability of different lung function measures is age dependent and a fixed cut-off of for low lung function (in this study defined as below 85% predicted) can therefore be inappropriate [25–27]. Therefore the internal reference equations were recalculated separately for children below and above the median age. The results showed similar outcomes.
Conclusions
In this cross-sectional study modelled PM2.5 and NOX
exposure from an area with heavy industry was related to a significantly lower lung function in school children. The PM2.5 exposure was also significantly associated
with presence of the respiratory symptom dry cough.
Additional File
Additional file 1:Figure S1.Modelled NOXisoconcentration contours
(μg/m3), five years average exposure (2008–2012) without background concentration. Map reprinted from Kadaster [28] in the Netherlands under a CC-BY-4.0 license, 2017″. (JPEG 1976 kb)
Abbreviations
FEV1:1-s forced expiratory volume; FVC: Forced vital capacity; Low lung function: < 85% predicted.; MMEF: Maximum midexpiratory flow; NOX: Nitrogen oxides; OR: Odds ratio; PEF: Peak expiratory flow;
PM: Particulate matter; PM10: Particulate matter with an aerodynamic
diameter of 10μm or less; PM2.5: Particulate matter with an aerodynamic
diameter of 2.5μm or less; SO2: Sulphur dioxide
Acknowledgements
Not applicable.
Funding
Data collection was supported by a grant of the Province of Zeeland, the Netherlands. For the study we received no funding.
Availability of data and materials
On request data are available. Please contact the corresponding author.
Authors’contributions
Conceived and designed the experiments: ADB AB. Analysed the data: ADB. Involved in the interpretation of the results: ADB and AB. Wrote the paper: ADB AB BB. All authors read and approved the final manuscript.
Ethics approval and consent to participate
Although the conducting of a lung function research among school children in this study is a medical research, the actions and behaviours requested by the subjects are not such that it infringe the integrity of the subject. Therefore, according Dutch law, is for this research no mandatory of Dutch Ethic Board needed. The parents or legal guardian provides a written informed consent for the spirometry measurement of their child(ren).
Regarding the questionnaire, the information to participants explained that by filling out the questionnaire informed consent was given. Under the Dutch law for medical scientific research with human subjects questionnaire surveys are not subject to approval by an institutional ethics committee. However, the Law for Protection of Personal Data requires informed consent and also procedures for the protection of personal privacy. These procedures are laid done in the Code of Conduct for Medical research (at www.federa.org), established by the Council of the Federation of Medical Scientific Societies. In this research project we have strictly adhered to these procedures and the data were analysed anonymously.
Consent for publication
Not applicable.
Competing interests
The authors declare that they have no competing interests.
Publisher’s Note
Springer Nature remains neutral with regard to jurisdictional claims in published maps and institutional affiliations.
Author details
1Department of Public Health, Erasmus MC, University Medical Centre, POBox
2040, 3000CA, Rotterdam, the Netherlands.2Institute for Risk Assessment Sciences, Utrecht University, POBox 80176, 3508TD, Utrecht, the Netherlands.
3The Zeeland Public Health Service, POBox 345, 4460AS, Goes, the
Netherlands.4Julius Center for Health Sciences and Primary Care, University
Medical Center Utrecht, P.O. Box 85500, 3508, GA, Utrecht, The Netherlands.
Received: 15 November 2017 Accepted: 16 March 2018
References
1. Mannucci PM, Harari S, Martinelli I, Franchini M. Effects on health of air pollution: a narrative review. Intern Emerg Med Springer Milan. 2015;10:657–62. 2. Kurt OK, Zhang J, Pinkerton KE. Pulmonary health effects of air pollution.
Pulm Med. 2016;22:138–43.
3. Pascal L, Pascal M, Stempfelet M, Goria S, Declercq C. Ecological study on hospitalizations for cancer, cardiovascular, and respiratory diseases in the industrial area of Etang-de-Berre in the South of France. J Environ Public Health. 2013;2013:1–13.
4. Smargiassi A, Goldberg MS, Wheeler AJ, Plante C, Valois MF, Mallach G, et al. Associations between personal exposure to air pollutants and lung function tests and cardiovascular indices among children with asthma living near an industrial complex and petroleum refineries. Environ Res. 2014;132:38–45. 5. Nirel R, Maimon N, Fireman E, Agami S, Eyal A, Peretz A. Respiratory
hospitalizations of children living near a hazardous industrial site adjusted for prevalent dust: A case-control study. Int J Hyg Environ Health. 2015;218:273–9.
6. Götschi T, Heinrich J, Sunyer J, Künzli N. Long-Term Effects of Ambient Air Pollution on Lung Function A Review. Epidemiology. 2008;19:690–701. 7. Wong SL, Coates AL, To T. Exposure to industrial air pollutant emissions and
lung function in children: Canadian Health Measures Survey, 2007 to 2011. Heal reports. 2016;27:3–9.
8. Wichmann FA, Müller A, Busi LE, Cianni N, Massolo L, Schlink U, et al. Increased asthma and respiratory symptoms in children exposed to petrochemical pollution. J Allergy Clin Immunol. 2009;123:632–8. 9. Rusconi F, Catelan D, Accetta G, Peluso M, Pistelli R, Barbone F, et al. Asthma
Symptoms, Lung Function, and Markers of Oxidative Stress and Inflammation in Children Exposed to Oil Refinery Pollution. J Asthma. 2011;48:84–90. 10. Rovira E, Cuadras A, Aguilar X, Esteban L, Borràs-Santos A, Zock J-P, et al.
Asthma, respiratory symptoms and lung function in children living near a petrochemical site. Environ Res. 2014;133:156–63.
11. Boffetta P, Nyberg F. Contribution of environmental factors to cancer risk. Br Med Bull. 2003;68:71–94.
12. Pollutant Release and Transfer Register [Internet]. 2016 [cited 2016 Sep 28]. Available from:http://www.emissieregistratie.nl.
15. Ferguson GT, Enright PL, Buist S, Higgins MW. Office spirometry for lung health assessment in adults: A consensus statement from the national lung health education program. Chest [Internet]. The American College of Chest Physicians. 2000;117:1146–61. Available from:https://doi.org/10.1378/chest.117.4.1146
16. Miller MR, Hankinson J, Brusasco V, Burgos F, Casaburi R, Coates A, et al. Standardisation of spirometry. Eur Respir J. 2005;26:319–38.
17. Beydon N, Davis SD, Lombardi E, Allen JL, Arets HGM, Aurora P, et al. An Official American Thoracic Society/European Respiratory Society Statement: Pulmonary function testing in preschool children. Am J Respir Crit Care Med. 2007;175:1304–45.
18. Moshammer H, Hoek G, Luttmann-Gibson H, Neuberger MA, Antova T, Gehring U, et al. Parental Smoking and Lung Function in Children An International Study. Am J Respir Crit Care Med. 2006;173:1255–63. 19. Asher MI, Keil U, Anderson HR, Beasley R, Crane J, Martinez F, et al.
International study of asthma and allergies in childhood (ISAAC): Rationale and methods. Eur Respir J. 1995;8:483–91.
20. Beasley R. Worldwide variation in prevalence of symptoms of asthma, allergic rhinoconjunctivitis, and atopic eczema: ISAAC. Lancet. 1998;351: 1225–32.
21. Lai CKW, Beasley R, Crane J, Foliaki S, Shah J, Weiland S. Global variation in the prevalence and severity of asthma symptoms: phase three of the International Study of Asthma and Allergies in Childhood (ISAAC). Thorax. 2009;64:476–83.
22. Quanjer PH, Stanojevic S, Cole TJ, Baur X, Hall GL, Culver BH, et al. Multi-ethnic reference values for spirometry for the 3-95-yr age range: The global lung function 2012 equations. Eur Respir J [Internet] NIH Public Access. 2012;40:1324–43. Available from:http://www.ncbi.nlm.nih.gov/pubmed/ 22743675.
23. Bergstra AD, Brunekreef B, Burdorf A. The mediating role of risk perception in the association between industry-related air pollution and health Abstract Background. In Press:1–27.
24. Schultz ES, Litonjua AA, Melén E. Effects of Long-Term Exposure to Traffic-Related Air Pollution on Lung Function in Children. Curr. Allergy Asthma Rep Curr Allergy Asthma Rep. 2017;41:1–13.
25. Swanney MP, Ruppel G, Enright PL, Pedersen OF, Crapo RO, Miller MR, et al. Using the lower limit of normal for the FEV1/FVC ratio reduces the misclassification of airway obstruction. Thorax [Internet]. 2008;63:1046–51. Available from:http://thorax.bmj.com/.
26. Islam T, Gauderman WJ, Berhane K, McConnell R, Avol E, Peters JM, et al. Relationship between air pollution, lung function and asthma in adolescents. Thorax. 2007;62:957–63.
27. Stanojevic S, Wade A, Cole TJ, Lum S, Custovic A, Silverman M, et al. Spirometry centile charts for young Caucasian children: The asthma UK collaborative initiative. Am J Respir Crit Care Med. 2009;180:547–52. 28. Kadaster, The Nederlands [Internet]. Available from:https://www.pdok.nl/nl/
over-pdok/uw-speciale-aandacht/copyright.
• We accept pre-submission inquiries
• Our selector tool helps you to find the most relevant journal
• We provide round the clock customer support
• Convenient online submission
• Thorough peer review
• Inclusion in PubMed and all major indexing services
• Maximum visibility for your research
Submit your manuscript at www.biomedcentral.com/submit