R E S E A R C H A R T I C L E
Open Access
Implementing the EffTox dose-finding
design in the Matchpoint trial
Kristian Brock
1*, Lucinda Billingham
1, Mhairi Copland
2, Shamyla Siddique
1, Mirjana Sirovica
1and Christina Yap
1Abstract
Background: The Matchpoint trial aims to identify the optimal dose of ponatinib to give with conventional chemotherapy consisting of fludarabine, cytarabine and idarubicin to chronic myeloid leukaemia patients in blastic transformation phase. The dose should be both tolerable and efficacious. This paper describes our experience implementing EffTox in the Matchpoint trial.
Methods: EffTox is a Bayesian adaptive dose-finding trial design that jointly scrutinises binary efficacy and toxicity outcomes. We describe a nomenclature for succinctly describing outcomes in phase I/II dose-finding trials. We use dose-transition pathways, where doses are calculated for each feasible set of outcomes in future cohorts. We introduce the phenomenon ofdose ambivalence, where EffTox can recommend different doses after observing the same outcomes. We also describe our experiences withoutcome ambiguity, where the categorical evaluation of some primary outcomes is temporarily delayed.
Results: We arrived at an EffTox parameterisation that is simulated to perform well over a range of scenarios. In scenarios where dose ambivalence manifested, we were guided by the dose-transition pathways. This technique facilitates planning, and also helped us overcome short-term outcome ambiguity.
Conclusions: EffTox is an efficient and powerful design, but not without its challenges. Joint phase I/II clinical trial designs will likely become increasingly important in coming years as we further investigate non-cytotoxic treatments and streamline the drug approval process. We hope this account of the problems we faced and the solutions we used will help others implement this dose-finding clinical trial design.
Trial registration: Matchpoint was added to the European Clinical Trials Database (2012-005629-65) on 2013-12-30. Keywords: EffTox, Phase I/II, Dose-finding, Efficacy, Toxicity, CML
Background
The introduction of BCR-ABL tyrosine kinase inhibitors (TKIs; imatinib, dasatinib, nilotinib, bosutinib and pona-tinib) has revolutionised the treatment of chronic myeloid leukaemia (CML). The great majority of patients with chronic phase (CP)-CML obtain a durable complete cyto-genetic response and the rate of progression to blast phase (BP) is 1 to 2% per annum in the first few years after diagnosis, falling sharply when major molecular response is obtained [1–3]. A minority of patients (<10%) present
*Correspondence: [email protected]
1Cancer Research UK Clinical Trials Unit, Institute of Cancer & Genomic Sciences, University of Birmingham, Birmingham, B15 2TT UK Full list of author information is available at the end of the article
withde novoBP-CML and of these two-thirds are myeloid and one-third lymphoid BP [4]. Despite the use of TKIs, median survival after the diagnosis of BP-CML is between 6.5 and 11 months [5–8], with the majority of long-term survivors being recipients of allogeneic stem cell trans-plant in second CP [9]. This poor survival is often due to patients developing new mutations, most frequently within the BCR-ABL kinase domain, resulting in resis-tance to TKIs and further rapid disease progression [10]. Therefore, novel therapies to improve and prolong thera-peutic responses in BP-CML are urgently sought.
In the Matchpoint trial, we plan to simultaneously assess co-primary safety and efficacy outcomes for the combination of a novel TKI, ponatinib, with conven-tional fludarabine, cytarabine and idarubicin (FLAG-IDA)
chemotherapy. We believe this to be the first such study in blastic phase CML. It is envisaged that the data will be the first step to improve the treatment of this difficult clinical problem.
The goal of this trial is to find the optimal dose of ponatinib to combine with standard doses of FLAG-IDA, rather than merely the maximum tolerable dose. In the so-called cytostatic setting, dosing decisions should be guided by patients’ outcomes with regard to efficacy and toxicity, yielding designs for joint phase I/II trials. Differ-ent statistical designs define dose optimality in differDiffer-ent ways. The method chosen in Matchpoint is described below.
Published clinical trial designs in this arena include extensions of the continual reassessment method [11] (CRM). Braun’s bivariate CRM [12] models separate toxicity and disease progression events. Zhang et al.’s variant of CRM [13] called TriCRM uses an ordered tri-nary outcome that incorporates response and toxicity. More recently, Wages & Tait [14] introduced a method that uses a latent CRM model to monitor toxicity and selects amongst candidate efficacy models using Bayes factors. Amongst non-CRM alternatives, Wang & Day [15] detailed a utility-maximising approach that assumes responses and toxicity occur in patients according to log-normally distributed patient thresholds.
Thall & Cook [16] introduced EffTox, a Bayesian adap-tive dose-finding design that models correlated binary efficacy and toxicity outcomes. A search of PubMed on 17th October 2016 for articles that have cited Thall & Cook [16] returned 54 items. Of these, 36 were method-ological in nature, detailing extensions or alternative designs. A further 14 were review articles. Only four articles pertained to the design or reporting of a spe-cific clinical trial. Three of these used the EffTox design [17–19]. The first author is based at the MD Anderson Cancer Center for two of these papers [17, 18], and at the University of Washington for the third [19]. The fourth trial article [20] cites the EffTox paper but uses a ran-domised trial design. It is not our intention to give a full systematic review but this scoping search suggests that EffTox is not widely used, and scarcely used at all outside the USA. Thall himself admitted that “[Bayesian models for early phase clinical trials] have seen limited use in clin-ical practice” [21]. In describing our experience using this important dose-finding clinical trial design, we hope to encourage others to use it too. Our proposed solutions to the problems we encountered will expedite the trial design process.
Methods The EffTox design
Thall & Cook [16] introduced the adaptive Bayesian design EffTox to facilitate seamless phase I/II dose-finding.
EffTox software is published by the MD Anderson Cancer Center at https://biostatistics.mdanderson.org/ SoftwareDownload/. We use version 4.0.12.
EffTox uses logit models for the marginal probabilities of efficacy and toxicity at each dose and utility contours (n.b. the EffTox authors use the termdesirability) to mea-sure the attractiveness of each dose based on the posterior probabilities of efficacy and toxicity.
Lety= (y1,. . .,yn)be thendoses under investigation.
Thall & Cook use the codified dosesx=(x1,. . .,xn)such
that
xi=logyi− n
j=1 logyj
n (1)
For example, a trial of 4 doses, 10 mg, 20 mg, 30 mg and 50 mg, would have y = (10, 20, 30, 50), and x = (−0.85,−0.16, 0.25, 0.76).
The marginal probabilities of efficacy and toxicity at dosexare given by
logitπE(x,θ)=μE+βE,1x+βE,2x2 (2)
and
logitπT(x,θ)=μT+βTx (3)
WhenβT > 0, the toxicity probabilities increase
mono-tonically in dose. In contrast, the efficacy curve is not nec-essarily monotonically increasing. The presence of βE,2 allows for non-linearity and a turning point.
The combined probability model is
πa,b=(πE)a(1−πE)1−a(πT)b(1−πT)1−b +(−1)a+b(πE)(1−πE)(πT)(1−πT)
eψ−1 eψ+1
(4)
whereψ is an association parameter and(x,θ)-notation has been suppressed in each function for brevity. Here, a,b are binary patient-specific variables that denote whether efficacy and toxicity events occurred. For a given patient,a=1 means the patient experienced efficacy and b=1 means they experienced toxicity.
The EffTox design requires several pieces of information to be elicited from the investigators. Firstly, the statistician must elicit the prior probability of efficacy and toxicity at each dose. Let us label the vector of efficacy probabilities ηE, and the toxicity analogueηT. The EffTox software will
Secondly, the trialists must select parameters to cal-culate the utility contours [16, 23]. The pointsπ1,∗E, 0,
1,π2,∗T and π3,∗E,π3,∗T are selected such that they are of equal utility. The quantity π1,∗E is the minimum required probability of efficacy when toxicity is impossi-ble. The quantityπ2,∗Tis the maximum permissible prob-ability of toxicity when efficacy is guaranteed. The point
π∗
3,E,π3,∗T
is chosen in the first quadrant (i.e. not lying on thex- ory-axis), representing a point with equal attrac-tiveness to the two other points. EffTox originally used inverse quadratic functions to fit these points but after observing some undesirable behaviour, the authors later advocated usingLp norms [24]. AnLp norm is a mathe-matical tool for generally measuring the distance between two points. The best known is L2, the Euclidean norm, that measures the length of a hypotenusecin a right tri-angle to satisfyc2=a2+b2, whereaandbare the lengths of the other two sides.
Thall et al. [22] stressed the importance of using con-tours that are steep enough to encourage the design to accept slightly higher probabilities of toxicity when they are compensated with materially higher probabil-ities of efficacy. This point was developed in detail in Yuan et al. [25]. When the contours are too flat, patho-logical behaviour can manifest where the design becomes stuck at a sub-optimal dose. This point was unfortunately missed in earlier publications on EffTox [16, 23]. Further-more, the illustrative example in the original EffTox paper [16] inadvertently uses a family of contours that exhibit pathological behaviour. In order to achieve a design with good properties, Thall advocates selecting three equiv-alent points that yield a reasonably steep contour, and not trying to elicit points of equal utility from clinicians (please refer to reviewer comments). Fundamentally, trial-ists should note that EffTox has evolved since its original 2004 publication [16].
The utility of a dose with associated posterior efficacy and toxicity probabilitiesπEandπTis
u(πE,πT)=1−
1−πE
1−π1,∗E
p + πT π∗ 2,T p1 p (5)
In (5),pdetermines the extent of the curvature of the util-ity contours. Forp > 1, the contours are convex and for p = 1, the contours are simply straight lines [24]. The value for p is calculated by the EffTox software so that the neutral utility curve intersects
π1,∗E, 0
,
1,π2,∗T
and
π∗
3,E,π3,∗T
.
EffTox uses decision criteria to determine the set of admissible doses based on posterior beliefs. Given trial data forjpatients,D =(x1,a1,b1),. . .,(xj,aj,bj), dose
xis admissible if
PrπE(x,θ) > πE|D
>pE (6)
and
Pr{πT(x,θ) < πT|D}>pT (7)
In order to resolve (6) and (7), a prior-to-posterior analysis must be carried out to combine the investigators’ priors withD. This involves solving a six-dimensional integral. The details are given in Thall et al. [16].
The investigators provide values forπE,πT,pEandpT
in (6) and (7). The set of doses that are admissible is said to be the admissible set. When a dose selection decision is required (e.g. at the end of a cohort), the admissible set is recalculated. If no dose is admissible, the trial stops and no dose is selected for further research. This may occur if all of the doses are too toxic or insufficiently effica-cious, or both. If the admissible set is non-empty, the dose with maximal utility, subject to rules about not skipping untested doses, is recommended to be given to the next cohort or patient.
This iterative process is repeated until the maximum sample size or some pre-defined stopping criteria is reached. The dose recommended after all patients have been treated and evaluated is the dose selected for further research in a later phase trial.
EffTox in the Matchpoint trial
We chose to use a seamless phase I/II dose-finding design in Matchpoint because we wanted the efficacy events observed to influence the doses selected. We chose to use EffTox because of the readily-available MD Anderson software with which to conduct the trial. Critically, the software performs simulation studies, allowing trialists to hone parameter choices. A summary of our parameter choices appears in Table 1. These are discussed further below.
In Matchpoint, the binary efficacy event is achieved when patients experience at least a minor cytogenetic response (i.e. <65% Philadelphia chromosome-positive cells), or haematological response (platelets>50×109/L, neutrophils > 1.0 × 10⁹/L and blasts < 5% in the
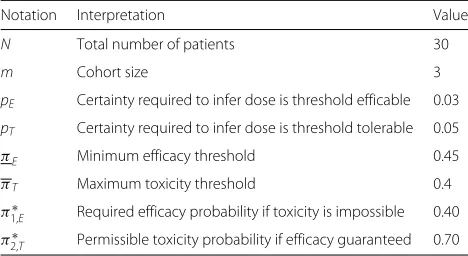
Table 1EffTox parameters chosen in the Matchpoint trial. These are discussed in the main text
Notation Interpretation Value
N Total number of patients 30
m Cohort size 3
pE Certainty required to infer dose is threshold efficable 0.03
pT Certainty required to infer dose is threshold tolerable 0.05
πE Minimum efficacy threshold 0.45
πT Maximum toxicity threshold 0.4
π∗
1,E Required efficacy probability if toxicity is impossible 0.40
π∗
peripheral blood and bone marrow). The binary toxic-ity outcome is defined by the occurrence of a range of pre-specified adverse events, including any grade 3 or 4 clinically significant non-haematological adverse event, related to ponatinib, that cannot be managed with optimal medical care and likely to endanger the life of the patient or result in long term effects. Both co-primary outcomes are assessed over the eight week period following the com-mencement of the first cycle of treatment. The first cycle lasts for 28 to 56 days, depending on how long it takes for blood counts to recover.
Of practical importance when using a seamless phase I/II design is that the co-primary outcomes can be assessed over a similar time horizon. It was felt that responses to treatment could be expected after just one cycle and that avoiding dose-limiting toxicity would be instrumental to that. In a scenario where outcomes are assessed over materially different horizons, the trial would proceed at the speed determined by the outcome with the longest assessment period and there would be an increased risk of incomplete data, when one outcome is assessed and the other is waiting to be assessed. This prob-lem was ameliorated with the introduction of the Late Onset EffTox design [26] but we do not use that design here.
We investigate four doses of ponatinib: 15 mg every second day, 15 mg daily, 30 mg daily and 45 mg daily, ref-erenced as dose-levels 1, 2, 3, 4 respectively, as shown in Table 2. For a tractable analysis, we use y = (7.5, 15, 30, 45), and thusx=(−0.97,−0.27, 0.42, 0.82).
Generally, the clinicians were comfortable providing their prior beliefs on the probability of efficacy and toxic-ity. They believed a-priori that all doses would be tolera-ble. There was some debate about the extent to which the probability of efficacy would improve when moving from the third to the highest dose. On balance, it was felt that efficacy would be low at the lowest doses, increase with dose throughout but begin to level-off at the highest dose. This yielded the priors shown in Table 2.
The clinicians were also comfortable specifyingπEand πT. Conventional chemotherapy regimens like
FLAG-IDA can induce complete cytogenetic responses in 20–40% of patients who have progressed to blastic phase
Table 2Doses under investigation in Matchpoint and the investigators’ prior beliefs on rates of efficacy and toxicity
Dose-level Daily ponatinib dose (mg) Prior Pr(Eff),ηE Prior Pr(Tox),ηT
1 7.5 0.2 0.025
2 15 0.3 0.05
3 (start dose) 30 0.5 0.1
4 45 0.6 0.25
Note, the ponatinib dose labelled 7.5 mg per day is actually 15 mg every other day
[27]. Cortes et al. [28] gave 45 mg of ponatinib daily as a monotherapy to CML patients and observed major cytogenetic response in 23% of 62 patients in blast trans-formation phase. They also observed very good response rates in chronic phase patients. By combining the treat-ments, we hope to observe a response rate in excess of 45% so we used πE = 0.45. It was our prior belief that only the highest two doses would exceed the minimum efficacy threshold. To achieve this level of efficacy, it was felt that a toxicity rate up to 40% would be acceptable thus we set πT=0.40.
The first cohort will receive dose-level 3 (30 mg) because this is the lowest dose believed a-priori to be sufficiently active. Compared to regular phase I trials, it may seem aggressive to start a dose-finding trial at the third of four doses. A typical phase I design would generally start at a low dose and increase incrementally. Notably, there are simultaneous objectives in dose-finding trials to avoid bothunder-andover-dosingpatients. Blastic transforma-tion CML is an acute disease phase so there is a strong motivation to avoid sub-therapeutic doses. The tolera-bility of 45 mg as monotherapy [28] led the clinicians to believe that 30 mg would be tolerable in combination. From here, there is scope to escalate or de-escalate dose as the outcomes dictate.
The values ofpEandpTin (6) and (7) determine the
pos-terior confidence required to admit the doses as worthy of investigation. Typically, low values are chosen so that even relatively weak beliefs will render doses worthy of investigation in this early phase clinical trial. For instance, Thall et al. [22] usepE = pT = 0.1. We initially
investi-gated using the valuespE = pT = 0.05 but later altered
this topE = 0.03. The process of refining these values is
described in a later section [29, 30].
Rather than specify π1,∗E, 0and1,π2,∗T, we agreed three points in the general efficacy-toxicity space (i.e. not on the axes)
π3,∗E,π3,∗T
,
π4,∗E,π4,∗T
and
π5,∗E,π5,∗T
such that the points had approximately equal utility. We used the multi-variate solver multiroot in the R [29] package rootSolve [30] to solve the simul-taneous equations u
π∗
3,E,π3,∗T
= u
π∗
4,E,π4,∗T
=
u
π∗
5,E,π5,∗T
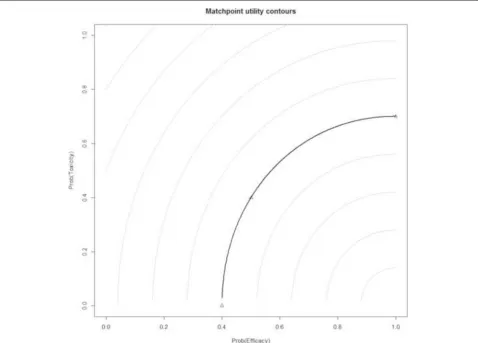
=0. This yielded a neutral utility curve that intersected (39.6%, 0%) and (100%, 67.9%). We rounded to takeπ1,∗E = 0.40 andπ2,∗T = 0.70, yieldingp=2.07. Our family of contours are illustrated in Fig. 1. The contours are quite steep where efficacy probabilities are less than 70%. We consider alternative contours in the discussion.
Fig. 1Utility contours in the Matchpoint trial. The neutral utility contour inboldjoins the points (0.4, 0), (0.5, 0.4) to (1.0, 0.7), represented byblue triangles
beliefs, and vice-versa. Statisticians and investigators should, however, be mindful of the necessity for the data to override the prior in the event that the priors are wrong. This advocates exercising caution when using inflated ESS values. We arrived at ESS=1.3 because it yielded attrac-tive simulated operating characteristics and sensible dose transitions, as described in the following sections.
Nomenclature for describing outcomes in phase I/II trials
To expedite the discussion of phase I/II clinical trial con-duct, we introduce our nomenclature. Each patient may experience one of four specific outcomes: efficacy without toxicity (E); toxicity without efficacy (T); both (B); or nei-ther (N). Let us string these symbols behind a numerical dose-level to denote the outcomes of cohorts of patients. For instance, 2EET denotes a cohort of three patients that were given dose-level 2, two of whom experienced effi-cacy only and one who experienced toxicity. These strings can be concatenated to describe the outcomes of several cohorts consecutively. For example the path 2EET 3EBB extends our previous scenario. After the first cohort, the
trial escalated to dose-level 3. The next cohort of three were treated at this dose and all three patients enced efficacy. Unfortunately, two of them also experi-enced toxicities. Using our notation, this information is unambiguously conveyed in 8 characters.
In phase I/II, it is inadvisable to reduce patients’ out-comes to simple tallies of efficacy and toxicity events because of the complication that patients may experience both events or neither. For instance, the design may rec-ommend a different dose after observing NTE than it would after observing NNB, even though both cohorts contain a single efficacy event and a single toxicity event. In the first example, the events are experienced by differ-ent patidiffer-ents whereas in the latter, they are experienced by the same patient. The distinction is especially pertinent in EffTox because the ψ parameter models the association between efficacy and toxicity.
to define dose transition pathways, and in follow-ing sections to discuss the potential problems of out-come ambiguity and dose ambivalence, and to aid trial planning.
Dose transition pathways
We found it greatly beneficial to prospectively analyse how our dose-finding design would behave with respect to cohorts by supposing each feasible set of future patient outcomes and calculating the model advice in each. From a given starting point, we look to identify the condi-tions under which the design would escalate dose, stay at a dose, de-escalate dose, or recommend that the trial stops.
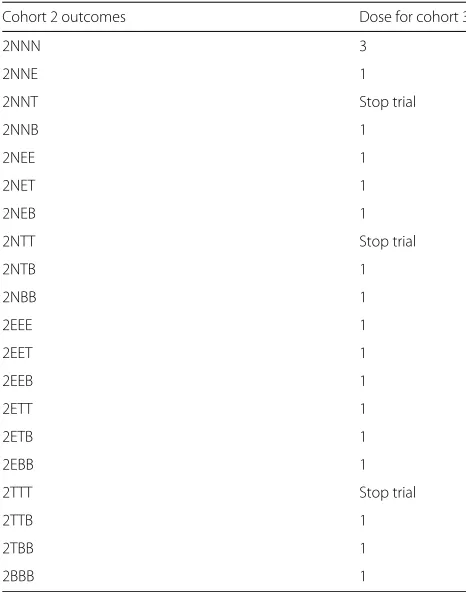
The principle of analysing dose-transition pathways (DTPs) was introduced in a dose-finding trial [31] and has been submitted for publication by Yap, et al. The exam-ple in Table 3 shows the comexam-plete set of DTPs for cohort 2 having observed 3TTT in cohort 1 and de-escalating to dose-level 2.
At dose-selection meetings in the Matchpoint trial, we make frequent use of DTPs. We are particularly inter-ested to learn the outcomes that would have to manifest to change dose or stop the trial.
Table 3After observing 3TTT in cohort 1, cohort 2 is recommended to receive dose-level 2
Cohort 2 outcomes Dose for cohort 3
2NNN 3
2NNE 1
2NNT Stop trial
2NNB 1
2NEE 1
2NET 1
2NEB 1
2NTT Stop trial
2NTB 1
2NBB 1
2EEE 1
2EET 1
2EEB 1
2ETT 1
2ETB 1
2EBB 1
2TTT Stop trial
2TTB 1
2TBB 1
2BBB 1
The dose recommended for cohort 3 depends on the outcomes in cohort 2, as depicted by these dose transition pathways
Dose decisions by EffTox, as projected in advance by DTPs, can sometimes seem counter-intuitive. This may be because the admissibility criteria and utility contours work in unison to: a) filter out doses believed to be too toxic or insufficiently active; and b) identify the most desirable of the admissible doses. This particularly could be the case relatively early in the trial stages when only a small amount of discrete data is available.
Table 3 shows DTPs for a single future cohort but that need not be a constraint. We use DTPs in Matchpoint to analyse every feasible outcome of the next few cohorts. DTPs can be calculated for several subsequent cohorts, or even an entire trial. However, the number of possi-ble paths grows geometrically with the number of cohorts being considered. Each evaluable patient will experience exactly one of E, T, N or B, independent of the other patients. With cohorts of three, the number of distinct outcomes for a single cohort is 20, as shown in Table 3, hence the number of feasible DTPs for the next two and three cohorts are 202and 203respectively. Thus, the lim-itation of what can be depicted on printed pages tends to limit our DTP analysis to no more than the next two cohorts of three patients.
TheDTPstutorial in theclintrialspackage can be used to reproduce Table 3. Refer to theAvailability of data and softwaresection at the end of this article.
Posterior utility
Thall & Cook work with utility as a function of the mean posterior efficacy and toxicity probabilities of the doses. In contrast, we consider the posterior distribution of utility scores. For example, the posterior mean utility of dosexis
ˆ
u(πE,πT)|D)=
u(πE,πT)L(θ|D)f(θ)dθ
L(θ|D)f(θ)dθ (8)
where L is the likelihood function given in EffTox [16], f(θ)is the parameter prior distribution, andπEandπTare
shorthand forπE(x,θ)andπT(x,θ)respectively.
TheUtilitytutorial in theclintrialspackage shows how to calculate posterior plots of utility like those in Figs. 2 and 3. Refer to theAvailability of data and software section at the end of this article.
Results
In this section we describe some problems we encoun-tered and the practical solutions we implemented using the methods described in the previous section. All data in this section are hypothetical or simulated. No actual trial outcomes are presented.
Outcome ambiguity
Fig. 2Posterior utility after 3 patients. Posterior densities of the utility of doses 3 and 4. After three patients with outcomes 3NTE, the densities largely occupy the same space and dose ambivalence is likely
Fig. 3Posterior utility after 15 patients. Posterior densities of the utility of doses 3 and 4. In contrast to Fig. 2, after 15 patients with outcomes 2NNN
FLAG-IDA regimen is toxic and the addition of pona-tinib only increases the potential for adverse events. Peri-odic dose-selection meetings are a feature of dose-finding studies, where early safety and efficacy outcomes are reviewed and a new dose for the next patient or cohort is selected. Sometimes, because of the frail nature of the patients, efficacy assessments are temporarily delayed. This outcome ambiguity presents a challenge for dose-selection because the decision seemingly requires that full patient outcomes be available. However, we have already seen that this is not necessarily the case. In the scenario depicted in Table 3, we know that at least one E or B event in cohort 2 is enough to know with certainty that the trial will proceed to cohort 3 using dose-level 1. If one of the patients experiences E or B in cohort 2, the dose-decision is independent of the other two patients so it does not matter, purely from a dose-decision perspective, if some of the outcome information is temporarily missing for the other patients in cohort 2.
Naturally, this phenomenon does not always occur and there are many occasions when every patient’s outcomes will be required promptly to know the course of action in the subsequent cohort. Furthermore, it is important that outcomes for cohort 2 are finalised before trying to establish doses for cohorts after cohort 3, for example, because all patient outcomes affect the dosing decision in model-based dose-finding designs. The described method merely offers short-term respite in some occasions if a small number of data-points aretemporarilymissing.
The general problem of partially observed outcomes has been addressed more formally by Jin et al. [26] with their Late Onset EffTox (LO-ET) design. This method incorpo-rates time-to-event data and uses the predictive posterior distribution of treated yet non-assessed patients to speed up the trial.
Dose ambivalence
The probability model uses six parameters for which prior distributions are stipulated. After patient outcomes are observed, posterior estimates of efficacy and toxicity come from evaluating a six-dimensional integral, one dimen-sion for each parameter. Such integrals are approximated numerically rather than solved analytically and this leads to estimation error. Typically, early phase clinical trials do not use a large number of patients so the amount of infor-mation in the trial will usually be quite low, i.e. the number of patients divided by the number of parameters being estimated will be lower than a typical phase II or III trial. The combined effect of these two sources of variability is that the outputs of the EffTox model are subject to quite a lot of uncertainty, especially in early cohorts.
This uncertainty is a feature of all sequentially adaptive clinical trial designs that must rely on small to moderate sample sizes. For instance, Thall et al. [32] demonstrate
in their Fig. 2 the uncertainty present in posterior utility estimates of two-agent dose combinations after n = 60 patients.
An occasional unwelcome consequence of this uncer-tainty in EffTox is that the model can occasionally make different dose recommendations based on the same patient outcomes. This is obviously undesirable in a clin-ical trial where a categorclin-ical course of action is sought. In Matchpoint, we referred to this phenomenon as dose ambivalence. We noticed this whilst analysing DTPs.
The posterior utility density curve in Fig. 2 demon-strates the difficulty a utility-maximising design like EffTox faces when few patient outcomes have been observed and two doses have very similar utility scores. It shows the posterior beliefs on the utilities of dose-levels 3 and 4 after observing 3NTE in cohort 1. For clarity in illustration, dose-levels 1 and 2 are not shown. The posterior curves are estimated using Monte Carlo integration, bootstrap sampling and density smoothing via the ggplot function in R [29]. Figure 2 shows that the distribution for dose 4 has slightly greater variabil-ity but that the two utilities have approximately equal mean and mode. When the posterior utilities for the two doses are so similar, it is difficult for the design to reliably choose between them and dose ambivalence is the likely result. After observing outcomes 3NTE in the first cohort, the design sometimes recommends dose-level 3 for the next cohort, and sometimes dose-level 4. This ambigu-ity manifests because the two doses are both admissible, have similar utility scores, and the Bayesian update inte-gral is imperfectly calculated. This happens when using the MD Anderson implementation of the EffTox software that uses the spherical radial method of Monahan and Genz [33] to estimate the posterior integrals, and our own implementation inclintrialsthat uses Monte Carlo integration.
It is possible to calculate the integral more precisely by increasing the number of points in the numerical algo-rithm but this risks missing an important message. If the dose-recommendation is not consistent when calculated to a reasonable numerical precision, the design is telling us that it is difficult to pick between the doses. It could be that several doses have similar utility scores, as we have seen. Alternatively, it could be that a dose is very close to the boundary for inclusion in the admissible set and its eligibility determines the immediately preferable course.
Figure 3 shows similar curves after 15 patients with out-comes 2NNN 3ENN 4EBE 3TEE 4NEE. In contrast, the posterior utilities are now quite distinct and a consistent dose decision is almost guaranteed.
clinicians and statisticians on the Matchpoint steering committee to support decision-making.
TheAmbivalencetutorial in theclintrialspackage presents a Matchpoint scenario with dose ambivalence and demonstrates repeated calculation of the dose-decision. Refer to the Availability of data and software section at the end of this article.
ChangingpEto avoid premature stopping
In this section, we describe an unintended flaw in the original parameterisation of our Matchpoint design that lead to premature stopping. This undesirable behaviour was uncovered by analysing DTPs. We advise trialists to prospectively analyse DTPs of the early trial cohorts yielded by candidate designs before starting the trial.
We commenced Matchpoint with bothpEandpTset to
0.05 so that the design only had to be at least 5% sure that a dose was efficacious and safe to include it in the admissible set. These values are lower than those used conventionally. Thall et al. [22] for example usepE=pT =0.1. However,
we had cause to reducepEfurther to 0.03 in Matchpoint.
Output from the official EffTox software in Table 4 reveals the cause.
Having observed 3TTT in the first cohort, all doses are believed to be unattractive. The most attractive dose is actually dose-level 1, so the design would like to de-escalate. However, the design cannot go straight to dose-level 1 because the restriction to not skip untried doses requires that dose-level 2 is tested first. The software does not allow this feature to be turned off. However, with pE = 0.05, dose-level 2 is actually inadmissible so the
design cannot de-escalate.
The problem is potentially exacerbated by the fact that Pr(πT < πT) is very close to the valuepT =0.05 for
dose-level 3. If this probability is estimated to be slightly less than 0.05, as is plausible with just 3 data-points and a six-dimensional Bayesian integral solved numerically, then dose-level 3 becomes inadmissible also. Under these cir-cumstances, with dose-level 4 inadmissible too on account of excess toxicity, the design cannot recommend a dose so it advocates stopping. This occurs in a material percentage of the dose decision invocations using the EffTox software. Using pE = pt = 0.1 further exacerbates the problem,
stopping categorically after 3TTT and 3NTT.
Observing three toxicities in the first three patients is clearly a grave situation. However, we should be mindful of the play of chance and the extent of our knowledge on the event rates. The lower bound of the 95% confidence interval for a binomial proportion having observed three events in three trials is 29.2% using the exact method, and 43.9% using the Wilson method. Hence, the true toxicity rate could plausibly be much lower than the 100% rate observed with 3TTT. Also, we have no direct knowledge of the toxicity rates at the other dose-levels, only the information extrapolated by our model from the toxicities observed at dose-level 3. We prefer that the design be able to de-escalate after observing 3TTT and the trial continue. We achieved this by reducingpE. We
advise fellow trialists to study DTPs routinely, especially in early cohorts, to spot similar behaviour. When doing so, as we have illustrated here, it is important to con-sider the interaction of the contours and the admissibility criteria [34].
Operating characteristics
Once a complete set of parameters has been proposed, we learn how the design performs on average by simulation.
Blastic transformation phase CML is relatively rare. It was felt that 30 patients was the upper feasible limit to recruit in a reasonable time frame. We selected the highest feasible sample size to maximise our chances of identify-ing the optimal dose. Thirty patients would be sufficient to offer the attractive operating characteristics discussed below. We planned to use cohorts of three because this would offer an attractive balance between the frequency of model updates and opportunity for the design to explore the doses.
The EffTox software provides the ability to simulate the outcome of thousands of trials using the chosen design and some assumed true efficacy and toxicity curves. In practice, of course, the true curves are unknown. We choose a variety of scenarios for simulation that will pro-vide pertinent information on the behaviour of the design in real usage.
Trialists should assess performance in a set of clinically relevant scenarios. One of the scenarios should closely resemble the investigators’ prior beliefs, as this represents the anticipated outcome. We would expect the model to
Table 4EffTox posterior beliefs after 3TTT
Dose 1 Dose 2 Dose 3 Dose 4
Utility -0.489 -0.534 -0.777 -0.817
Pr(πE> πE) 0.079 0.037 0.060 0.200
Pr(πT< πT) 0.919 0.758 0.051 0.005
Admissible underpE=0.05,pT=0.05 1 0 1 0
Admissible underpE=0.03,pT=0.05 1 1 1 0
Table 5Operating characteristics of EffTox designs with 30 patients in cohorts of 3 and ESS=0.5, 1.3 and 1.5
Scenario Dose 1 Dose 2 Dose 3 Dose 4 Stop
Pr(Eff) 0.20 0.30 0.50 0.60
1: Pr(Tox) 0.03 0.05 0.10 0.30
monotonic, Utility -0.33 -0.17 0.16 0.22
dose 4 ESS=0.5 0.01 0.01 0.34 0.63 0.01
optimal ESS=1.3 <0.01 <0.01 0.22 0.76 <0.01
ESS=1.5 <0.01 <0.01 0.22 0.77 <0.01
Pr(Eff) 0.40 0.60 0.75 0.79
2: Pr(Tox) 0.10 0.25 0.55 0.60
monotonic, Utility -0.01 0.25 0.12 0.08
dose 2 ESS=0.5 0.06 0.59 0.32 <0.01 0.03
optimal ESS=1.3 0.03 0.60 0.35 <0.01 0.01
ESS=1.5 0.03 0.57 0.39 <0.01 0.01
Pr(Eff) 0.25 0.40 0.60 0.60
3: Pr(Tox) 0.10 0.20 0.38 0.42
eff. plateau, Utility -0.26 0.04 0.15 0.12
dose 3 ESS=0.5 0.03 0.10 0.70 0.13 0.04
optimal ESS=1.3 0.01 0.10 0.73 0.13 0.02
ESS=1.5 0.01 0.09 0.73 0.15 0.02
Pr(Eff) 0.50 0.60 0.70 0.80
4: Pr(Tox) 0.20 0.20 0.20 0.20
tox. plateau, Utility 0.12 0.28 0.43 0.57
dose 4 ESS=0.5 0.02 0.03 0.61 0.34 <0.01
optimal ESS=1.3 <0.01 0.02 0.47 0.50 <0.01
ESS=1.5 <0.01 0.01 0.47 0.51 <0.01
Pr(Eff) 0.05 0.08 0.20 0.25
Pr(Tox) 0.05 0.08 0.12 0.14
5: Utility -0.58 -0.54 -0.34 -0.26
all doses ESS=0.5 0.06 0.03 0.01 0.37 0.53
inactive ESS=1.3 0.06 0.07 0.02 0.34 0.51
ESS=1.5 0.07 0.08 0.02 0.36 0.48
Pr(Eff) 0.05 0.08 0.12 0.25
6: Pr(Tox) 0.60 0.65 0.70 0.80
all doses Utility -0.78 -0.78 -0.76 -0.67
too toxic ESS=0.5 0.09 0.01 0.01 0.01 0.88
and inactive ESS=1.3 0.06 0.01 0.01 0.01 0.91
ESS=1.5 0.04 0.01 0.01 0.01 0.93
perform very well here. The setting for any clinical trial is that we are unsure of the truth so the range of sce-narios in which our design performs well should reflect our ignorance. We considered how the design would per-form if adverse circumstances prevailed. To these ends, we advocate analysing performance when (i) no doses are tolerable, and (ii) no doses are efficacious. In these sce-narios, the desirable behaviour is to stop. As the clinical scenario dictates, we might also advocate analysing sce-narios where the true efficacy and toxicity curves are not monotonically increasing.
In Table 5 we analyse in six indicative scenarios the performance of our chosen EffTox model in Matchpoint, labelled ESS=1.3. We have also given the performance of two other models with priors onθ recalibrated using the EffTox software to give ESS set to 0.5 and 1.5, being the recommended lower and upper limits on ESS advised by Thall et al. [22]. These convey the feasible range of per-formance, holding all other parameters constant. In every other regard, the three models are exactly the same.
We naturally seek a design that selects the optimal dose most reliably. Our ESS=1.3 design with 30 patients makes the optimal decision with probability at least 50% in each scenario. In scenarios 1, 3 and 6, it makes the optimal choice in the great majority of iterations.
Scenarios 1 and 4 show the benefit of a modestly more informative prior. Through the addition of prior informa-tion approximately equivalent to one patient (i.e. increas-ing the effective sample size of the prior from 0.5 to 1.3 or 1.5), the probability that the design selects the optimal dose is increased by up to 17%. Investigators will natu-rally ponder the existence of the opposite effect, i.e. an increased propensity to do the wrong thing when the pre-vailing scenario disagrees with the prior. Scenario 3 shows that this is not necessarily the case. The designs with more informative priors actually perform slightly better, despite a shape of efficacy curve that disagrees with the prior.
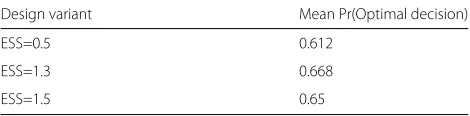
Table 6 shows the mean probability that each design variant identifies the optimal decision, given the six sce-narios in Table 5. We see that our design is the superior of the three presented. The variant with ESS=0.5 has inferior performance, mostly for the reasons discussed. The vari-ant with ESS=1.5 is only modestly inferior but provides no reason to be preferred to our design.
We investigated by simulation the larger sample size n=60. The extra patients greatly improve performance in some scenarios. In scenario 2, the probability of selecting dose 2 increases by 20 to 80%. Similarly, the chances of correctly stopping early in scenario 5 increase by 27 to 78%. In many clinical scenarios, recruiting a higher number of patients is warranted in a phase I-II trial because of the associated improvement in performance and the presence of efficacy assessment that may abrogate
Table 6Mean probabilities of performing the optimal decision in the scenarios presented in Table 5
Design variant Mean Pr(Optimal decision)
ESS=0.5 0.612
ESS=1.3 0.668
ESS=1.5 0.65
a further traditional phase II trial. Phase I-II trials are an opportunity to optimise the delivery of a new agent. In the Matchpoint scenario, unfortunately, higher recruit-ment was simply not feasible because of the rarity of BP-CML.
We also investigated the impact of usingpE =pT =0.1.
The chances of stopping in scenario 5 are improved by 30%. As expected, the reciprocal effect is that the design stops slightly more frequently in scenarios like 3 where an optimal dose exists.
As well as their propensity to make the correct decision, we also discriminate designs on how they allocate doses to patients. A design that always makes the correct decision but treats every patient at an over dose would not desir-able, or indeed ethical. Table 7 gives the mean number of patients allocated to each dose in the scenarios presented in Table 5.
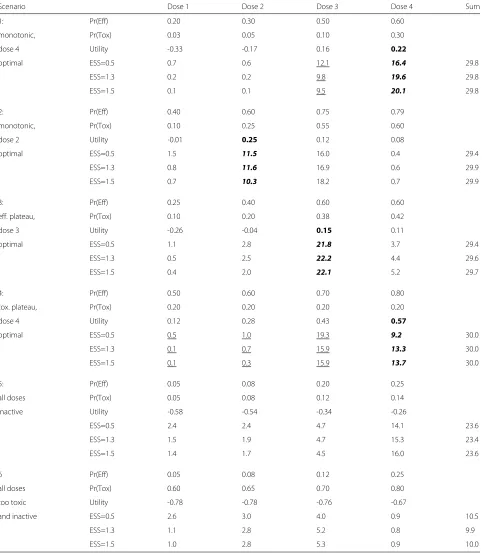
Of the three designs presented, our chosen design uses the fewest patients in scenarios 5 and 6, where the correct decision is to stop the trial. On the four remaining sce-narios, our chosen design allocates the most patients on average to the optimal dose in two scenarios. We see this as further reason to prefer the design with ESS=1.3.
In summary, we have shown by simulation that our selected EffTox parameterisation performs well in six sce-narios. We have demonstrated that it stops reliably in situations where all doses are too toxic or inefficacious. We have also shown it to perform well in a scenario that broadly matches our prior, and in scenarios that depart from our prior. Lastly, we have demonstrated that our cho-sen parameterisation with effective sample size set to 1.3 is superior to alternatives with ESS set to 0.5 and 1.5, in terms of the probability of making the correct decision, and in the allocation of patients to favourable doses.
Discussion
Table 7Numbers of patients allocated to doses in the six scenarios and three EffTox variants presented in Table 5
Scenario Dose 1 Dose 2 Dose 3 Dose 4 Sum
1: Pr(Eff) 0.20 0.30 0.50 0.60
monotonic, Pr(Tox) 0.03 0.05 0.10 0.30
dose 4 Utility -0.33 -0.17 0.16 0.22
optimal ESS=0.5 0.7 0.6 12.1 16.4 29.8
ESS=1.3 0.2 0.2 9.8 19.6 29.8
ESS=1.5 0.1 0.1 9.5 20.1 29.8
2: Pr(Eff) 0.40 0.60 0.75 0.79
monotonic, Pr(Tox) 0.10 0.25 0.55 0.60
dose 2 Utility -0.01 0.25 0.12 0.08
optimal ESS=0.5 1.5 11.5 16.0 0.4 29.4
ESS=1.3 0.8 11.6 16.9 0.6 29.9
ESS=1.5 0.7 10.3 18.2 0.7 29.9
3: Pr(Eff) 0.25 0.40 0.60 0.60
eff. plateau, Pr(Tox) 0.10 0.20 0.38 0.42
dose 3 Utility -0.26 -0.04 0.15 0.11
optimal ESS=0.5 1.1 2.8 21.8 3.7 29.4
ESS=1.3 0.5 2.5 22.2 4.4 29.6
ESS=1.5 0.4 2.0 22.1 5.2 29.7
4: Pr(Eff) 0.50 0.60 0.70 0.80
tox. plateau, Pr(Tox) 0.20 0.20 0.20 0.20
dose 4 Utility 0.12 0.28 0.43 0.57
optimal ESS=0.5 0.5 1.0 19.3 9.2 30.0
ESS=1.3 0.1 0.7 15.9 13.3 30.0
ESS=1.5 0.1 0.3 15.9 13.7 30.0
5: Pr(Eff) 0.05 0.08 0.20 0.25
all doses Pr(Tox) 0.05 0.08 0.12 0.14
inactive Utility -0.58 -0.54 -0.34 -0.26
ESS=0.5 2.4 2.4 4.7 14.1 23.6
ESS=1.3 1.5 1.9 4.7 15.3 23.4
ESS=1.5 1.4 1.7 4.5 16.0 23.6
6 Pr(Eff) 0.05 0.08 0.12 0.25
all doses Pr(Tox) 0.60 0.65 0.70 0.80
too toxic Utility -0.78 -0.78 -0.76 -0.67
and inactive ESS=0.5 2.6 3.0 4.0 0.9 10.5
ESS=1.3 1.1 2.8 5.2 0.8 9.9
ESS=1.5 1.0 2.8 5.3 0.9 10.0
Doseiis the mean number of patients receiving dose-leveli, fori=1,. . ., 4. Row sums are also given in Sum. Sum=30 in some instances due to trials stopping early. Patients allocated to the optimal dose are given in bold and underlined for the admissible doses
for any sign that the design seems reluctant to select a dose. This could suggest unsuitable priors or inappro-priate parameter choices. It should be stressed, however,
parameters that replicate their choices. This approach would preclude the use of a model at all. Rather, in our opinion, the parameters should be selected for generally acceptable behaviour, with due consideration given to the extremes.
Once an acceptable parameterisation has been pro-posed, the performance of the design should be assessed by simulation under a broad range of scenarios. The design should stop sufficiently early and reliably when all doses are too toxic. In scenarios where optimal and/or acceptable doses exist, the design should select those with acceptable probability. Refinements to the param-eterisation here will likely require the trial designer to consider how they affect the behaviour of the design in dose transition, and thus the circularity of the challenge is illustrated.
We have considered even steeper contours, as stressed by Thall et al. [22] and Yuan et al. [25]. They did not lead to superior performance in the particular scenarios we have chosen. This is likely due to the fact that our contours are steep for efficacy probabilities as high as 70%, which we consider to be the clinically plausible scenario in BP-CML. However, the point remains that trade-off contours should be steep to motivate the design to accept higher probabilities of efficacy for acceptably higher probabilities of toxicity.
EffTox is a powerful yet underused statistical design for seamless phase I/II dose-finding clinical trials. Model-based designs are becoming more important as trialists and funders move away from so-called “up-and-down” designs [35] like 3+3. This trend will be further driven as investigators research treatments for which the maximum-tolerateddose is unlikely to coincide with the most effective dose. We have described the obstacles we faced in implementing EffTox in Matchpoint and our approach to overcoming those obstacles in the hope that this will help trialists.
We were able to choose EffTox because our co-primary outcomes efficacy and toxicity were assessed over a sim-ilar time-frame. EffTox and other dose-finding designs with co-primary outcomes would not have been suitable if one had required a longer assessment period.
A key reason for selecting EffTox was the readily avail-able, free software provided by the MD Anderson Cancer Center for performing dose calculations and simulations of trial operating characteristics. With the many time pressures that come with working in an academic clin-ical trials unit, it was a tremendous advantage to have reliable software with which to design and run this trial. One of the drawbacks of using compiled software was our inability to alter or add certain behaviours. For instance, we might have suppressed the no-skipping in de-escalation rule, had that been possible. The desire to routinely calculate dose-transition pathways led us
to develop an open-source implementation of EffTox in clintrials[34].
Conclusion
Joint phase I/II clinical trials will likely become more common in coming years as we investigate non-cytotoxic treatments and streamline the drug approval process. EffTox is an important trial design because it addresses both of these needs. However, it requires parameterisa-tion and preliminary calculaparameterisa-tion. Choices for parameters can potentially have both intended and unintended con-sequences. The process of finalising an EffTox design is inherently iterative. We aim to help trialists implement the design by describing our solutions to the problems we faced.
We have discussed the parameters we chose and how we selected them. We have stressed the need to look at the dose transition pathways, particularly in the early stages when few outcomes are observed, and at the cir-cumstances that would lead to the trial’s termination. We have highlighted the problem of dose ambivalence, illus-trated graphically, and suggested a pragmatic solution. We have described the problem of outcome ambiguity, and how dose-transition pathways can mitigate the prob-lem in the short term, allowing the dose-finding trial to proceed whilst clinical evaluation is ongoing. Finally, we have advised on the simulation scenarios that should be considered. We hope this paper will help other investiga-tors implement this important dose-finding clinical trial design.
Abbreviations
BP: Blast phase; CML: Chronic myeloid leukaemia; CP: Chronic phase; CRM: Continual reassessment method; DLT: Dose-limiting toxicity; MTD: Maximum tolerable dose; SCT: Stem cell transplant; TKI: Tyrosine kinase inhibitor
Acknowledgements
We extend our sincere thanks to the members of the Matchpoint Trial Management Group and Trial Steering Committee for their valuable contribution to this clinical trial. We thank J. N. Khan for her help in designing Matchpoint. We also thank members of the MD Anderson Cancer Center for their kind advice on implementing the EffTox design and using the official EffTox software. Finally, we thank the editor and referees for their comments which have helped to improve the manuscript.
Funding
This trial is funded by Bloodwise (14030) under the Trials Acceleration Programme (TAP). An unrestricted educational grant was provided to support the trial by Ariad Pharmaceuticals. Ponatinib is provided free of charge by Ariad Pharmaceuticals. The support and time of participating patients and their families is gratefully acknowledged. CY and LB were funded by grant C22436/A15958 from Cancer Research UK.
Availability of data and materials
Inclintrials, we provide tutorials on dose-transition pathways, posterior dose utility and dose ambivalence in the form of IPython notebooks. These let you reproduce some of the tables and figures in this manuscript. They are available to download and execute or to simply view online. Go to https://github.com/brockk/clintrials/tree/master/tutorials/matchpoint clintrialsis written in Python and will run on Mac, Linux and Windows. It requires that Python be installed and that the numpy, scipy and pandas packages (amongst others) are installed. The simplest way to achieve this is to install Anaconda, a Python distribution aimed at researchers that bundles each of these packages and many more.
At the time of publication,clintrialsis developed using 64 bit Python 3.5. Efforts are made to maintain compatibility with Python 2.7.
The MD Anderson Cancer Center makes available EffTox software for Windows at https://biostatistics.mdanderson.org/SoftwareDownload/.
We used version 4.0.12 to run simulations and calculate doses during the trial.
Authors’ contributions
KB wrote this manuscript and conducted the contained research. LB and CY developed this manuscript. MC is the Matchpoint chief investigator. MC and CY designed the trial. KB, MC, SS, MS and CY wrote the trial documentation including the protocol, and ran the trial. All authors reviewed this manuscript. All authors read and approved the final manuscript.
Ethics approval and consent to participate
The Matchpoint trial has been approved by the South Central - Berkshire B, and London - City and East Health Research Authorities. The trial continues to be conducted in accordance with the protocol, Good Clinical Practice guidelines, and the Declaration of Helsinki. All patients provide written informed consent.
Consent for publication
All authors have reviewed this manuscript and consent to its publication.
Competing interests
The authors declare that they have no competing interests.
Publisher’s Note
Springer Nature remains neutral with regard to jurisdictional claims in published maps and institutional affiliations.
Author details
1Cancer Research UK Clinical Trials Unit, Institute of Cancer & Genomic
Sciences, University of Birmingham, Birmingham, B15 2TT UK.2Paul O’Gorman
Leukaemia Research Centre, University of Glasgow, Glasgow, UK.
Received: 3 February 2017 Accepted: 30 June 2017
References
1. Druker BJ, Guilhot F, O’Brien SG, Gathmann I, Kantarjian H, Gattermann N, Deininger MWN, Silver RT, Goldman JM, Stone RM, Cervantes F, Hochhaus A, Powell BL, Gabrilove JL, Rousselot P, Reiffers J, Cornelissen JJ, Hughes T, Agis H, Fischer T, Verhoef G, Shepherd J, Saglio G, Gratwohl A, Nielsen JL, Radich JP, Simonsson B, Taylor K, Baccarani M, So C, Letvak L, Larson RA. Five-Year Follow-up of Patients Receiving Imatinib for Chronic Myeloid Leukemia. N Engl J Med. 2006;355(23):2408–17. 2. Jabbour E, Kantarjian HM, Saglio G, Steegmann JL, Shah NP, Boque C,
Chuah C, Pavlovsky C, Mayer J, Cortes J, Baccarani M, Kim DW, Bradley-Garelik MB, Mohamed H, Wildgust M, Hochhaus A. Early response with dasatinib or imatinib in chronic myeloid leukemia : 3-year follow-up from a randomized phase 3 trial ( DASISION ). Blood. 2014;123(4):494–501. doi:10.1182/blood-2013-06-511592.
3. Larson R, Hochhaus A, Hughes T, Clark R, Etienne G, Kim DW, Flinn I, Kurokawa M, Moiraghi B, Yu R, Blakesley R, Gallagher N, Saglio G, Kantarjian H. Nilotinib vs imatinib in patients with newly diagnosed Philadelphia chromosome-positive chronic myeloid leukemia in chronic phase : ENESTnd 3-year follow-up This article has been corrected since Advance Online Publication and a corrigendum is also printed. Leukemia. 2012;26:2197–203. doi:10.1038/leu.2012.134.
4. Hehlmann R. How I treat CML blast crisis How I treat How I treat CML blast crisis. Blood. 2012;120(4):737–48. doi:10.1182/blood-2012-03-380147.
5. Druker BJ, Sawyers CL, Kantarjian H, Resta DJ, Reese SF, Ford JM, Capdeville R, Talpaz M. Activity of a specific inhibitor of the BCR-ABL tyrosine kinase in the blast crisis of Chronic Myeloid Leukemia and Acute Lymphoblastic Leukemia with the Philadelphia chromosome. N Engl J Med. 2001;344(14):1038–42.
6. Giles FJ, Kantarjian HM, le Coutre PD, Baccarani M, Mahon FX, Blakesley RE, Gallagher NJ, Gillis K, Goldberg SL, Larson RA, Hochhaus A, Ottmann OG. Nilotinib is effective in imatinib-resistant or -intolerant patients with chronic myeloid leukemia in blastic phase,. Leukemia. 2012;26(5):959–62. doi:10.1038/leu.2011.355.
7. Palandri F, Castagnetti F, Testoni N, Luatti S, Marzocchi G, Bassi S, Breccia M, Alimena G, Pungolino E, Rege-Cambrin G, Varaldo R, Miglino M, Specchia G, Zuffa E, Ferrara F, Bocchia M, Saglio G, Pane F, Alberti D, Martinelli G, Baccarani M, Rosti G. Chronic myeloid leukemia in blast crisis treated with imatinib 600 mg: Outcome of the patients alive after a 6-year follow-up. Haematologica. 2008;93(12):1792–6.
doi:10.3324/haematol.13068.
8. Saglio G, Hochhaus A, Goh YT, Masszi T, Pasquini R, Maloisel F, Erben P, Cortes J, Paquette R, Bradley-Garelik MB, Zhu C, Dombret H. Dasatinib in imatinib-resistant or imatinib-intolerant chronic myeloid leukemia in blast phase after 2 years of follow-up in a phase 3 study: Efficacy and tolerability of 140 milligrams once daily and 70 milligrams twice daily. Cancer. 2010;116(16):3852–61. doi:10.1002/cncr.25123.
9. Jain N, Van Besien K. Chronic Myelogenous Leukemia: Role of Stem Cell Transplant in the Imatinib Era. Hematol Oncol Clin N Am. 2011;25(5): 1025–48. doi:10.1016/j.hoc.2011.09.003.
10. Soverini S, Colarossi S, Gnani A, Rosti G, Castagnetti F, Poerio A, Iacobucci I, Amabile M, Abruzzese E, Orlandi E, Radaelli F, Ciccone F, Tiribelli M, Di Lorenzo R, Caracciolo C, Izzo B, Pane F, Saglio G, Baccarani M, Martinelli G. Contribution of ABL kinase domain mutations to imatinib resistance in different subsets of Philadelphia-positive patients: By the GIMEMA working party on chronic myeloid leukemia. Clin Cancer Res. 2006;12(24):7374–9. doi:10.1158/1078-0432.CCR-06-1516. 11. O’Quigley J, Pepe M, Fisher L. Continual reassessment method: a
practical design for phase 1 clinical trials in cancer. Biometrics. 1990;46(1): 33–48. doi:10.2307/2531628.
12. Braun TM. The bivariate continual reassessment method: Extending the CRM to phase I trials of two competing outcomes. Control Clin Trials. 2002;23(3):240–56. doi:10.1016/S0197-2456(01)00205-7.
13. Zhang W, Sargent DJ, Mandrekar S. An adaptive dose-finding design incorporating both toxicity and efficacy. Stat Med. 2006;25(14):2365–383. doi:10.1002/sim.2325.
14. Wages NA, Tait C. Seamless Phase I/II Adaptive Design for Oncology Trials of Molecularly Targeted Agents,. J Biopharm Stat. 2015;25(5):903–20. doi:10.1080/10543406.2014.920873.
15. Wang M, Day R. Adaptive Bayesian design for phase I dose-finding trials using a joint model of response and toxicity,. J Biopharm Stat. 2010;20(1): 125–44. doi:10.1080/10543400903280613.
16. Thall P, Cook J. Dose-Finding Based on Efficacy-Toxicity Trade-Offs. Biometrics. 2004;60(3):684–93.
17. Anderlini P, Wu J, Gersten I, Ewell M, Tolar J, Antin JH, Adams R, Arai S, Eames G, Horwitz ME, McCarty J, Nakamura R, Pulsipher MA, Rowley S, Leifer E, Carter SL, DiFronzo NL, Horowitz MM, Confer D, Deeg HJ, Eapen M. Cyclophosphamide conditioning in patients with severe aplastic anaemia given unrelated marrow transplantation: a phase 1–2 dose de-escalation study. Lancet Haematol. 2015;2(9):367–75. doi:10.1016/S2352-3026(15)00147-7.
18. Shah N, Thall PF, Fox PS, Bashir Q, Shah JJ, Parmar S, Lin P, Kebriaei P, Nieto Y, Popat UR, Hosing CM, Cornelison A, Shpall EJ, Orlowski RZ, Champlin RE, Qazilbash MH. Phase I/II trial of lenalidomide and high dose melphalan with autologous stem cell transplantation for relapsed myeloma. Leukemia. 2015;29(9):1945–48. doi:10.1038/leu.2015.54. 19. Chen TL, Estey EH, Othus M, Gardner KM, Markle LJ, Walter RB.
Cyclosporine Modulation of Multidrug Resistance in Combination with Pravastatin, Mitoxantrone, and Etoposide for Adult Patients with Relapsed/Refractory Acute Myeloid Leukemia (AML): A Phase 1/2 Study. Leuk Lymphoma. 2013;54(11):2534–6. doi:10.3109/10428194.2013.777836. 20. Briasoulis E, Aravantinos G, Kouvatseas G, Pappas P, Biziota E, Sainis I,
cancer: a hellenic cooperative oncology group clinical translational study. BMC Cancer. 2013;13(1):263. doi:10.1186/1471-2407-13-263.
21. Thall PF. Bayesian Models and Decision Algorithms for Complex Early Phase Clinical Trials. Stat Sci. 2010;25(2):227–44.
doi:10.1214/09-STS315.Bayesian.
22. Thall P, Herrick R, Nguyen H, Venier J, Norris J. Effective sample size for computing prior hyperparameters in Bayesian phase I-II dose-finding. Clin Trials. 2014;11(6):657–66. doi:10.1177/1740774514547397.
23. Thall P, Cook J, Estey E. Adaptive dose selection using efficacy-toxicity trade-offs: illustrations and practical considerations,. J Biopharm Stat. 2006;16(5):623–38. doi:10.1080/10543400600860394.
24. Cook JD. Efficacy-Toxicity trade-offs based on L-p norms: Technical Report UTMDABTR-003-06. Technical report. 2006.
25. Yuan Y, Nguyen HQ, Thall PF. Bayesian Designs for Phase I–II Clinical Trials, 1st edn. Boca Raton: CRC Press; 2016.
26. Jin IH, Liu S, Thall PF, Yuan Y. Using Data Augmentation to Facilitate Conduct of Phase I-II Clinical Trials with Delayed Outcomes. J Am Stat Assoc. 2014;109(506):525–36. doi:10.1080/01621459.2014.881740. 27. Wadhwa J, Szydlo RM, Apperley JF, Chase A, Bua M, Marin D, Kanfer E,
Goldman JM, Olavarria E. Factors affecting duration of survival after onset of blastic transformation of chronic myeloid leukemia Factors affecting duration of survival after onset of blastic transformation of chronic myeloid leukemia. 2012;99(7):2304–9. doi:10.1182/blood.V99.7.2304. 28. Cortes JE, Kim DW, Pinilla-Ibarz J, le Coutre P, Paquette R, Chuah C,
Nicolini FE, Apperley JF, Khoury HJ, Talpaz M, DiPersio J, DeAngelo DJ, Abruzzese E, Rea D, Baccarani M, Müller MC, Gambacorti-Passerini C, Wong S, Lustgarten S, Rivera VM, Clackson T, Turner CD, Haluska FG, Guilhot F, Deininger MW, Hochhaus A, Hughes T, Goldman JM, Shah NP, Kantarjian H. A phase 2 trial of ponatinib in Philadelphia
chromosome-positive leukemias. N Engl J Med. 2013;369(19):1783–96. doi:10.1056/NEJMoa1306494.
29. R Core Team: R: A Language and Environment for Statistical Computing. Vienna: R Foundation for Statistical Computing; 2014. http://www.R-project.org/.
30. Soetaert K, Herman PMJ. A Practical Guide to Ecological Modelling. Using R as a Simulation Platform. Berlin: Springer; 2009, p. 372.
31. Yap C, Billingham L, Craddock C, O’Quigley J. Dose transition pathways: a design, analysis and operational tool for dose-finding trials using model-based designs. Trials. 2015;16(S2):13.
doi:10.1186/1745-6215-16-S2-O13.
32. Thall PF, Nguyen HQ, Zinner RG. Parametric dose standardization for optimizing two-agent combinations in a phase I-II trial with ordinal outcomes. J R Stat Soc Series C: Appl Stat. 2017;66(1):201–24. doi:10.1111/rssc.12162.
33. Monahan J, Genz A. Spherical-Radial Integration Rules for Bayesian Computation. J Am Stat Assoc. 1997;92(438):664–74.
34. Brock K. clintrials v0.1.4. GitHub, Zenodo. 2016.
doi:10.5281/zenodo.164621, https://zenodo.org/record/164621, https:// github.com/brockk/clintrials.
35. Le Tourneau C, Lee JJ, Siu LL. Dose escalation methods in phase i cancer clinical trials. J Natl Cancer Inst. 2009;101(10):708–20.
doi:10.1093/jnci/djp079.
• We accept pre-submission inquiries
• Our selector tool helps you to find the most relevant journal
• We provide round the clock customer support
• Convenient online submission
• Thorough peer review
• Inclusion in PubMed and all major indexing services
• Maximum visibility for your research
Submit your manuscript at www.biomedcentral.com/submit