S T U D Y P R O T O C O L
Open Access
More-2-Eat: evaluation protocol of a
multi-site implementation of the Integrated
Nutrition Pathway for Acute Care
Heather Keller
1,2*, Celia Laur
2, Renata Valaitis
2, Jack Bell
3, Tara McNicholl
2, Sumantra Ray
4, Joseph Murphy
5,
Stephanie Barnes
6for the More-2-Eat team
Abstract
Background:Nutrition care in hospitals is often haphazard, and malnourished patients are not always readily identified and do not receive the care they require. The Integrated Nutrition Pathway for Acute Care (INPAC) is an algorithm designed to improve the prevention, detection and treatment of malnutrition in medical and surgical patients. More-2-Eat is an evaluation of the implementation of INPAC care activities (e.g. screening) in five diverse medical units from different hospitals in Canada. The primary purpose is to understand how tailored implementation affects INPAC uptake and factors that impact this implementation. The principal outcome is a toolkit that can provide guidance to others.
Methods:This participatory action research uses a before-after time series design to address several research questions focused on implementation and uptake of INPAC (e.g., Does the implementation of INPAC improve the detection of malnutrition? Do nutrition care related knowledge, attitudes and practices scores of unit staff change with the implementation of INPAC?). A six-month developmental phase where baseline data were collected is followed by a twelve-month implementation phase and a three-month sustainability phase. Qualitative and quantitative data are collected concurrently, and to address key research questions, these data are merged. Quantitative data are collected on-site by trained local dietitians and include chart audits of nutrition care practices and a more detailed assessment of recruited patients on quality of life, disability, frailty, food intake and barriers to food intake. Thirty-day post discharge follow up for these patients occurs by researchers via a telephone interview at three time points within baseline and implementation phases, to ascertain the same and other outcomes (e.g. readmission to hospital). Qualitative data include focus groups and key informant interviews completed by researchers, monthly teleconferences among the sites and site-completed forms that track
implementation activities. Resource utilization of dietitian time for various care activities (e.g. assessment) and staff time to assist patients at mealtimes is also collected.
Discussion:More-2-Eat provides an example of how implementation can be tailored when a care algorithm is
embedded into routine practice. The project also highlights important learning points with respect to data collection and techniques to support implementation.
Trial registration:Retrospectively registered ClinTrials.gov Identifier: NCT02800304 June 7, 2016.
Keywords:Malnutrition, Hospitals, Nutrition assessment, Health plan implementation
* Correspondence:[email protected] 1
Schlegel-University of Waterloo Research Institute for Aging, University of Waterloo, 250 Laurelwood Drive, Waterloo, ON N2J 0E2, Canada 2
Faculty of Applied Health Sciences, University of Waterloo, 200 University Ave, Waterloo, ON N2L 3G1, Canada
Full list of author information is available at the end of the article
Background
Internationally collated evidence demonstrates that up to half of patients admitted to hospital suffer from or are at risk of malnutrition (under-nutrition) [1–5]. Three-quarters of these malnourished patients are not being detected and thus are nutritionally undertreated [6]. This issue is especially of concern for medical patients who are more likely to be malnourished than surgical patients [3, 6] and for those over the age of 65 who are more likely to be malnourished than younger patient popu-lations (46% vs. 35% for < 65 years; [7]). Poor food in-take is also common and results from multiple factors including poor food quality, food/eating preferences, feeling unwell and other disease side effects, as well as barriers to food intake, such as not being able to access the tray or requiring eating assistance [8, 9]. Both poor hospital food intake and malnutrition lead to negative health outcomes including a longer length of stay, readmission, and comorbidities and mortality [3, 7, 10–14].
Despite the considerable evidence describing malnutri-tion and poor food intake in hospitalized patients, these issues continue to be undetected and undertreated due to a lack of recognition, prioritization and integration of key care activities (e.g. screening) within the interdiscip-linary team [15, 16]. Identifying notable gaps in the care system will drive the identification of potential solutions to improve these outcomes. For example, dietitian con-sults are typically haphazard [6, 17] and standardized nutrition screening programs could ensure that mal-nourished patients are identified and treated. Patients report many barriers to food intake [18] and effective low-technology solutions could be a feasible way to ad-dress these issues. Physician and nurse attitudes, know-ledge and nutrition care activities demonstrate that education and training are needed to promote and sustain best practice [14, 19–27]. It is anticipated that improving care processes in hospital would also prevent iatrogenic malnutrition.
Best practice recommends engaging the team to be-come ‘food aware’ and to treat nutrition as a central therapy; malnutrition has serious consequences, and for many patients food is the medicine they require [14, 25, 28, 29]. Screening to detect malnutrition and monitoring of food intake are important strategies to ensure that patients receive the required nutrition care [14, 23–26, 30, 31]. Focusing mealtimes on food intake and ensuring that staff is available to assist with mealtime activities are also important [28, 30, 32–36]. Continuing nutrition care for malnourished patients post discharge has also been recommended [14, 27, 36]. In response to these best practice recommendations and to improve nutrition care practice, a treatment algorithm for hospital use in medical and surgical patients was created.
The Integrated Nutrition Pathway for Acute Care (INPAC) was designed to be a feasible, evidence and consensus-based algorithm to improve nutrition care [37] (Fig. 1). Key decision points promote quality nutrition care for every patient, at the appropriate time, by the right health provider. Care activities include: 1) screening at ad-mission with the valid and reliable Canadian Nutrition Screening Tool (CNST) [38]; 2) using subjective global as-sessment (SGA) to definitively diagnose malnutrition after screening and assist with triaging patients for individual-ized assessment and care [39, 40]; 3) monitoring of food intake for all patients, with frequency depending on nutri-tional status; 4) implementation of preventative practices to support food intake and address common mealtime barriers; and 6) inclusion of nutrition concerns and hos-pital treatment on discharge communications to support patient transitions to community care. Tools to assess food intake and identify mealtime barriers, and a ques-tionnaire to identify the knowledge, attitudes and practices (KAP) of hospital staff have also been developed [41–43]. Now that these knowledge products are available, a know-ledge translation program that provides the necessary educational, training and supporting materials, as well as strategies to implement the INPAC is needed.
Other research has attempted to improve nutrition care in hospitals, yet this research to date is scant. Prior implementation research in this area of care has been limited to key segments of a pathway (i.e., screening only) [44, 45] or a specific patient population [46].How implementation occurs for a comprehensive pathway such as the INPAC is not known, nor is it known what resources are needed for such implementation. Gaps also exist regarding patient reported outcomes and how the unit context and climate potentially influences imple-mentation. This knowledge is needed before dissemin-ation of any innovdissemin-ation to improve nutrition care in hospital, including the INPAC is undertaken [47–50]. An observational study that monitors how sites imple-ment INPAC, the educational techniques and strategies that are most successful, resource utilization and im-pacts on staff roles and patient reported outcomes would provide a substantial contribution to this field where implementation research is just beginning. Further un-derstanding and documenting, in sequence, the key steps that are required for implementation and sustainability of this complex intervention will be of benefit to the im-plementation science community as a whole.
randomized control trial, focused on high protein supplementation in frail elderly patients during and post hospitalization. M2E is a participatory action re-search study [51] with the primary objective of evalu-ation [52] of the implementevalu-ation of INPAC in five diverse Canadian hospitals. The principal outcome of this work will be the development of a toolkit that provides strategies, tips, resources and tools for others to use when implementing INPAC. Healthcare is considered a complex adaptive system and thus par-ticipatory action research is appropriate for evaluating an implementation program that relies on change within this system [51, 53–55]. Process and outcome evaluation will also address the following research questions:
1. Does the implementation of the INPAC increase the detection and subsequent treatment of malnutrition in hospital patients? What strategies are
implemented to prevent iatrogenic malnutrition?
2. Does the implementation of the INPAC improve patient reported outcomes (e.g., food intake and reduce mealtime barriers to intake)?
3. Does the implementation of the INPAC improve knowledge, attitudes and perceived practices of hospital staff?
4. How does the implementation of the INPAC vary with context of hospital/unit environments? 5. What are the barriers and facilitators to successful
implementation and what are the necessary ingredients for sustainability?
6. What is the resource utilization (e.g. time of staff ) for the implementation of the INPAC?
Methods
with a triangulation design using the convergent model [56] is used to explicitly merge qualitative and quantita-tive data that will describe how implementation varies by context of hospital site.
Overview of the More-2-Eat project
Selecting the Sites: Five diverse hospitals were carefully selected through a request for proposals process (Royal Alexandra Hospital; Niagara Health, Greater Niagara General Site; The Ottawa Hospital; Concordia Hospital, and Pasqua Hospital Regina Qu’Appelle Health Region). A single medical unit within each chosen hospital is the site for all data collection for M2E. Sites were chosen to be diverse geographically, as well as varied in the type of medical patient (e.g. stroke, geriatric, general medicine) and current status with respect to nutrition risk screen-ing (i.e. 3 of 5 sites were doscreen-ing some level of screenscreen-ing on patients with varied processes). At the time of re-cruitment, no sites were using SGA to diagnose and triage patients. This diversity was required to understand the reality of implementing INPAC activities where processes and resources are different [51, 57]. Sites
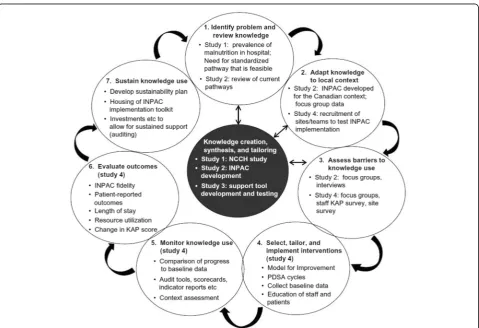
demonstrated commitment from the organization and core members of the unit team (e.g. director of care, lead nurse, physician, clinical nutrition manager, chief execu-tive office of the hospital) as part of the site proposal process [48, 50, 58–61]. Three of the five sites had par-ticipated in the Nutrition Care in Canadian Hospitals (NCCH) study, which was a prevalence investigation fo-cused on describing the issues of malnutrition, outcomes and care practices in hospitals [3, 7, 17]. This initial NCCH study led to a program of research, which resulted in the development of INPAC and now, M2E. Mapping of this program of research onto the Knowledge-to-Action Framework [62] is provided in Fig. 2. An interdisciplinary and intersectoral national and international team of experts, researchers, medical professional educators, stakeholders and knowledge users was assembled to inform M2E. Key decision makers and change agents (e.g. Canadian Malnutrition Task Force, Dietitians of Canada) are part of this group.
Resources and Tools for Integrating INPAC: The five selected hospital sites were provided with funds to sup-port M2E data collection and implementation activities.
The goal was to integrate and embed the care activities of INPAC (described above) into the routine of the unit. The ingredients for implementation were not dictated by the research team, but strategies evolved and included tailoring of materials developed centrally (e.g. educa-tional slide decks), as well as invention of new know-ledge translation products and activities [e.g. creation of communication tools at the bedside to promote consid-eration of patient needs for eating, such as reminders to check for eyeglasses, dentures etc.]. Resources, tools, strategies and behaviour change techniques are captured in the data collection, as this divergence in implementa-tion strategies is important for broader implementaimplementa-tion of INPAC [48, 49, 58, 60]. Sites are led by a research champion (typically a clinical nutrition manager) and one or two research associates (RAs) (clinical dietitians and one nurse) who are seconded from their clinical role for implementation and data collection activities. All sites have developed a site implementation team (SIT) (including key management, clinical and departmental leads, unit staff representatives) that supports, and in some cases, leads the direction of the project and provides administrative navigation [48, 50, 58–60, 63]. A research/ facilitation team lead by the Principal Investigator (PI), supports champions, RAs and the SIT through monthly coaching/mentoring teleconferences, summarization of local data for feedback, and guidance with change efforts. This team consists of graduate students, post-graduate trainees and a clinical expert, as well as the PI. The RAs attended face-to-face training at the beginning of the project to ensure consistency in all study procedures and measures.
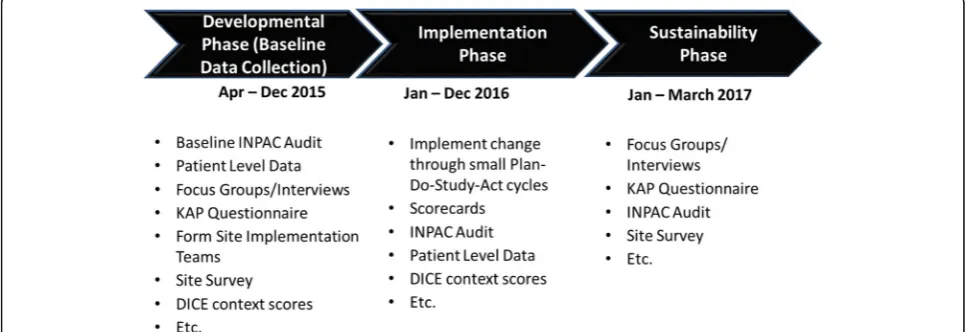
Phases of the More-2-Eat project
There are three distinct phases of M2E (see Fig. 3). Developmental Phase (April-Dec 2015): This phase fo-cused on finalizing data collection measures; assembling
and developing materials to support behaviour change in the units; obtaining ethics board clearance (University of Waterloo ORE#20590 and all hospital sites); signing contracts for transfer of funds to the sites; face-to-face training of RAs for data collection; face-to-face training of site dietitians to conduct SGA; and collecting baseline data (described below). The research/facilitation team guided site champions and RAs extensively throughout this phase for all site-focused activities, conducted train-ing, and developed communication avenues for the sites (e.g. Google group, monthly teleconferences, project webinars for SITs). Champions, RAs, and in some sites, SIT members reviewed and provided input into all data collection instruments to ensure that forms were clear and questions were relevant and written clearly to pro-mote consistency across sites for data collection. An M2E manual provided detail on data collection proce-dures and key implementation activities. The manual was reviewed several times iteratively by champions and RAs with continual updating and refining through this phase. Further training on implementation was provided at the end of this phase with a face-to-face meeting of champions, RAs and project team members. Theoretical frameworks for behaviour change and implementation techniques (e.g. Plan-Do-Study-Act (PDSA) cycles; [64]) were the focus of this training. Engagement of unit staff and management to support sustainability [50, 58, 59, 65] started during this phase and continues throughout the project.
Implementation Phase (Jan-Dec 2016): This phase is focused on testing and evaluating the tailored implemen-tation of INPAC in individual sites. Care activities of INPAC are defined (e.g. screening and referral for at risk patients) and sites are flexible in their approach to implement these components as research indicates that such tailoring is necessary for uptake and sus-tainability [47, 49, 58, 66]. Best practices with respect
to implementation and evaluation are used [51, 58, 59]. Specifically, sites were provided with their baseline data so that buy-in and strategies for making change could be planned by each SIT. This team, led by champions, meets biweekly to monthly to progress the implementation of INPAC and report key activities to the research/facilitation team. These meetings are roughly structured on the Model for Improvement questions (What are we trying to achieve? How will we know a change is an improvement? What changes can be made that will result in an improve-ment?) [64]. Sites identify areas for improvement based on their current practice, creating their own action plan using small tests with PDSA cycles to achieve the care activities of INPAC. Prior work has demonstrated the relevance of this approach to changing nutrition care practices in hospitals [44–49, 53].
Monthly coaching/mentoring teleconferences occur with all sites conducted by the research/facilitation team. Data on progress towards implementation of INPAC is collected each month and provided back to champions for sharing with their implementation teams, administra-tors and site staff. Sites also share resources and tools that have been developed locally (e.g. posters, forms) and these are assembled as potential examples of the Implementation Toolkit.
Sustainability Phase (Jan- June 2017):This phase is fo-cused on continued implementation of INPAC activities to determine how they endure over time in the five sites. It is limited to three months due to the end-date of funding received for M2E. Data collection will occur during this time frame. The virtual INPAC Implementa-tion Toolkit will also be developed in this phase. Consultation with stakeholders will occur to consider how to spread INPAC care activities within and beyond sites. Future funding to disseminate and support imple-mentation of INPAC and to re-evaluate sustainability of INPAC activities at M2E sites will be sought.
Theoretical foundation and frameworks used to guide M2E
The M2E project is guided by several theories and frameworks. The Knowledge-to-Action Process (KTA) theory [66] is being used to understand and explain how M2E fits within the broader program of research [62]. Specifically, that this work was initiated with a preva-lence study defining the problem [3, 6, 7], which resulted in the development of a knowledge translation product (i.e. INPAC) to overcome the problem [37]. M2E is es-sentially the action process of the KTA theory and spe-cifically includes the following steps: adapting knowledge to the local context; assessing barriers to knowledge use; selecting, tailoring and implementing interventions; moni-toring knowledge use; evaluating outcomes; and sustaining knowledge use. New knowledge creation, synthesis and
tailoring will result with the development of the INPAC Implementation Toolkit.
The Quality Implementation Framework [58] also sup-ports this project as it summarizes the critical steps for successful implementation. The steps within this frame-work, relevant to M2E, include the initial consideration of the host setting including the specific context, the structure for implementation, the considerations for on-going structure once implementation has started, and finding ways to improve future application [58].
The COM-B (‘capability’,‘opportunity’,‘motivation’and
‘behaviour’) theory is being used as the basis for behav-iour change of staff towards the INPAC care activities [67]. COM-B explains what needs to be influenced to implement the various INPAC care activities, and specif-ically the inter-relationship between how capability, opportunity, and motivation can change behaviour. For example, staff can be motivated by comparing their prac-tice for screening to other sites; setting goals and track-ing progress through audit and feedback continue to motivate staff as they routinize screening for all admitted patients. Staff need to understand how to perform the screening and referral process, which ensures they have the capability to undertake this care activity. Various education forms are typically used (e.g. in-services, re-minders). Opportunity speaks to finding those points in the system for change that could dramatically enhance uptake of the new behaviour. In the example of screen-ing, embedding the nutrition screening questions into an electronic medical record as a required field would en-sure that screening occurs for all patients.
integrating INPAC into care activities in all hospitals in Canada.
Normalization Process theory [70] is primarily being used by the researchers to frame the implementation process, results and findings as well as increasing likeli-hood of sustainable change. This theory will be helpful in mapping contextual differences between the sites that will be used to explain variation in uptake as we con-tinue the evaluation. It will also be used to define the key elements of the INPAC Implementation Toolkit, which in essence will be an innovation. Mentoring and coaching on implementation with sites is based on the principles of the Model for Improvement [64, 71], which has been shown to be effective for making health care change [44, 47, 59]. This model offers a practical process for SITs to institute and test a change process using PDSA cycles.
Data collection
Data collection in the developmental phase
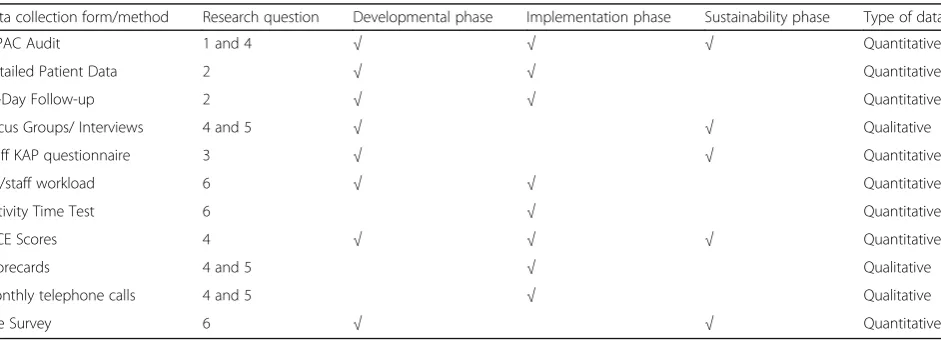
Goals for data collection in this phase were to begin to understand: the context of the site (including staff KAP); the site’s perceived facilitators and barriers to making nutrition care improvements; prevalence of current nu-trition care practices; and prevalence of key patient re-ported outcomes. Multimethods were used to collect these baseline data concurrently [54]. Table 1 provides an overview of data collection measures for M2E.
Context Assessment:It is important to assess context to understand how multi-level factors influence uptake of an innovation [51, 58, 59, 72]. Context was assessed with several measures/activities. A site survey completed by champions and key site implementation team members provided information on the site, staffing and food produc-tion and delivery systems, including staff roles and resource costs (e.g. cost of oral nutritional supplements, salaries). As required, they consulted with various departments and management within their site to complete this survey.
Knowledge-Attitudes-Practices (KAP) Survey:To further understand context, a KAP survey was completed by 30 staff from each study unit (n= 150). RAs recruited staff members with direct patient care responsibility to complete this on-line survey; recruitment occurred via email. Announcements at unit huddles and posting vari-ous notices and memos were also used to recruit partici-pants. Unit staff were provided with the information letter about the study and this survey. The KAP survey was cre-ated for M2E and focused on nutrition care practices con-sistent with INPAC. The survey was developed and tested for reliability in a separate site not included in M2E [43]. The questions are focused on staff knowledge on the prevalence and causes of hospital malnutrition, barriers to food intake, as well as attitudes on the importance of nutrition to recovery and their current practices in nu-trition care. Completion of the on-line survey indicated their informed consent. Participants provided an email address for administration of the follow-up survey to be conducted at the end of the implementation phase, ap-proximately one year later.
Focus Groups and Key Informant Interviews: Site RAs recruited and scheduled key individuals within their hospital for participation in qualitative interviews. Key informants were department heads, members of the SIT and staff members in key positions (e.g. dietitian, diet technician, nurses, food service workers). It was left to the discretion of the site champion to identify these in-fluential site informants for a one-on-one interview. Two or three focus groups (n= 11) were held at each site over the lunch hour on two consecutive days; lunch was provided. All staff on the unit that day were wel-come to participate. The key informants and focus group participants reviewed an information letter and provided written consent before the discussion began. These qualitative data will be used to understand the setting and context, including suggestions for making improve-ments in nutrition care within the unit [55, 65].
Table 1Overview of data collection methods and their corresponding research question and phase of the study
Data collection form/method Research question Developmental phase Implementation phase Sustainability phase Type of data
INPAC Audit 1 and 4 √ √ √ Quantitative
Detailed Patient Data 2 √ √ Quantitative
30-Day Follow-up 2 √ √ Quantitative
Focus Groups/ Interviews 4 and 5 √ √ Qualitative
Staff KAP questionnaire 3 √ √ Quantitative
RD/staff workload 6 √ √ Quantitative
Activity Time Test 6 √ Quantitative
DICE Scores 4 √ √ √ Quantitative
Scorecards 4 and 5 √ Qualitative
Monthly telephone calls 4 and 5 √ Qualitative
Both focus groups and interviews were conducted by one researcher to promote consistency. A semi-structured interview guide that had been vetted by researchers, site champions, and RAs was used and tailored to each site based on the current nutrition care practices undertaken. The Active Interview method [73] was used to build rap-port and tailor interviews to informants. The researcher visited the site for approximately two days to collect all interview and focus group data as well as to conduct a site visit to further understand the hospital and unit climate for implementation.
A total of 40 key informant interviews were conducted and 11 focus groups with various staff members (n= 89; range of participants per site: 12–21; range of partici-pants per focus group: 4–14). All interviews and focus groups were audio recorded. Interview data were profes-sionally transcribed and checked by the interviewer. Focus group audio-recordings were not transcribed but extensive notes were taken from audio recordings by the researcher. Audio recordings were reviewed upon com-pletion of each day of data collection in the site, with memos written to support development of the under-standing of the setting and to identify further lines of inquiry with subsequent interviews [74, 75]. A key com-ponent of this qualitative data collection was to deter-mine barriers and facilitators to change processes and specifically INPAC activities. These data are necessary to identify areas for improvements as well as priming the sites for this change [49, 53, 58, 76]. Collection of this information is a key step in the KTA process.
Audits of Nutrition Care Activities for Patients: The proportion of patients receiving INPAC nutrition care activities (e.g. % screened, assessed, receiving advanced care) is a primary outcome. This information was col-lected through unidentified patient (e.g. their unit bed number was only used) chart review over four consecu-tive weeks during baseline data collection. The day of the week on which chart review occurred was consistent. All patients on the unit that day had their medical chart reviewed to determine: if and when they had been screened; if SGA was completed; when and if they were assessed by a dietitian if applicable; what nutrition diag-noses were made; if and what barriers to food intake were assessed; if and when food intake or body weight monitoring occurred and what forms of nutrition treat-ment occurred. Gender and age were also noted as well as admission date to the unit. A total of 700 patients were included in the audits for the five sites during base-line. Informed consent was not required for this audit, however some hospitals ethics boards required notices for patients and families to view on the unit to inform them that an anonymous chart review was being completed for this research project. INPAC audits were collected with a paper form and were transferred into
M2E project RedCAP™ on-line forms for secure data capture and access by researchers.
Patient Reported Outcomes & Detailed Patient Data Collection: To assess patient reported outcomes, re-source utilization and to track frailty and disability, 40 patients were recruited over a four-week period during baseline from each study unit (total n= 200). This sample size was chosen primarily for feasibility reasons, considering the workload of the RAs with implementa-tion and data collecimplementa-tion. Patients were eligible for this detailed assessment if: they were likely to be hospitalized for a minimum of three days; admitted from the com-munity and expected to return to the comcom-munity; able to speak and read English, or at the bilingual site, French; consumed an oral diet (could have enteral or parenteral supplementation); did not have delirium or dementia, as assessed at admission by nursing (as some assessments require cognitive capacity); and provided written consent to data collection procedures including a telephone follow up post discharge with research staff from the University of Waterloo. Staff from the circle of care identified eligible patients who were interested in hearing about the study and the RA completed informed consent and measurements. Demographics, admission diagnosis and length of stay were recorded. The patient was screened with the CNST [38]. SGA was completed if they were at risk, and the clinical dietitian providing care to the unit was notified of the status of the patient. If nutrition treatments were in place, these were re-corded. The SGA is used to diagnose malnutrition and includes information on dietary intake, weight, symp-toms, functional capacity and metabolic requirements, as well as a physical exam for fat, muscle and edema. Patients were then classified as either well nourished (A), mildly/moderately or suspected of being malnour-ished (B), or severely malnourmalnour-ished (C) [39]. Patients reported their perceptions of food intake (more than enough, enough, not enough) and their current nutri-tional health (excellent, very good, good, fair, poor).
the patient was seated preferably in a chair, but otherwise in bed. If the dominant arm had an IV, the non-dominant arm was used. If the patient was unable to complete either frailty measure, reasons for non-completion were noted. The average of the three attempts at each of these mea-sures was determined for analyses.
Disability was assessed with the 7-item Nagi scale where patients reported their perceived difficulty in completing activities (e.g. pushing or pulling a large object like a living room chair, picking up small objects with fingers) [79]. Quality of life was assessed with the SF-12 [80]. Both of these measures were completed by interview with the site RA. Nutritional status, frailty and quality of life measures were used to characterize participants.
Two patient-reported outcomes are anticipated to change with INPAC implementation, food intake and barriers experienced at mealtimes. Patients self-reported the proportion of overall intake of food on the tray and intake of each provided beverage (0, 25, 50, 75, 100%) for a single meal, as well as their appetite, reasons for a lower than usual appetite and any challenges they expe-rienced at the meal with the My Meal Intake Tool (M-MIT) [42]. Where necessary, the RA completed this measure based on interview with the patient. A separate meal was used to assess a list of 18 barriers to food intake as well as to obtain the perception of patients with respect to the importance they and staff placed on nutrition for their recovery using the Mealtime Audit Tool (MAT) [41]. This tool was completed by interview with the RA.
The final form of assessment for these detailed patient data collections was focused on determining resources utilized at mealtimes to support the patient to eat. Staff/ volunteers or family at all meals on a single day were asked to check off care activities they provided for these patients (e.g. opening tray, providing eating assistance). It is anticipated that after INPAC implementation, more help will be provided to patients who need it. All de-tailed patient data collection was transferred from paper forms to RedCAP™for transmission to researchers.
Patients who received the detailed assessment and provided follow up call information received a telephone call from the research/facilitation staff at the University of Waterloo, approximately 30 days after patients were discharged. Patients provided consent to have re-searchers contact them or a proxy for follow up and their phone numbers were provided to the research staff. Up to five telephone attempts were made to reach the patient before trying the proxy (if provided) for an add-itional three times. Quality of life (SF-12), disability (Nagi scale), self-reported weight change, use of food/ meal services or help, food related activities of daily liv-ing, frequency of eating alone, perceptions of nutritional health, food intake and appetite were reported. Patients
also self-reported being prescribed a special diet and re-ceiving recommendations for community services and if they followed these recommendations, use of oral nutri-tional supplements, as well as visiting health profes-sionals for care, including a dietitian. If the patient had visited the emergency room or was admitted to hospital this was also recorded. Proxies reported on the death or readmission of the patient if they could not be located. If the patient was unreachable and the proxie’s knowledge of the patient’s health status was adequate, the proxy completed the survey on behalf of the patient. Of the n= 200 detailed patient data collection participants, 93% (n= 185) of patients provided follow up tion. Of those patients that provided contact informa-tion, 59% (n= 109) completed the 30-day follow-up during baseline data collection.
Other Data:In addition to the patient level data of the INPAC audits and detailed patient assessments to collect process and outcome data, further data were collected at the site level. This additional data was collected over a 4-week period, and included tracking of dietitian time on the unit for nutrition care activities such as time for assessment, monitoring and treating patients. As the patients included in the detailed assessments were not necessarily representative of all patients on the unit, average length of stay in the year prior to the develop-mental phase will be collected. To estimate resource cost for mealtime activities described above in the detailed patient assessment, time required and staff roles at each hospital need to be matched to these activities. At each site an average time to complete these activities was de-termined from monitoring up to 10 episodes of an activ-ity (e.g. time it takes to assist a patient to consume all food on their tray) and noting the staff members who routinely completed these tasks. This data collection was performed on any patient and staff member on the unit who required these care activities. The activity, time to complete, and the staff (e.g. registered nurse, personal support worker) that completed the task were noted. As no personal information was recorded for these time-testing patients or staff, informed consent was not re-quired. This time assessment was completed by the RAs and data on time required for each activity was submit-ted to the researchers on an Excel spreadsheet.
Data collection in the implementation and sustainability phases
in the protocol to see any potential change in this meas-ure as a result of nutrition care practices for the patient.
During the implementation phase, INPAC audits are completed twice per month, mostly on the same day of the week as with the baseline collection. A target of 20 patients per month for detailed assessments (e.g. SGA, SF-12, frailty, resource use at meals) was set. Dietitians, and in some sites diet technicians, monitor how they used their time in patient care activities one week per month. Monthly INPAC audits and detailed patient as-sessment reports summarizing these data are provided back to the sites to aid in the planning of their imple-mentation of INPAC and to demonstrate the integration into practice. An amalgamated monthly INPAC report summarizes all five sites and is used to compare and contrast progression. The amalgamated report is also provided to assist in goal setting for each site. This type of continuous feedback is an important technique for behaviour change management and implementation [44, 51, 58, 65, 81, 82]. Thirty-day follow-up of patients occurs between the fourth and sixth months of imple-mentation with the goal of attaining 40 patients per site who agreed to this telephone follow up questionnaire completed by the researchers. This is repeated again between months 10 and 12 of implementation for a goal ofn= 400 during the implementation phase.
Qualitative and quantitative data is also being collected on the implementation process. Sites document on an INPAC Scorecard, various activities undertaken to im-plement INPAC. This includes meetings between the champion, RAs, SIT and other stakeholders in the site. The content for the recording of the meeting objectives and activities is structured under the Model for Im-provement (What are we trying to change? How will we know a change is an improvement? What changes can be made that will result in an improvement?) [64]. People attending, dates, and expected date of achieving discussed goals are also tracked. The INPAC Scorecard also includes a table for noting any education or training activities with staff (date, number attending, primary audience, topic, and if evaluation was conducted). Any self-reflection on learnings from the implementation process (barriers, facilitators, recommendations for other sites) and educational activities are also recorded. Fi-nally, any meetings with decision makers or any other activities that could be considered part of implementa-tion are recorded.
Scorecards are reviewed by the research/facilitation team and used as the basis for monthly teleconferences with all sites. These teleconferences are audio-recorded and used as a mechanism for sharing learnings and suc-cessful strategies, to attain advice on challenges experi-enced and to receive co-mentoring and facilitation from the researchers and other champions and RAs
[51, 58, 59]. Each month the discussion is led by the PI and each site provides a brief update on key activities. The group then discusses a key area of INPAC they are currently implementing (e.g. screening, SGA, Standard Care, discharge planning etc.). Administrative points on data collection are also discussed to promote data qual-ity and consistency. Minutes of the meeting are circu-lated to the sites within one week of the meeting.
The DICE® Score [83], from business change manage-ment, provides a subjective numerical rating that can be used to predict potential success with implementation of a change activity within each site. Four members of the research/facilitation team meet face-to-face on a quar-terly basis to review the progress made by the sites for implementation and to share their DICE® Scores. Each team member develops their numerical scores based on the DICE® structure (Duration, Integrity, Commitment and Effort) [83] independently, based on their diverse perspectives from interacting with the sites; descriptors and activities specific to the project were used to sup-port ratings. Perspectives vary as each member of this team have slightly different interactions with champions, RAs and SITs (e.g. CL and BD participate in site visits and on-site training of SGA, RV manages all data and enquiries; HK manages the team overall and provides in-dividual coaching to sites via phone and email). A mid-implementation site visit was conducted by some of these researchers/facilitators and memos on the observa-tions and informal discussions were completed and discussed with the entire research/facilitation team. DICE® scores were completed before and after these mid-implementation site visits. After team discussion, the individual DICE® scores are averaged across the four researchers/facilitators. The DICE® calculator indicates if scores are in the Win, Worry, or Woe Zones with re-spect to potential success of implementing and sustain-ing the INPAC care activities [83].
completion, the on-line survey site will be opened in the 10th month of implementation. The research team will invite staff members who participated at baseline by email to complete the survey. If the staff member no longer works on the unit or does not respond, further staff will be recruited by site RAs to meet the quota of 30 per site to allow for group level analysis. A few add-itional questions asking the staff member to rate the changes observed and their benefits have been included with the original questions used at baseline. These ques-tions will be reviewed by the investigatory team and site teams to ensure that wording is clear.
Results from the implementation phase on success with integrating INPAC activities into practice, as well as the staff KAP survey results and preliminary results from the focus group and key informant interviews, will be reviewed at a stakeholder meeting held at the end of the implemen-tation phase. The purpose of this final face-to-face stakeholder meeting, which will include investigators, col-laborators, champions and RAs, will be to celebrate success and consider how INPAC can be spread within the test sites and disseminated further. The INPAC Implementation Toolkit will be a key discussion point. This will be virtual toolkit located on a collaborator’s website (Canadian Mal-nutrition Task Force, www.Mal-nutritioncareincanada.ca).
INPAC audits (eight over three months) will be com-pleted during the Sustainability Phase with the primary purpose of determining if INPAC care activities that have been implemented are retained during this three-month period. The average length of stay for patients on the unit during the implementation year will be calculated for comparison to the year prior to implementation.
Statistical analyses
This is an extensive data collection with quantitative, qualitative and mixed methods analyses planned. The following discussion is focused solely on the research questions, however it is anticipated that a variety of sec-ondary data analyses will also be completed. The statis-tical packages RStudio (version 3.2.4), SPSS Version 23, and Excel will be used for all analyses. Qualitative data will be categorized and displayed with both Excel and NVivo 11. The principal objective is the development of a knowledge product, the INPAC Implementation Tool-kit that provides a guide for others wishing to imple-ment INPAC activities in their site. It is anticipated that such a tool will promote knowledge translation to reach the overall aim of this work. An outline of the toolkit content has been circulated among co-investigators, collaborators, RAs and champions to identify what are essential concepts and aspects for inclusion (e.g. how to stimulate change, use of behaviour change techniques to make change, example knowledge translation tools such as patient or staff posters etc.). It is anticipated that this
group of stakeholders and others will provide input at various points over the next year to finalize the toolkit, which will be virtual. It is also anticipated that a descrip-tive manuscript on the toolkit will be submitted to an open access journal.
Research Question 1: Site level analyses will be com-pleted by graphical presentation of INPAC activities (e.g. screening) from the 36 audits collected over baseline, implementation and sustainability phases. Where pos-sible multi-level mixed effects linear regression models will be explored to determine changes over time within the site clusters. Descriptive analyses and graphical presentation will also be completed to report the triaging process (e.g. % at risk who received SGA and proportion of malnourished via SGA who received an assessment) and what advanced and standard nutrition care activities are commonly used within the sites to prevent and treat malnutrition. These latter analyses may be completed within site only.
Research Question 2: Patient reported outcomes of food intake (M-MIT) and barriers to food intake (MAT) will be averaged per site, per month and these medians will be graphically presented by month, by site. Where possible multi-level mixed effects linear regression models will be explored to determine changes over time within the site clusters. Site differences will be explored and interpreted using knowledge of the various INPAC activities implemented at each site.
Research Question 3: Staff KAP are collected at base-line and at the end of the implementation phase. The same staff at each hospital is anticipated to complete these surveys. Where this occurs, paired t-tests (or Wilcoxon matched pairs signed ranks test) will be used to determine differences in total knowledge/attitude and practice scores as well as mean differences in individual items. It is anticipated that there will be some loss of participants from baseline and new staff will be recruited to make up the quota for the site. Unmatched analysis will be used in this case (e.g. t-test, Mann Whitney U). The second administration also includes some questions focused on sustainability. These and the demographics of participants will be descriptively presented (e.g. proportion, median).
focus group/key informant interviews and DICE® scores will be used to interpret quantitative differences.
Monthly telephone call recordings are reviewed after the call by one or more researchers with memos and de-scriptive notation of key activities recorded. Scorecards and monthly telephone calls are descriptively analyzed and key content is displayed as matrices [75]. Matrices are organized by site, across INPAC activity (e.g. screen-ing) and data are deductively coded by using the COM-B model to categorize strategies and behaviour change techniques used by sites to implement each INPAC activity (e.g. techniques to implement volunteer train-ing that are focused on buildtrain-ing capability). Content analysis [75] will be used to summarize these data to identify the most common techniques used for vari-ous INPAC activities.
The average DICE® score across the research team per quarter will be a key component to address this question. This subjective rating will be analyzed quantitatively by determining the median across time points for a site, as well as the difference between baseline and final DICE® scores. Sites in the Woe zone for DICE® are anticipated to have slower implementation of INPAC activities and po-tentially poorer sustainability. Focus group and interview data (coding and analysis described below) will inform common contextual challenges (e.g. retraining for new staff, keeping the unit engaged with the change process). It is anticipated that meta-matrices will be completed to summarize these data and aid in interpretation and com-parison of sites [75]. Run chart examples of quantitative data, case scenarios, themes and quotes will be used to display and merge these qualitative and quantitative data. Member checking with site champions, RAs and SITs on this analysis will occur [54].
Research Question 5: A thematic qualitative analysis [74, 75] will be used with the focus group and key in-formant interview data collected at baseline and the end of the implementation phase. Analysis has begun for the baseline data. All data were professionally transcribed and checked by the interviewer (CL). NVivo 11 was used to inductively code and structure the data by one re-searcher (CL), although support for developing the cod-ing structure based on the data was provided by a second researcher (RV). Only the interview data was fully coded as this method was found to provide the richest data, with focus group data used to complement and reinforce emerging themes. Focus group data cordings were reviewed several times by a single re-searcher (CL) and memos written to capture this data. These memos and the coded transcripts are being ana-lyzed thematically [74, 75]. A single researcher who con-ducted the interviewers, completed all line by line and higher order inductive coding (CL). This initial coding and tentative theme ideas were reviewed and discussed
with a second researcher (RV). Themes took form as memos describing the theme, and identifying themes with data (e.g. quotes); matrices of themes, subthemes and quotes were used to display this analysis. These summary documents were reviewed by two researchers (HK and RV) to help refine and condense. A thematic diagram has been developed based on this group ana-lysis. To confirm, refine and extend these developing themes, three researchers (HK, RV, JB) other than the lead for this analysis (CL), reviewed original uncoded transcripts (n= 15 across all sites from 40 interviews) and reviewed the thematic structure developed by CL. It is anticipated that a similar process will be used for the second set of focus group and key informant interview data to analyze and develop themes focused on sustain-ability and learnings from implementation. It is antici-pated that member checking of the thematic structure with site champions, RAs and SIT will occur [54].
Research Question #6: Site champions provided key resource information (e.g. number of dietitians in hos-pital and serving the study unit, salary level) on the site survey. RAs also completed a meal activity time test on 5–10 episodes of each mealtime activity (e.g. how long it takes to assist a patient with eating; how long does it take to set up a tray) to determine average time and thus potential resource cost for providing these standard care activities described in INPAC. Additionally, dietitians noted their time in various patient related activities be-fore and during implementation (e.g. number and time taken to screen, complete SGA, complete a full assess-ment, arrange advanced care strategies such as medica-tion pass of oral nutrimedica-tional supplement). These data will be used to describe the resources required to implement the care activities in INPAC. Average time spent in INPAC activities during developmental and implementa-tion phases, per site will be calculated and compared. Costs attributed to dietitian and other staff time for mealtime activities will be averaged across the sites, using their own data on staff and other resource costs. With the SF-12 data there is the potential to also conduct further analyses on how quality of life rated by participants is associated with resource utilization.
Discussion
stay. Data collection procedures, merging of qualitative and quantitative data in analysis to address research questions and understand implementation will be useful to other implementation scientists. Learnings from the developmental and implementation phases can guide further complex intervention research.
Abbreviations
BCW:Behaviour Change Wheel; INPAC: Integrated Nutrition Pathway for Acute Care; KAP: Knowledge, attitude and practices; M2E: More-2-Eat project; MAT: Mealtime audit tool; M-MIT: My Meal Intake Tool; PDSA: Plan-Do-Study-Act cycles; PI: Principle investigator; RAs: Research associates; SGA: Subjective global assessment; SIT: Site implementation teams
Acknowledgements
The M2E implementation study team includes the following co-investigators (C. Basualdo- Hammond, P. Bernier, L. Curtis, D. Duerksen, P. Douglas, , L. Gramlich, M. Laporte), collaborators (L. Dietrich, J. Dubin, K. Jeejeebhoy, A. Maybee, M. Mourtzakis, S. Robbins, R. Sawatzky, H. Truber), champions (M. Atkins, D. Butterworth, S. Obiorah, R. Nasser, M. Stickles-White, M. Tom) and research associates: (M. Booth, S A. Digweed, Doering, S. Cowan, C. Marcell, L. Vescio). Canadian Malnutrition Task Force has provided in-kind project management through the Director Bridget Davidson who is also part of the research/facilitation team. NNEdPro has specifically supported key aspects of implementation toolkit development and will provide dissemination across its network. Dietitians of Canada, Canadian Nutrition Society and the Canadian Society of Nutrition Management also support dissemination of this work.
Funding
Canadian Frailty Network SIG2014-08.
Availability of data and materials Not applicable.
Authors’contributions
HK is the primary investigator and lead of this project. CL, RV, and TM are university researchers involved in data collection. CL was instrumental in review of data collection materials during development and conducted focus groups and key informant interviews. RV manages all quantitative data, while TM analyzes monthly teleconference data. SR had an advisory role particularly in the educational components of the study as well as functioning as a doctoral advisor to CL’s work on and around this study. JB provided expertise on change management. SB and JM are site research associates collecting data and implementing INPAC. All authors read and approved the final manuscript.
Competing interests
The authors declare that they have no competing interests.
Consent for publication No personal data is noted herein.
Ethics approval and consent to participate
University of Waterloo (ORE #20590) and site ethics boards: Niagara Health Ethics Board, Ottawa Health Science Network Research Ethics Board, Health Research Ethics Board of the University of Alberta, Regina Qu’Appelle Health Region Research Ethics Board, University of Manitoba Health Research Ethics Boards and Concordia Hospital Research Ethics Committee, approved and provided clearance for this research study. Data collection directly from patients or staff required informed written consent which was attained prior to data collection.
Author details
1Schlegel-University of Waterloo Research Institute for Aging, University of
Waterloo, 250 Laurelwood Drive, Waterloo, ON N2J 0E2, Canada.2Faculty of Applied Health Sciences, University of Waterloo, 200 University Ave, Waterloo, ON N2L 3G1, Canada.3School of Human Movement and Nutrition Sciences, The University of Queensland & The Prince Charles Hospital, Rode Road, Chermside, QLD 4032, Australia.4NNEdPro Global Centre for Nutrition and Health (Affiliated with: Cambridge University Health Partners, Wolfson College Cambridge and the British Dietetic Association), St John’s Innovation Centre, Cowley Road, Cambridge CB4 0WS, UK.5The Ottawa Hospital |
L’Hôpital d’Ottawa, 501 Smyth Rd, Ottawa, ON K1H 8L6, Canada.6Concordia Hospital, 1095 Concordia Ave, Winnipeg, MB R2K 3S8, Canada.
Received: 3 December 2016 Accepted: 7 January 2017
References
1. Vanderwee K, Clays E, Bocquaert I, Verhaeghe S, Lardennois M, Govert M, Defloor T. Malnutrition and nutritional care practices in hospital wards for older people. J Adv Nurs. 2010;67(4):736–46.
2. Corish CA, Kennedy NP. Proteenergy undernutrition in hospital in-patients. Br J Nutr. 2000;83:575–91.
3. Allard JP, Keller H, Jeejeebhoy KN, Laporte M, Duerksen D, Gramlich L, Payette H, Bernier P, Vesnaver E, Davidson B, Terterina A, Lou W. Malnutrition at hospital admission: contributors and impact on length of stay. A prospective cohort study from the Canadian Malnutrition Task Force. J Parenter Enteral Nutr. 2016;40(4):487–97. doi:10.1177/0148607114567902. 4. Bell J, Bauer J, Capra S, Pulle CR. Barriers to nutritional intake in patients
with acute hip fracture: time to treat malnutrition as a disease and food as a medicine? Can J Physiol Pharmacol. 2013;91:489–95.
5. Young AM, Mudge AM, Banks MD, Ross LJ, Daniels L. Encouraging, assisting and time to EAT: improved nutritional intake for older medical patients receiving Protected Mealtimes and/or additional nursing feeding assistance. Clin Nutr. 2013;32:543–9.
6. Keller H, Allard JP, Laporte M, Davidson B, Payette H, Bernier P, Jeejeebhoy K, Duerksen DR, Gramlich L. Predictors of dietitian consult on medical and surgical wards. Clin Nutr. 2015;34(6):1141–5.
7. Keller H, Payette H, Allard J, Jeejeebhoy K, Duerksen D, Bernier P, Laporte M, Gramlich L.‘Leaving Hospital’: nutritional status of older adults transitioning to and out of hospital, a report of the Canadian Malnutrition Task Force. J Nutr Health Aging. 2014;18(6):63.
8. Keller H, Allard J, Vesnaver E, Laporte M, Gramlich L, Bernier P, Davidson B, Duerksen D, Jeejeebhoy K, Payette H. Barriers to food intake in acute care hospitals: a report of the Canadian Malnutrition Task Force. J Hum Nutr Diet. 2015;28(6):546–57.
9. Naithani S, Thomas JE, Whelan K, Morgan M, Gulliford MC. Experiences of food access in hospital. A new questionnaire measure. Clin Nutr. 2009;28(6): 625–30.
10. Zisberg A, Shadmi E, Gur-Yaish N, Tnkikh O, Sinoff G. Hospital–associated functional decline: the role of hospitalization processes beyond individual risk factors. J Am Geriatr Soc. 2015;63:55–62.
11. Barker LA, Gout BS, Crowe TC. Hospital malnutrition: prevalence, identification and impact on patients and the healthcare system. Int J Environ Res Public Health. 2011;8:514–27.
12. Agarwal E, Ferguson M, Banks M, Batterham M, Bauer J, Capra S, Isenring E. Malnutrition and poor food intake are associated with prolonged hospital stay, frequent readmissions, and greater in-hospital mortality: results from the Nutrition Care Day Survey 2010. Clin Nutr. 2013;32(5):737–45. 13. McWhirter JP, Pennington CR. Incidence and recognition of malnutrition in
hospital. Br Med J. 1994;308(6934):945–8.
14. Sivakumar BS, McDermott LM, Bell JJ, Pulle CR, Jayamaha S, Ottley MC. Dedicated hip fracture service: implementing a novel model of care. ANZ J Surg. 2013;83(7–8):559–63.
15. Tappenden KA, Quatrara B, Parkhurst ML, Malone AM, Fanjiang G, Ziegler TR. Critical role of nutrition in improving quality of care: an interdisciplinary call to action to address adult hospital malnutrition. J Parenter Enteral Nutr. 2013;37(4):482–97.
16. Laur C, McCullough J, Davidson B, Keller HH. Becoming food aware in hospital: a narrative review to advance the culture of nutrition care in hospitals. Healthcare. 2015;3(2):393–407.
17. Keller HH, Vesnaver E, Davidson B, Allard J, Laporte M, Bernier P, Payette H, Jeejeebhoy K, Duerksen D, Gramlich L. Providing quality nutrition care in acute care hospitals: perspectives of nutrition care personnel. J Hum Nutr Diet. 2014;27(2):192–202.
18. Keller HH, Allard J, Vesnaver E, Laporte M, Gramlich L, Bernier P, Davidson B, Duerksen D, Jeejeebhoy K, Payette H. Barriers to food intake in acute care hospitals: a report of the Canadian Malnutrition Task Force. Nutr J. 2015; 19(14):63.
causes of malnutrition in Canadian hospitals: results of a Canadian Malnutrition Task Force Survey. J Parenter Enteral Nutr. 2016;40(1):100–6.
20. Duerksen DR, Keller HH, Vesnaver E, Allard JP, Bernier P, Gramlich L, Payette H, Laporte M, Jeejeebhoy K. Physicians’perceptions regarding the detection and management of malnutrition in Canadian hospitals results of a Canadian malnutrition task force survey. J Parent Enteral Nutr. 2015;39(4):410–7. 21. Sahyoun NR, Akobundu U, Coray K, Netterville L. Challenges in the delivery
of nutrition services to hospital discharged older adults: the community connections demonstration project. J Nutr Elder. 2009;28:127–42. 22. The European Nutrition for Health Alliance, BAPEN, International Longevity
Centre-UK. Malnutrition Among Older People in the Community. Policy Recommendations for Change. UK Policy Report 2006. www.european-nutrition.org/publications.cfm. Accessed 1 Oct 2016.
23. Leistra E, van Bokhorst-de van der Schueren MAE, Visser M, van der Hout A, Languis AE, Kruizenga HM. Systematic screening for undernutrition in hospitals: predictive factors for success. Clin Nutr. 2013;33(3):495–501. 24. van Asselt DZ, van der Cammen TJ, Disselhorst LG, Janse A,
Lonterman-Monasch S, Maas HA, Popescu ME, Schölzel-Dorenbos CJ, Sipers WM, Veldhoven CM, Wijnen HH. Assessment and treatment of malnutrition in Dutch geriatric practice: consensus through a modified Delphi study. Age Ageing. 2012;41(3):399–404.
25. NHS Commissioning Board & BAPEN. What does good nutritional care look like? 2013. http://www.bapen.org.uk/images/pdfs/news/what-does-good-nutritional-care-look-like.pdf. Accessed 1 Oct 2016.
26. Schindler K, Pernicka E, Laviano A, Howard P, Schütz T, Bauer P, Grecu I, Jonkers C, Kondrup J, Ljungqvist O, Mouhieddine M. How nutritional risk is assessed and managed in European hospitals: a survey of 21,007 patients findings from the 2007–2008 cross-sectional nutritionDay survey. Clin Nutr. 2010;29(5):552–9. 27. Holst M, Rasmussen H. Nutrition therapy in the transition between hospital
and home: an investigation of barriers. J Nutr Metab. 2013. doi:10.1155/ 2013/463751.
28. Department of Health & Human Services. Malnutrition in Victorian cancer services- Malnutrition governance toolkit. 2015. https://www2.health.vic.gov. au/about/publications/policiesandguidelines/
Malnutrition%20in%20Victorian%20cancer%20services%20-%20Malnutrition%20governance%20toolkit. Accessed 15 Sept 2016. 29. Hoekstra JC, Goosen JHM, de Wolf GS, Verheyen CCPM. Effectiveness of
multidisciplinary nutritional care on nutritional intake, nutritional status and quality of life in patients with hip fractures: a controlled prospective cohort study. Clin Nutr. 2011;30:455–61.
30. Dutch Malnutrition Screening Group. Dutch Malnutrition Screening Group Guideline: Screening and treatment of malnutrition. 2011. http://www. fightmalnutrition.eu/fileadmin/content/fight_malnutrition/methodology/ Guideline_Screening_and_Treatment_of_Malnutrition_English_July_2012. pdf. Accessed 1 Sept 2016.
31. Omidvari AH, Vali Y, Murray SM, Wonderling D, Rashidan A. Nutritional screening for improving professional practice for patient outcomes in hospital and primary care settings. Cochrane Database Syst Rev. 2013;(6): CD005539. doi:10.1002/14651858.CD005539.pub2.
32. Brotherton A, Simmonds N, Stroud M. Malnutrition Matters: Meeting quality standards in nutritional care. A toolkit for clinical commissioning groups and providers in England. 2nd ed. Redditch: BAPEN; 2012.
33. Raynaud-Simon A, Revel-Delhom C, Hébuterne X. Clinical practice guidelines from the French Health High Authority: nutritional support strategy in protein-energy malnutrition in the elderly. Clin Nutr. 2011;30:312–9.
34. Mudge AM, Ross LJ, Young AM, Isenring EA, Banks MD. Helping understand nutritional gaps in elderly (HUNGER): a prospective study of patient factors associated with inadequate nutritional intake in older medical inpatients. Clin Nutr. 2011;30:320–5.
35. Hickson M, Connolly A, Whelan K. Impact of protected mealtimes on ward mealtime environment, patient experience and nutrient intake in hospitalised patients. J Hum Nutr Diet. 2011;24(4):370–4.
36. Block L, Morgan-Gouveia M, Levine RB, Cayea D. We could have done a better job: a qualitative study of medical student reflections on safe hospital discharge. J Am Geriatr Soc. 2014;62(6):1147.
37. Keller H, McCullough J, Davidson B, Vesnaver E, Laporte M, Gramlich L, Allard J, Bernier P, Duerksen D, Jeejeebhoy K. The Integrated Nutrition Pathway for Acute Care (INPAC): building consensus with a modified Delphi. Nutr J. 2015;14:63. doi:10.1186/x12937-015-0051-y. 38. Laporte M, Keller H, Payette H, Allard JP, Duerksen DR, Bernier P,
Jeejeebhoy K, Gramlich L, Vesnaver E, Teterina A. Validity and reliability
of the new Canadian Nutrition Screening tool in the‘real-world’ hospital setting. Eur J Clin Nutr. 2015;69(5):558–64.
39. Detsky AS, Baker JP, Johnston N, Whittaker S, Mendelson RA, Jeejeebhoy KN. What is subjective global assessment of nutritional status? J Parenter Enteral Nutr. 1987;11(1):8–13.
40. Persson MD, Brismar KE, Katzarski KS, Nordenström J, Cederholm TE. Nutritional status using mini nutritional assessment and subjective global assessment predict mortality in geriatric patients. J Am Geriatr Soc. 2002; 50(12):1996–2002.
41. McCullough J. My Meal Intake Tool (MMIT) and the Mealtime Audit Tool (MAT) - Criterion Validity and Inter-rater Reliability Testing of two Novel Tools for Improving Food Intake in Acute Care. UWSpace. http://hdl.handle. net/10012/10512.
42. McCullough J, Keller H. MMIT: My Meal Intake Tool (MMIT) - A valid food intake monitoring assessment for acute care hospital patients. J Nutr Health Aging. 2016. doi:10.1007/s12603-016-0859-y.
43. Laur C, Marcus H, Ray S, Keller HH. Measuring hospital staff’s knowledge, attitudes and practices with respect to quality nutrition care. Healthcare. 2016;6:79.
44. Farrer K, Donaldson E, Blackett B, Lloyd H, Forde C, Melia D, Lal S. Nutritional screening of elderly patients: a health improvement approach to practice. J Hum Nutr Diet. 2014;27:184–91.
45. Rasmussen HH, Kondrup J, Staun M, Ladfoged K, Lindorff K, Mørch Jørgensen L, Jakobsen J, Kristensen H, Wengler A. A method for implementation of nutritional therapy in hospitals. Clin Nutr. 2006;25:515–23.
46. Bell JJ, Bauer JD, Capra S, Pulle RC. Multidisciplinary, multi-modal nutritional care in acute hip fracture inpatients–Results of a pragmatic intervention. Clin Nutr. 2014;33(6):1101–7.
47. Stoopendaal A, Bal R. Conferences, tablecloths and cupboards: How to understand the situatedness of quality improvements in long-term care. Soc Sci Med. 2013;78:78–85.
48. Ellen ME, Leon G, Bouchard G, Ouimet M, Grimschaw JM, Lavis JN. Barriers, facilitators and views about next steps to implementing supports for evidence-informed decision-making in health systems: a qualitative study. Implement Sci. 2014;8:179.
49. Moore J, Mascarenhas A, Marquez C, Almaawiy U, Chan W-H, D’Souza J, Liu B, Straus SE. Mapping barriers and intervention activities to behavior change theory for guide for adapting a multisite educational intervention: Mobilization of Vulnerable Elders in Ontario (MOVE ON), a multi-site implementation intervention in acute-care hospitals. Implement Sci. 2014;9:160.
50. Doyle C, Howe C, Woodcock T, Myron R, Phekoo K, McNicholas C, Safer J, Bell D. Making change last: applying the NHS institute for innovation and improvement sustainability model to healthcare improvement. Implement Sci. 2013;8:127.
51. Leykum LK, Pugh JA, Lanham HJ, Harmon J, McDaniel Jr RR.
Implementation research design: integration participatory action research into randomized controlled trials. Implement Sci. 2009;4:69.
52. Patton MQ. Developmental evaluation: applying complexity concepts to enhance innovation and use. 1st ed. New York: Guilford Press; 2011. 53. Bell JJ, Rossi T, Bauer JD, Capra S. Developing and evaluating interventions
that are applicable and relevant to inpatients and those who care for them; a multi-phase, pragmatic action research approach. BMC Med Res Methodol. 2014;14:98.
54. Ray S, Laur C, Douglas P, Rajput-Ray M, van der Es M, Redmond J, Eden T, Sayegh M, Minns L, Griffin K, McMillan C. Nutrition education and leadership for improved clinical outcomes: training and supporting junior doctors to run‘Nutrition Awareness Weeks’in three NHS hospitals across England. BMC Med Educ. 2014;14:1.
55. Simpson KM, Porter K, McConnell ES, Colon-Emeric C, Daily KA, Stalzer A, Anderson RA. Tool for evaluating research implementation challenges: a sense-making protocol for addressing implementation challenges in complex research settings. Implement Sci. 2013;8:2.
56. Creswell JW, Plano Clark VL. Designing and conducting mixed methods research. Thousand Oaks: Sage Publications; 2007.
57. Benzer JK, Beehler S, Cramer IE, Mohr DC, Charns MP, Burgess Jr JF. Between and within-site variation in qualitative implementation research. Implement Sci. 2013;8:4.
59. Nadeem E, Olin SS, Campbell Hill L, Eaton Hoagwood K, McCue HS. Understanding the components of quality improvement collaboratives: a systematic literature review. Milbank Q. 2013;91(2):354–94.
60. Ijkema R, Langelaan M, van de Steeg L, Wagner C. What impedes and what facilitates a quality improvement project for older hospitalized patients? Int J Qual Health Care. 2014;26(1):41–8.
61. McCormack B, Rycroft-Malone J, DeCorby K, Hutchinson AM, Bucknall T, Kent B, Schultz A, Snelgrove-Clarke E, Stetler C, Titler M, Wallin L, Wilson V. A realist review of interventions and strategies to promote evidence-informed healthcare: a focus on change agency. Implement Sci. 2013;8:107.
62. Laur C, Keller H. Implementing best practice in hospital multidisciplinary nutritional care: an example of using the knowledge-to-action process for a research program. J Multidiscip Healthc. 2015;8:463–72.
63. McMormack B, McCarthy G, Wright J, Coffey A, Slater P. Development of the Context Assessment Index (CAI). Ulster: University of Ulster; 2008. 64. Institute CPS. Improvement frameworks getting started kit. 2015. http://www.
patientsafetyinstitute.ca/en/toolsresources/improvementframework/pages/ default.aspx. Accessed Sept 1, 2016.
65. Gort M, Broekhuis M, Regts G. How teams use indicators for quality improvement- a multiple-case study on the use of multiple indicators on multidisciplinary cancer teams. Soc Sci Med. 2013;96:69–77.
66. Graham ID, Logan J, Harrison MB, Straus SE, Tetroe J, Casell W, Robinson N. Lost in knowledge translation: time for a map? J Contin Educ Health Prof. 2006;26:13–24.
67. Michie S, van Stralen MM, West R. The behaviour change wheel: a new method for characterising and designing behaviour change interventions. Implement Sci. 2011;6:42.
68. Cane J, O’Connor D, Michie S. Validation of the theoretical domains framework for use in behaviour change and implementation research. Implementation Sci. 2012;7(1):37.
69. Phillips CJ, Marshall AP, Chaves NJ, Jankelowitz SK, Lin IB, Loy CT, Rees G, Sakzewski L, Thomas S, To TP, Wilkinson SA, Michie S. Experiences of using the Theoretical Domains Framework across diverse clinical environments: a qualitative study. J Multidiscip Healthc. 2015;8:139–46.
70. Murray E, Treweek S, Pope C, MacFarlane A, Ballini L, Dowrick C, Finch T, Kennedy A, Mair F, O’Donnell C, Nio Ong B, Rapley T, Rogers A, May C. Normalisation process theory: a framework for developing, evaluating and implementing complex interventions. BMC Med. 2010;8:63.
71. Langley GJ, Moen RD, Nola KM, Noal TW, Norman CL, Provost LP. The improvement guide. 2nd ed. San Francisco: Jossey- Bass; 2009. 72. Berta W, Ginsburg L, Gilbart E, Lemieux-Charles L, Davis D. What, why, and
how care protocols are implemented in Ontario nursing homes. Can J Aging. 2013;32(1):73–85.
73. Holstein JA, Gubrium JF. The active interview. Thousand Oaks: Sage Publications; 1995.
74. Patton MQ. Qualitative research and evaluation methods. 3rd ed. Thousand Oaks: Sage Publication; 2002.
75. Miles MB, Huberman AM, Saldana J. Qualitative data analysis: a methods sourcebook. 3rd ed. Thousand Oaks: Sage Publishing; 2014.
76. Brennan SE, Bosch M, Buchan H, Greene SE. Measuring organizational and individual factors thought to influence the success of quality improvement in primary care: a systematic review of instruments. Implement Sci. 2012;7:121.
77. The Society of Thoracic Surgeons. Using Gait Speed to Measure Frailty. 2011. http://www.sts.org/news/using-gait-speed-measure-frailty. Accessed 1 Sept 2016.
78. Roberts HC, Denison HJ, Martin HJ, Patel HP, Syddall H, Cooper C, Sayer AA. A review of the measurement of grip strength in clinical and
epidemiological studies: towards a standardised approach. Age Ageing. 2011;40(4):423–9.
79. Nagi SZ. An epidemiology of disability among adults in the United States. Milbank Q. 1976;54:439–46.
80. Ware JE, Kosinski M, Turner-Bowker DM, Gandek B. How to score version 2 of the SF-12 health survey (with a supplement documenting version 1). QualityMetric Incorporated; 1995.
81. Ivers N, Jamtvedt G, Flottorp S, Young JM, Odgaard-Jensen J, French SD, O’Brien MA, Johansen M, Grimshaw J, Oxman AD. Audit and feedback: effects on professional practice and healthcare outcomes. Cochrane Database Syst Rev. 2012;6:CD000259.
82. Ivers NM, Sales A, Colquhoun H, Michie S, Roy R, Francis JJ, Grimshaw JM. No more‘business as usual’with audit and feedback interventions: towards an agenda for a reinvigorated intervention. Implement Sci. 2014;9:14.
83. The Boston Consulting Group. DICE®http://dice.bcg.com/index.html#intro. Accessed 1 Oct 2016.
• We accept pre-submission inquiries
• Our selector tool helps you to find the most relevant journal
• We provide round the clock customer support
• Convenient online submission
• Thorough peer review
• Inclusion in PubMed and all major indexing services
• Maximum visibility for your research
Submit your manuscript at www.biomedcentral.com/submit
![Fig. 1 The Integrated Nutrition Pathway for Acute Care [37]](https://thumb-us.123doks.com/thumbv2/123dok_us/9316026.1918881/3.595.57.540.86.451/fig-integrated-nutrition-pathway-acute-care.webp)