R E S E A R C H A R T I C L E
Open Access
Cardiac autonomic neuropathy in type 1
and type 2 diabetes patients
Anca Mo
ţăţă
ianu
1*, Smaranda Maier
1, Zoltan Bajko
1, Septimiu Voidazan
2, Rodica B
ă
la
ş
a
1and Adina Stoian
3Abstract
Background:Cardiac autonomic neuropathy (CAN) in diabetes is among the strongest risk markers for future global and cardiovascular mortality.The aim of this study was to analyse CAN prevalence and to compare the associations between CAN, the glycaemic control, cardiovascular risk factors, peripheral neuropathy, retinopathy and macroangiopathy in patients with type 1 (T1DM) and type 2 diabetes mellitus (T2DM).
Methods:One hundred ninety-five diabetic patients were included in this study. All patients were evaluated for detection of CAN (with standardised cardiovascular reflex tests), diabetes-related microvascular complications (polyneuropathy, retinopathy), common carotid artery intima-media thickness (IMT) and ankle-brachial index (ABI). Results:The prevalence of CAN was 39.1% in T2DM and 61.8% in T1DM patients. Multivariate logistic regression analysis demonstrated that in T2DM, the odds [OR (95% confidence intervals)] of CAN increased with diabetes duration [1.67(1.42–1.92)], HbA1c [1.74(1.34–2.27)], cholesterol [1.01(1.00–1.01)], triglycerides [1.01(0.99–1.00)], smoking [2.35(1.23– 4.49)], systolic blood pressure [1.01(1.00–1.03)], BMI [1.16(1.08–1.24)], glomerular filtration rate [0.91(0.88–0.93)],
peripheral neuropathy [25.94(11.04–44.25)], retinopathy [13.13(3.03–84.73)] and IMT [10.12 (7.21–15.32)]. In T1DM, the odds of CAN increased with diabetes duration [1.62(1.13–2.31)], HbA1c [4.49(1.27–15.9)], age of patients [1.14(1.03–1.27) ], glomerular filtration rate [0.94(0.89–0.99)], peripheral neuropathy [31.6(4.5–45.8)] and IMT [5.5(2.3–8.3)].
Conclusion:This study indicated that CAN is a more frequent complication in T1DM. Apart from glycaemic control, the existence of CAN is associated with potentially modifiable cardiovascular risk only in T2DM patients. The presence of other micro- and macrovascular complications increases the probability of having CAN in both types of DM (but more pronounced in T2DM).
Keywords:Cardiac autonomic neuropathy, Type 1 diabetes, Type 2 diabetes, Microvascular complication, Macrovascular complication, Cardiovascular risk factors, Glycaemic control
Background
Diabetes is a problem of major concern and has been characterised as the primary health care challenge of the twenty-first century. The prevalence of diabetes, along with its complications, has risen rapidly. Currently, type 2 diabetes mellitus (DM) is an epidemic development throughout the world. Data from the International Dia-betes Federation (IDF) show that in 2015 almost 5 million patients across the world died due to diabetes and its complications. The prevalence of type 1 diabetes mellitus (T1DM) shows a rapid increase as well as the rise of type 2 diabetes mellitus (T2DM) in younger patients [1].
Cardiac autonomic neuropathy (CAN) is one of the most overlooked of all serious complications of diabetes. Although silent in the earlier stages, it is a powerful pre-dictor of mortality risk in diabetic patients and is a major challenge for all physicians dealing with people suffering from diabetes. Patients with CAN have a five-fold increased risk of mortality due to a high-risk of cardiac arrhythmias, silent myocardial ischaemia and sudden death. The burden of DM is reflected not only in the increasing number of patients but also in the grow-ing number of premature deaths due to diabetes [2–4].
The purpose of this study was to evaluate the CAN characteristics in T1DM versus T2DM patients and to identify the relationship between CAN, cardiovascular risk factors (CVRF) and other microvascular and
* Correspondence:motataianuanca@gmail.com
1Department of Neurology, University of Medicine and Pharmacy Târgu
Mureş, Gh Marinescu 50, 540136 Târgu Mureş, Romania Full list of author information is available at the end of the article
macrovascular complications. Currently, more studies are required when considering the global increase of DM in order to improve the strategies for fresh CAN prevention.
Methods
This was a cross-sectional study in which 212 consecu-tive inpatients with T1DM and T2DM were selected among diabetic subjects who presented to the Diabetes Department of the TirguMures University Hospital (Romania). Exclusion criteria were as follows: presence of cardiac arrhythmia, heart blockage, clinical coronary artery disease, presence of thyroid disease, presence of hypo- or hyperglycaemia in the previous 24 h, presence of acute illness, severe systemic disease, medication that affects the autonomic nervous system (anti-arrhythmic medication, antidepressants, antihistamine and sym-pathomimetic cough preparations), alcohol abuse, use of neurotoxic medication or malignant disease, history of diabetic ketoacidosis and other secondary causes of dia-betes [3]. Based upon these exclusion criteria, 17 pa-tients were excluded from the study group. The majority of our patients were hospitalised for periodical control, not for acute comorbidities. This study protocol was ap-proved by the University of Medicine and Pharmacy Tirgu Mures Review Board, and all subjects gave their written informed consent.
Clinical examination was performed and stress on heart rate, systolic and diastolic blood pressure (SBP/DBP), body weight, waist circumference and body mass index (BMI) were recorded.Complete blood count and chemistry tests (including complete renal, hepatic and other metabolic testing panels) were collected in the morning after an overnight fast. Glycated haemoglobin (HbA1c) was deter-mined by high-performance liquid chromatography with a non-diabetic reference range of 4.1–6.0. Renal function was assessed by estimated glomerular filtration rate (eGFR), which was calculated using the Modification of Diet in Renal Disease study (MDRD) formula [5].
Diabetic retinopathy was evaluated by an experienced in-dependent ophthalmologist. Direct funduscopy was per-formed on dilated pupils, and the findings were classified as normal, pre-proliferative retinopathy (including maculopa-thy) or proliferative retinopathy. For statistical analysis, we considered those patients without retinopathy with normal funduscopy and pre-proliferative retinopathy, and patients with retinopathy with proliferative retinopathy.
Neuropathic symptoms were assessed based upon neuropathy symptom scores as previously described [6].
Peripheral nerve function was assessed using nerve conduction studies (NCS), by an electrodiagnostic proto-col as recommended by the American Diabetes Associ-ation [7]. For each patient, NCS were performed bilaterally on the median, ulnar, peroneal, tibial and sural
nerves according to standard techniques [8]. NCSs were performed with a four-channel electromyography (EMG) apparatus (Neuro-MEP-4, Russia) with surface elec-trodes. Reduced amplitudes in the motor or sensory re-sponses less than the normal limit (mean–2 standard deviations, SD) and slowness in the motor or sensory conduction velocity less than the normal limit (mean–2 SD) were identified as abnormal values [8]. When two or more nerves were abnormal, NCS were considered abnormal according to the Mayo Clinic staging criteria [9]. The patients were classified as having subclinical peripheral neuropathy in the absence of signs or symp-toms of neuropathy if they had abnormal NCS. They were classified as having confirmed peripheral neur-opathy in the presence of abnormal NCS and signs or symptoms of polyneuropathy (PNP), and they were con-sidered to have no PNP if NCS were normal with no symptoms or signs of neuropathy on clinical examin-ation [10].
Patients were requested to avoid strenuous physical exercise in the 24 h preceding the cardiovascular testing and to avoid smoking, eating or coffee consumption for at least 2 h prior to autonomic testing. All antidiabetic and other medications were administered at the end of the examination.
pressure of at least 10 mmHg, within 3 min of standing. The blood pressure measurement point while standing-was at heart level. Details of these assessments of cardio-vascular autonomic function have been previously described [3]. CAN was defined as the presence of at least two abnormal standard tests [10]. The patients were divided into two groups according to the presence or absence of CAN.
The common carotid artery intima-media thickness (IMT) was assessed using ultrasonography (Siemens Accuson Antares Ultrasound System) on both bilateral common carotid arteries with a linear array 5-mHz transducer as reported previously [14]. Scanning was performed at three different longitudinal projection sites (anterior-oblique, lateral and posterior-oblique). The IMT was measured at the thickest portion of the scan-ning area, and at two other points: 1 cm upstream and 1 cm downstream from the site of greatest thickness. The mean of these three IMT measurements was used as the individual’s IMT. We also evaluated the ankle-brachial index (ABI) with a handheld 5-mHz Dop-pler device (HI Dop Vascular DopDop-pler set) in all patients.
Statistical analyses
Statistical analyses were performed using MedCalc Soft-ware (Version 12.3.0 bvba, Mariakerke, Belgium). Data were considered as nominal or quantitative variables. Nominal variables were characterized using frequencies. Quantitative variables were tested for normality of distri-bution using Kolmogorov-Smirnov test and were charac-terized by median and range or by mean and standard deviation (SD), when appropriate. A chi-square test was used in order to compare the frequencies of nominal variables. Quantitative variables were compared using t test, Mann-Whitney test, when appropriate. Multivariate analysis was carried out using linear regressions. We used as dependent variable the CAN: CAN+ code 1 vs CAN- code 0. We used the Bonferroni correction in order to account for multiple comparisons. The level of statistical significance was set atp< 0.05.
Results
General characteristics of study patients
Baseline characteristics of the studied patients are shown in Table 1. At the time of the study, the patients with T2DM were older than those with T1DM and had a shorter duration of diabetes, but had better glycaemic control than the T1DM patients group as reflected by HbA1c levels. Despite the better glycaemic control in T2DM, the prevalence of hypertension, BMI, triglyceride levels and abdominal obesity reflected by waist-to-hip ratios were significantly higher in T2DM patients. The incipient macrovascular complications reflected by IMT were more evident in T2DM patients than in those with
T1DM, but the prevalence of the advanced microvascu-lar complications, clinical polyneuropathy and prolifera-tive retinopathy were significantly higher in T1DM patients.
Comparing the study patients with and without CAN Table2compares the diabetic patients with and without CAN between the T1DM and T2DM.
Of 34 patients with T1 DM, 21 (61.8%) were diagnosed with CAN. T1DM patients with CAN had a higher dur-ation of diabetes, poorer glycaemic control as indexed by HbA1c levels, a lowere GFR, a higher prevalence of clinical polyneuropathy and proliferative retinopathy and an increased IMT than patients without CAN.
Of 161 patients with T2DM, 63 (39.1%) were diag-nosed with CAN. Compared with T2DM patients with-out CAN, the T2DM patients with CAN were younger at the time of diabetes diagnosis and had a longer dur-ation of diabetes, poorer glycaemic control reflected by HbA1c levels, a significantly higher BMI, a significantly higher systolic blood pressure level, higher cholesterol levels and were more frequently smokers. The preva-lence of pre-proliferative retinopathy, proliferative retin-opathy and clinical polyneurretin-opathy were significantly higher in the group of T2DM patients with CAN than in those without CAN.
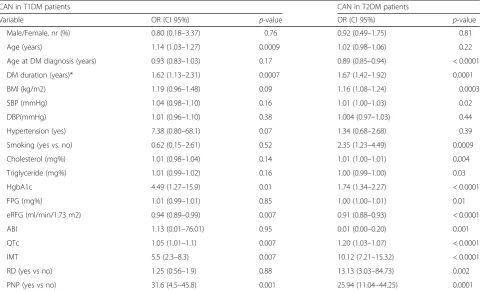
Logistic regression analysis
Univariate logistic regression analysis (Table3) was per-formed to identify determinants of CAN in both types of DM. In T2DM patients, the odds [OR (95% confidence intervals)] of CAN increased with age at diabetes diag-nosis, diabetes duration, BMI, smoking, systolic blood pressure, cholesterol level, triglyceride level, HbA1c level, increased IMT, existence of PNP and retinopathy.
For T1DM patients, the significant predictors for the ex-istence of CAN were age of patients, diabetes duration, HbA1c, peripheral neuropathy and IMT. The traditional CVRF (hypertension, obesity, smoking, dyslipidemia) had no effect on the risk of developing CAN in T1DM patients.
Discussion
different complications with disparate mechanisms. Glu-cose control in T1DM has a large effect on prevention of neuropathy, but in T2DM, glucose control has a small effect on the prevention of neuropathy [15].
In a recent study that evaluated long-term clinical out-comes and survival in young-onset T1DM compared
with T2DM at the same age at onset, the results estab-lished that the young-onset T2DM was the most lethal phenotype of diabetes because is associated with a greater mortality, more diabetic complications and un-favourable cardiovascular disease risk factors when com-pared to T1DM [16].
Table 1Baseline characteristics of studied patients
Variable DM type 1 DM type 2 pvalue
Patients number 34 161
Male/Female, nr (%) 12 (35.3)/22 (64.7) 76 (47.2)/85 (52.8) 0.20#
Age (years) 36.7 ± 9.5 58.1 ± 8.2 0.0001**
Age at diabetes diagnosis (years) 22.2 ± 7.5 49.8 ± 9.2 0.0001**
Diabetes duration (years) 14.5 (1–27) 6 (1–37) 0.0001*
Diabetes duration
< 5 years, nr (%) 4 (11.8) 61 (37.9) 0.01#
5–10 years, nr (%) 6 (17.6) 28 (17.4) 0.78#
11–15 years, nr (%) 10 (29.43) 54 (33.5) 0.54#
> 15 yers, nr (%) 14 (41.2) 18 (11.2) 0.001#
Body mass index (kg/m2) 22.6 ± 3.9 30.8 ± 5.3 0.001**
Systolic BP(mmHg) 123.6 ± 13.8 143.4 ± 19.6 0.001**
Diastolic BP (mmHg) 72.6 ± 10.4 81.4 ± 9.9 0.001**
Pulse pressure 51.8 ± 10.4 61.5 ± 16.1 0.001**
Hypertension (yes), nr (%) 9 (26.5) 106 (65.8) 0.001#
Ex-smokers, nr (%) 21 (61.8) 92 (57.1) 0.32#
Smokers (yes), nr (%) 13 (38.2) 69 (42.9) 0.42#
< 20 cigarettes/day, nr (%) 10 (71.4) 33(47.8) 0.38#
> 20 cigarettes/day, nr (%) 4 (28.6) 36 (52.2) 0.38#
Triglycerides (mg%) 142.0 (76–478) 178 (60–1100) 0.003*
HgbA1c 9.2 ± 1.3 8.3 ± 1.4 0.004**
FPG (mg%) 231.8 ± 63.5 183.9 ± 64.0 0.001**
eGFR (ml/min per 1.73 m2) 71.1 ± 24.7 75.6 ± 20.5 0.26**
PNP
Clinical, nr (%) 22 (64.7) 68 (42.2) 0.02#
Subclinical, nr (%) 0 (0.0) 46 (28.6) 0.005#
No PNP, nr (%) 12 (35.3) 44 (29.2) 0.78#
Retinopathy
Proliferative, nr (%) 8 (23.5) 10 (6.2) 0.002#
Preproliferative, nr (%) 12 (35.3) 49 (30.4) 0.82#
No retinopathy, nr (%) 14 (41.2) 102 (63.4) 0.001#
ABI* 1 (0.75–1.3) 0.95 (0.75–1.35) 0.32#
QTc 431.5 ± 37.2 426.4 ± 31.6 0.41**
IMT 0.76 ± 0.19 0.91 ± 0.19 0.001**
Waist to hip ratio 0.81 ± 0.02 0.90 ± 0.08 0.001**
Abdominal circumference 83.8 ± 9.9 104.6 ± 12.3 0.001**
Data were expressed as mean ± SD,−student t test**; median (range) - Mann Whitney test* and no (%) - chi square test#
In T1DM, there is clear evidence for genetic pre-disposition but also strong evidence for an auto-immune mechanism for destruction of the beta cells leading to absolute dependence on insulin treat-ment. Neurons and pancreatic beta cells have a neu-roectodermal origin and therefore share common
antigens, especially in the early stage of evolution. Granberg et al. [17] provided epidemiological data that support the implication of autoimmunity in autonomic neuropathy in T1DM by demonstrating the existence of antibodies against the autonomic nervous system (sympathetic ganglion, vagus nerve, Table 2Characteristics of the study patients according to the presence (CAN+) or absence of CAN (CAN−)
Variable DM type 1 DM type 2
CAN - CAN + pvalue CAN - CAN + pvalue
Nr (%) 13 (38.2) 21(61.8) 98 (60.9) 63 (39.1)
Male/Female, nr (%) 5(38.5)/8 (61.5) 7 (33.3)/14 (66.7) 0.76# 47 (48.0)/51 (52.0) 29 (46.0)/34 (54.0) 0.81#
Age (years) 30.8 ± 8.2 40.3 ± 8.5 0.003** 57.4 ± 8.5 59.1 ± 7.7 0.22**
Age at diabetes diagnosis (years) 24.4 ± 7.3 20.7 ± 7.4 0.16** 53.1 ± 8.6 45.0 ± 7.9 0.0001**
DM duration (years) 7 (1–11) 22 (6–27) 0.0001* 4 (1–15) 12 (5–37) 0.0001*
DM duration
< 5 years, nr (%) 4 (30.8) 0 (0.0) 0.02# 61 (62.2) 0 (0.0) 0.0001#
5–10 years nr (%) 8 (61.5) 2 (9.5) 0.04# 8 (8.2) 20 (31.7) 0.002#
11–15 years, nr (%) 1 (7.7) 5 (23.8) 0.52# 29 (29.6) 25 (39.7) 0.24#
> 15 years, nr (%) 0 (0.0) 14 (66.7) 0.001# 0 (0.0) 18 (28.6) 0.0001#
BMI (kg/m2) 21.1 ± 4.1 23.5 ± 3.5 0.08** 29.3 ± 4.9 33.2 ± 5.1 0.0001**
SBP (mmHg) 119.4 ± 11.3 126.3 ± 14.8 0.16** 140.6 ± 18.4 149.9 ± 20.7 0.01**
DBP (mmHg) 70.7 ± 7.2 73.9 ± 11.9 0.38** 80.9 ± 9.4 82.1 ± 10.7 0.44**
Pulse pressure 48.7 ± 8.2 53.8 ± 11.3 0.16** 59.5 ± 15.4 64.6 ± 16.5 0.04**
Hypertension (yes) 1 (7.7) 8 (38.1) 0.051# 62 (63.3) 44 (69.8) 0.39#
Nonsmokers 7 (53.8) 14 66.7) 0.45# 64 (65.3) 28 (44.4) 0.03#
Smokers 6 (46.2) 7 (33.3) 0.45# 34 (34.7) 35 (55.6) 0.02#
< 20cigarettes/day 5 (38.5) 5 (23.8) 0.5# 17 (17.3) 16 (25.4) 0.78#
> 20cigarettes/day 2 (15.4) 2 (9.5) 0.5# 17 (17.3) 19 (30.2) 0.54#
Triglycerides (mg%) 142 (76–188) 143 (78–478) 0.22* 154.5 (60–996.0) 204 (95–1100) 0.001*
Cholesterol (mg%) 170.5 ± 26.3 200.6 ± 68.3 0.14** 204.5 ± 29.1 228.7 ± 49.1 0.002**
HgbA1c 8.4 ± 0.72 9.6 ± 1.37 0.01** 7.9 ± 1.4 9.1 ± 1.2 0.001**
FPG (mg%) 229.2 ± 55.8 233.4 ± 69.2 0.85** 173.6 ± 68.2 199.7 ± 53.7 0.01**
eRFG 86.9 ± 17.4 60.7 ± 23.6 0.001** 85.6 ± 17.2 60.4 ± 14.6 0.0001**
PNP
Clinical 3 (23.1) 19 (90.5) 0.0001# 16 (17.5) 52 (82.5) 0.0001#
Subclinical 0 (0.0) 0 (0.0) – 40 (40.8) 6 (9.5) 0.0001#
No PNP 10 (76.9) 2 (9.5) 0.0001# 42 (42.9) 5 (7.9) 0.0001#
Retinopathy
Proliferative 0 (0.0) 8 (38.1) 0.003# 2 (2.0) 8 (12.7) 0.002#
Preproliferative 0 (0.0) 12 (57.2) 0.001# 12 (12.2) 37 (58.7) 0.0001#
No rethinopathy 13 (100.0) 1 (4.8) 0.001# 84 (85.7) 18 (28.6) 0.0001#
ABI 1.02 (0.91–1.1) 0.92 (0.75–1.3) 0.30* 1.01 (0.78–0.14) 0.86(0.75–1.35) 0.0001*
QTc 402.8 ± 33.4 449.2 ± 27.4 0.001** 412.7 ± 27.6 447.8 ± 25.1 0.0001**
IMT 0.60 ± 0.13 0.86 ± 0.16 0.001** 0.82 ± 0.17 1.03 ± 0.15 0.0001**
Data were expressed as mean ± SD,−student t test**; median (range) - Mann Whitney test* and no (%) - chi square test#
adrenal medulla) in T1DM patients with autonomic neuropathy.
In our study, poor glycaemic control and the long dur-ation of diabetes were the key risk factors for developing CAN in either T1DM or T2DM. We found that the pa-tients with T1DM have a longer duration of diabetes compared with T2DM patients (22 vs 12.5 years). This difference can be explained by the fact that the patients with T2DM often have a history of many years without symptoms during which blood glucose peaks occur un-noticed, but diabetes is not yet diagnosed and treated. So, in T2DM, the diabetes complications may exist at the time of initial presentation, but in T1DM, there is likely to be a window between initial diagnosis and the onset of organ damage [18].
Poor glycaemic control is a major risk factor for the development and progression of CAN in both types of DM. In our study, poor glycaemic control was associated with the increased risk of having CAN. This result sug-gests that glycaemic control is a more important driver of cardiac autonomic dysfunction in T1DM than in T2DM. Brownlee [19] demonstrated that the high blood glucose level in the past determined the risk for later diabetic complication. Due to the asymptomatic period in T2DM with inadequate control of hyperglycaemia be-fore the establishment of the diagnosis, further diabetic
complications will occur later despite the optimal gly-caemic control. This phenomenon is called ‘ hypergly-caemic or metabolic memory’, and it is responsible for the initial damage that occurs very early on, even before diabetes has been initially diagnosed. Because we evalu-ated glycaemic control by HbA1c levels, which reflects the average blood glucose level over the past 3 months, a possible explanation of the differences in OR between T1DM and T2DM patients could be not that our T2DM patients have better glycaemic control in the past 3 months, but a history of ‘silent’and untreated
hyper-glycaemia, which plays a major role in
hyperglycemia-induced late complications of T2DM. The Action to Control Cardiovascular Risk in Diabetes (ACCORD) study on 10,251 participants demonstrated that in the patients with T2DM and high cardiovascular risk or preexisting cardiovascular and microvascular damage, the mortality rate was increased in the arm re-ceiving intensive treatment with forced HbA1c reduc-tion. Also, the ACCORD study demonstrated that neuropathies (somatic and autonomic) are significant risk factors for cardiovascular disease, and this particular group of patients represents a high-risk group in which intensive glucose control should be well-balanced against the mortality risk [20, 21]. The basic approach for living with DM and having as few complications as Table 3Univariate linear regression analysis: ORs and 95% CIs for CAN in T1 DM and T2 DM patients
CAN in T1DM patients CAN in T2DM patients
Variable OR (CI 95%) p-value OR (CI 95%) p-value
Male/Female, nr (%) 0.80 (0.18–3.37) 0.76 0.92 (0.49–1.75) 0.81
Age (years) 1.14 (1.03–1.27) 0.0009 1.02 (0.98–1.06) 0.22
Age at DM diagnosis (years) 0.93 (0.83–1.03) 0.17 0.89 (0.85–0.94) < 0.0001
DM duration (years)* 1.62 (1.13–2.31) 0.0007 1.67 (1.42–1.92) 0.0001
BMI (kg/m2) 1.19 (0.96–1.48) 0.09 1.16 (1.08–1.24) 0.0003
SBP (mmHg) 1.04 (0.98–1.10) 0.16 1.01 (1.00–1.03) 0.02
DBP(mmHg) 1.01 (0.96–1.10) 0.38 1.004 (0.97–1.03) 0.44
Hypertension (yes) 7.38 (0.80–68.1) 0.07 1.34 (0.68–2.68) 0.39
Smoking (yes vs. no) 0.62 (0.15–2.61) 0.52 2.35 (1.23–4.49) 0.0009
Cholesterol (mg%) 1.01 (0.98–1.04) 0.14 1.01 (1.00–1.01) 0.004
Triglyceride (mg%) 1.01 (0.99–1.02) 0.16 1.00 (0.99–1.00) 0.03
HgbA1c 4.49 (1.27–15.9) 0.01 1.74 (1.34–2.27) < 0.0001
FPG (mg%) 1.01 (0.99–1.01) 0.85 1.00 (1.00–1.01) 0.01
eRFG (ml/min/1.73 m2) 0.94 (0.89–0.99) 0.007 0.91 (0.88–0.93) < 0.0001
ABI 1.13 (0.01–76.01) 0.95 0.01 (0.00–0.20) 0.001
QTc 1.05 (1.01–1.1) 0.007 1.20 (1.03–1.07) < 0.0001
IMT 5.5 (2.3–8.3) 0.007 10.12 (7.21–15.32) < 0.0001
RD (yes vs no) 1.25 (0.56–1.9) 0.88 13.13 (3.03–84.73) 0.002
PNP (yes vs no) 31.6 (4.5–45.8) 0.001 25.94 (11.04–44.25) 0.0001
possible is to start treatment immediately after onset of the diabetes with the purpose of achieving metabolic control as much as possible. The actual trend through-out the world is to restrict the prognostic perspective of diabetes to the HbA1c value, but this is not justified by the complex mechanism implicated in vascular compli-cations of DM.
In T1DM, two important epidemiological studies, Dia-betes Control and Complications Trial (DCCT) and Epi-demiology of Diabetes Interventions and Complications study (EDIC), demonstrated that early intensive gly-caemic control can decrease the incidence of CAN, and this protective effect persisted for more than 14 years after the end of the study despite the disappearance of intensive glycaemic control [22, 23]. In a recent Cochrane meta-analysis, it was demonstrated that en-hanced glucose control significantly prevents the devel-opment of clinical neuropathy only in T1DM [24].
In T2DM, the effect of glycaemic control was not so evi-dent. The United Kingdom Prospective Diabetes Study (UKPDS) on 3867 recently diagnosed T2DM patients demonstrated that at 10 years from inclusion in the study, there were no differences on developing neuropathy be-tween the group with intensive glycaemic control ver-susthe group with conventional glycaemic control, irrespective of other CVRF. In other studies that followed the UKPDS study (the VA Cooperative study, Duckworth study and Steno-2 study), intensive glycaemic control re-sulted in a small decrease in diabetic neuropathy inci-dence, suggesting that in T2DM, factors that are independent from glycaemic control are responsible for the damage of somatic and autonomic nervous system. In the Steno-2 study, there was clear evidence that intensive pharmacological treatment targeting hypertension, hyper-lipidemia and microalbuminuria combined with lifestyle changes (diet, smoking cessation and physical exercise) re-duced the risk of autonomic neuropathy over the course of almost 8 years of follow-up [25–28].
In the present study, we found that among T2DM pa-tients, the odds of CAN increased with the existence of traditional CVRF (hypertension, smoking, obesity, higher cholesterol level), but CVRF had no effect on cardiac autonomic dysfunction in T1DM patients. Smoking was associated with increased odds of CAN among T2DM patients in our study, but there was no significant associ-ation between smoking and CAN in T1DM patients. Al-though there are no data to explain the effect of smoking on autonomic function in T2DM patients, the studies performed on the non-diabetic population dem-onstrated that smoking is associated with autonomic dysfunction related to increased oxidative stress and in-creased inflammatory activity [29].
Our results confirm that in T2DM when CVRF are as-sociated with poor glycaemic control, the risk of
developing CAN increased. In order prevent or to slow the progression of CAN, improving glycaemic control, lifestyle changes and cardiovascular risk factor manage-ment are the mainstays of treatmanage-ment,but in T1DM pa-tients, our results are not in accordance with previous studies that demonstrated the associations between CAN and CVRF [30, 31]. This observed difference be-tween T1DM and T2DM patients can be explained by (a) implication of hyperglycaemia and autoimmune mechanisms in developing CAN in T1DM and of hyper-glycaemia and CVRF in developing CAN in T2DM or (b) because of the small number of T1DM patients in our study, which can be accepted as a limitation.
In the group of T1DM and T2DM patients, the risk for developing CAN increased in the presence of periph-eral neuropathy, retinopathy and accelerated atheroscler-osis (reflected by increased IMT and decreased ABI). These associations between cardiac autonomic dysfunc-tion and micro- and macrovascular complicadysfunc-tions were more evident in T2DM. Microvascular complications of DM share a common pathogenetic factor with athero-sclerosis represented by functional disturbances in the vascular endothelium induced by hyperglycaemia and in-creased oxidative stress. Endothelial dysfunction is
con-sidered to be an early stage and precursor of
atherosclerosis. Our results are consistent with previous data from Yokoyama and coworkers [32], who reported a positive relationship between diabetic neuropathy (in-cluding autonomic neuropathy), increased IMT and ar-terial stiffness assessed by brachial-ankle pulse wave velocity in T2DM patients. In previous DDCT and EDIC studies on T1DM patients, it was demonstrated that microvascular complication per se conferred an inde-pendent risk for macrovascular disease [33,34].
Conclusions
As the incidence of diabetes rises, so too does the require-ment for healthcare, and in order to prevent CAN in pa-tients with T1DM, we must focus on glycaemic control, but in T2DM we should focus not only on glycaemic control but also on improving adherence to cardiovascular risk fac-tor intervention. In T2DM patients, enhanced glycaemic control can delay development of CAN but increase the risk of severe hypoglycaemic episodes, which need to be taken into account when evaluating the risk/benefits ratio. There is a need for further studies to discover the optimal level of glycaemic control in order to reduce the develop-ment of CAN without increasing the risk of death.
Abbreviations
HbA1c: glycated haemoglobin; HRV: heart rate variability; IMT: intima-media thickness; MDRD: Modification of Diet in Renal Disease study; NCS: nerve conduction studies; PNP: polyneuropathy; QTc: corrected QT interval; SBP: systolic blood pressure; SD: standard deviations; T1DM: type 1 diabetes mellitus; T2DM: type 2 diabetes mellitus; UKPDS: The United Kingdom Prospective Diabetes
Funding
This study was supported by the internal research grant of UMF Tîrgu-Mureş 18/23.12.2014.
Availability of data and materials
The data generated during the current study are not publicly available due to the intellectual rights owned by the authors. They are available from the corresponding author on reasonable request.
Authors’contributions
AM, AS, RB designed the study. AM, SV, SM, ZB collected and analyzed the data. AM, ZB, SV, SM drafted and wrote the manuscript. RB, AS revised the manuscript critically for intellectual content. All authors read and approved the final version of the manuscript.
Competing interest
The authors declare that they have no competing interests.
Ethics approval and consent to participate
This study was conducted in accordance with the Declaration of Helsinki and was approved by the Institutional Review Board of Mures County Clinical Emergency Hospital (20/01.06.2012). The study participants agreed to participate in this study, and all of them provided written informed consent.
Consent for publication
A written consent form was obtained from all participants for potentially publishing their clinical data while protecting their personal information.
Publisher’s Note
Springer Nature remains neutral with regard to jurisdictional claims in published maps and institutional affiliations.
Author details
1
Department of Neurology, University of Medicine and Pharmacy Târgu Mureş, Gh Marinescu 50, 540136 Târgu Mureş, Romania.2Department of
Epidemiology, University of Medicine and Pharmacy Târgu Mureş, Târgu Mureş, Romania.3Department of Pathophysiology, University of Medicine
and Pharmacy Târgu Mureş, Târgu Mureş, Romania. Received: 2 November 2017 Accepted: 14 August 2018
References
1. Ogurtsova K, da Rocha Fernandes JD, Huang Y, Linnenkamp U, Guariguata L, Cho NH, et al. IDF diabetes atlas: global estimates for the prevalence of diabetes for 2015 and 2040. Diabetes Res Clin Pract. 2017;128:40–50. 2. Vinik AI, Erbas T, Casellini CM. Diabetic cardiac autonomic neuropathy,
inflammation and cardiovascular disease. J Diabetes Investig. 2013;4:4–18. 3. Vinik AI, Maser RE, Mitchell BD, et al. Diabetic autonomic neuropathy.
Diabetes Care. 2003;26:1553–79.
4. What PBR. Do we know and what we do not know about cardiovascular autonomic neuropathy in diabetes. J of Cardiovasc Trans Res. 2012;5:463–78. 5. Levey AS, Eckardt KU, Tsukamoto Y, Levin A, Coresh J, Rossert J, De Zeeuw
D, Hostetter TH, Lameire N, Eknoyan G. Definition and classification of chronic kidney disease: a position statement from kidney disease: improving global outcomes (KDIGO). Kidney Int. 2005;67:2089–100.
6. Meijer JW, Smit AJ, Sonderen EV, Groothoff JW, Eisma WH, Links TP. Symptom scoring systems to diagnose distal polyneuropathy in diabetes: the diabetic neuropathy symptom score. Diabet Med. 2002;19:962–5. 7. American Diabetes Association American Academy of Neurology.
Consensus statement: report and recommendations of the San Antonio conference on diabetic neuropathy. Diabetes Care. 1988;11:592–7.
8. Kimura J. Anatomy and physiology of the peripheral nerve. In: Kimura J, editor. Electrodiagnosis in diseases of the nerve and muscle:principles and practice. New York: OxfordUniversity Press; 2013. p. 47–73.
9. Dyck PJ. Detection, characterization, and staging of polyneuropathy: assessed in diabetics. Muscle Nerve. 1988;11:21–32.
10. Tesfaye S, Boulton AJ, Dyck PJ, Freeman R, Horowitz M, Kempler P, Lauria G, Malik RA, Spallone V, Vinik A, Bernardi L, Valensi P, Toronto Diabetic Neuropathy Expert Group. Diabetic neuropathies: update on definitions, diagnostic criteria, estimation of severity, and treatments. Diabetes Care. 2010;33:2285–93. 11. Ewing DJ, Martyn CN, Young RJ, Clarke BF. The value of cardiovascular autonomic
function tests: 10 years experience in diabetes. Diabetes Care. 1985;8:491–8. 12. Spallone V, Ziegler D, Freeman R, Bernardi L, Frontoni S, Pop-Busui R,
Stevens M, Kempler P, Hilsted J, Tesfaye S, Low P, Valensi P. On behalf of the Toronto consensus panel of diabetic neuropathy. Cardiovascular autonomic neuropathy in diabetes: clinical impact, assessment, diagnosis, and management. Diabetes Metab Res Rev. 2011;27:639–53.
13. Ziegler D, Laux G, Dannehl K, Spuler M, Muhlen H, Mayer P, Gries FA. Assessment of cardiovascular autonomic function: age-related normal ranges and reproducibility of spectral analysis, vector analysis, and standard tests of heart rate variation and blood pressure responses. Diabet Med. 1992;9:166–75.
14. Wendelhag I, Gustavsson T, Suurkula M, et al. Ultrasound measurement of wall thickness in the carotid artery: fundamental principles and description of computerized image analyzing system. Clin Physiol. 1991;11:565–77. 15. Callaghan BC, Hur J, Feldman EL. Diabetic neuropathy: one disease or two.
Curr Opin Neurol. 2012;25:536–41.
16. Constantino MI, Molyneaux L, Limacher-Gisler F, et al. Long-term complications and mortality in young-onset diabetes- type 2 is more hazardous and lethal than type 1 diabetes. Diabetes Care. 2013;36:3863–9. 17. Granberg V, Ejskjaer N, Peakman M, et al. Autoantibodies to autonomic
nerves associated with cardiac and peripheral autonomic neuropathy. Diabetes Care. 2005;28:1959–64.
18. Hammes HP. Diabetic nerve, vascular and organ damage from the pathogenetic key to new therapeutic approaches. In: Rett K, editor. Better chances for nerves and vessels. Stuttgart: Georg Thieme Verlag KG; 2011. p. 9–19.
19. Brownlee M. Diabetic complications: pathobiology of hyperglycemic damage and potential impact on treatment. In: Thornalley PJ, Kempler P, editors. Complications of diabetes mellitus: pathophysiology and pathogenetically-based treatment options. Stuttgart: Georg Thieme Verlag KG; 2009. p. 1–8.
20. Calles-Escandon J, Lovato LC, Simons-Morton DG, et al. Effect of intensive compared with standard glycemia treatment strategies on mortality by baseline subgroup characteristics: the action to control cardiovascular risk in diabetes (ACCORD) trial. Diabetes Care. 2010;33:721–7.
21. Pop-Busui R, Evans GW, Gerstein HC, et al. Effects of cardiac autonomic dysfunction on mortality risk in the action to control cardiovascular risk in diabetes (ACCORD) trial. Diabetes Care. 2010;33:1578–84.
22. DCCT Research Group. The effect of intensive diabetes therapy on measures of autonomic nervous system function in the diabetes control and complications trial (DCCT). Diabetologia. 1998;41:416–23.
23. Pop-Busui R, Low PA, Waberski BH, et al. Effects of prior intensive insulin therapy on cardiac autonomic nervous system function in type 1 diabetes mellitus: the diabetes control and complications trial/epidemiology of diabetes interventions and complications study (DCCT/EDIC). Circulation. 2009;119:2886–93.
24. Callaghan B, Littlle AA, Feldman EL, et al. Enhanced glucose control for preventing and treating diabetic neuropathy. Cochrane Database Syst Rev. 2012;6:CD007543.
25. UK Prospective Diabetes Study (UKPDS) Group. Intensive blood-glucose control with sulphonylureas or insulin compared with conventional treatment and risk of complication in patients with type 2 diabetes (UKPDS 33). Lancet. 1998;352:837–53.
26. Gaede P, Vedel P, Larsen GV, et al. Multifactorial intervention and cardiovascular disease in patients with type 2 diabetes. N Engl J Med. 2003; 348:383–93.
27. Azad N, Emanuele NV, Abraira C, et al. The effects of intensive glycemic control on neuropathy in the VA cooperative study on type II diabetes mellitus. J Diabetes Complicat. 1999;13:307–13.
29. Shinozaki N, Yuasa T, Takata S. Cigarette smoking augments sympathetic nerve activity in patients with coronary heart disease. Int Heart J. 2008;49:261–72. 30. Tesfaye S, Chaturvedi N, Eaton SE, et al. Vascular risk factors and diabetic
neuropathy. N Engl J Med. 2005;352:341–50.
31. Voulgari C, Psallas M, Kokkinos A. The association between cardiac autonomic neuropathy with metabolic and other factors in subjects with type 1 and type 2 diabetes. J Diabetes Complicat. 2011;25:159–67. 32. Yokoyama H, Yokota Y, Tada J, Kanno S. Diabetic neuropathy is closely
associated with arterial stiffening and thickness in type 2 diabetes. Diabet Med. 2007;24:1329–35.
33. Anonymus. Effect of intensive diabetes management on macrovascular events and risk factors in the diabetes control and complications trial. Am J Cardiol. 1995;75:894–903.