METHODOLOGY
Design of a comprehensive microfluidic
and microscopic toolbox for the ultra-wide
spatio-temporal study of plant protoplasts
development and physiology
Kaori Sakai
1,2, Florence Charlot
3,4, Thomas Le Saux
1, Sandrine Bonhomme
3,4, Fabien Nogué
3,4,
Jean‑Christophe Palauqui
3,4*and Jacques Fattaccioli
1,2*Abstract
Background: Plant protoplasts are basic plant cells units in which the pecto‑cellulosic cell wall has been removed, but the plasma membrane is intact. One of the main features of plant cells is their strong plasticity, and their propen‑ sity to regenerate an organism from a single cell. Methods and differentiation protocols used in plant physiology and biology usually involve macroscopic vessels and containers that make difficult, for example, to follow the fate of the same protoplast all along its full development cycle, but also to perform continuous studies of the influence of vari‑ ous gradients in this context. These limits have hampered the precise study of regeneration processes.
Results: Herein, we present the design of a comprehensive, physiologically relevant, easy‑to‑use and low‑cost microfluidic and microscopic setup for the monitoring of Physcomitrella patens (P. patens) growth and development on a long‑term basis. The experimental solution we developed is made of two parts (i) a microfluidic chip composed of a single layer of about a hundred flow‑through microfluidic traps for the immobilization of protoplasts, and (ii) a low‑cost, light‑controlled, custom‑made microscope allowing the continuous recording of the moss development in physiological conditions. We validated the experimental setup with three proofs of concepts: (i) the kinetic monitor‑ ing of first division steps and cell wall regeneration, (ii) the influence of the photoperiod on growth of the protone‑ mata, and (iii) finally the induction of leafy buds using a phytohormone, cytokinin.
Conclusions: We developed the design of a comprehensive, physiologically relevant, easy‑to‑use and low‑cost experimental setup for the study of P. patens development in a microfluidic environment. This setup allows imaging of
P. patens development at high resolution and over long time periods.
Keywords: Microfluidics, Physcomitrella patens, Regeneration, Development, Differentiation, Protoplasts, Spores, Microscopy
© The Author(s) 2019. This article is distributed under the terms of the Creative Commons Attribution 4.0 International License (http://creat iveco mmons .org/licen ses/by/4.0/), which permits unrestricted use, distribution, and reproduction in any medium, provided you give appropriate credit to the original author(s) and the source, provide a link to the Creative Commons license, and indicate if changes were made. The Creative Commons Public Domain Dedication waiver (http://creat iveco mmons .org/ publi cdoma in/zero/1.0/) applies to the data made available in this article, unless otherwise stated.
Open Access
*Correspondence: jean‑[email protected]; jacques. [email protected]
2 Institut Pierre‑Gilles de Gennes pour la Microfluidique, 75005 Paris, France3 INRA, Institut Jean‑Pierre Bourgin, Saclay Plant Sciences, Versailles, France
Background
Protoplasts are basic plant cells units [1] in which the pecto-cellulosic cell wall has been removed, but the plasma membrane is intact. These fragile entities can be isolated from various parts of the adult plant (leaves, etc.) using enzymatic treatments (pectinase, cellulase) [2]. The softness of the shallow protoplast membrane allows making genetic manipulation following the direct inser-tion of various molecules (DNA, etc.), objects (droplets, etc.), organelles (chloroplasts, mitochondria) or nuclei within the cell [1, 3]. In proper culture conditions, proto-plasts can dedifferentiate, divide, re-differentiate in vari-ous cell types, to finally lead to the regeneration of a full organism. Protoplasts are hence interesting models both in the perspective of single-cell and developmental stud-ies. However, culture methods and differentiation proto-cols used for plant physiology and plant biology usually involve macroscopic vessels and containers [4] that make difficult to follow the fate of the same protoplast all along its full development cycle in a continuous manner.
Thanks to their ability to recreate in vitro environments at the cellular level that mimic a tissue, and also observ-ing in real-time subcellular and cellular modifications that take place during growth or development, microflu-idic devices have been used as monitoring and culturing tools for insect embryos[5], mammalian [6], or bacterial cells [7]. In plant science however, few microdevices have been developed so far [8]. Among them, the vast majority of the literature deals with root or pollen tube immobili-zation and studies [9–16], and half a dozen only address the question of the manipulation and observation of pro-toplasts [17–23].
Among them, Ko et al. [23] developed a microchip for the trapping, the culture and the fusion of tobacco proto-plasts. Trapping takes place in a series of polydimethyl-siloxane (PDMS) posts acting as a filter and stopping protoplasts within a microchannel. In addition, Zaban et al. [21] developed a microfluidic system to impose chemical cues to regenerating protoplasts entrapped individually in an array of small PDMS wells, pinpointing the importance of the auxin gradient on the directional-ity of the cell wall regeneration. While these two studies were focused on the regeneration of protoplasts on short timescales, Bascom et al. [18] presented recently a micro-fluidic setup allowing the long-term culture of moss protoplasts in static culturing condition, i.e. in absence of flow inside the chamber. While controlled light con-ditions, such as photoperiodicity or energy flux, are a stringent constraint for the physiological development of protoplasts [24] in a laboratory environment, none of the solutions published so far provides satisfactory lightning solutions during the microscopic observations, probably because conventional microscopes are not easily usable
in plant-compatible illumination environmental setups. Understanding the cell fate during plant development thus necessitates the design of novel monitoring and observation techniques to address these questions.
Herein, we present the design of a comprehensive, physiologically relevant, easy-to-use and low-cost micro-fluidic and microscopic setup that takes into account all the above constraints related to plant growth and devel-opment studies and overcomes current experiment limi-tations. For the sake of demonstration, we used a simple plant model, the moss Physcomitrella patens (P. patens), which has the ability to easily regenerate individuals from isolated protoplasts [4, 25]. The experimental solu-tion we developed is made of two parts: (i) a microfluidic chip composed of a single layer of about a hundred flow-through microfluidic traps [26] that immobilize proto-plasts without hindering their development in a sterile and portable environment; (ii) a microscope inserted in a light-controlled incubator that allows a controlled illumination and the continuous recording of the devel-opment over time. After having given a detailed descrip-tion of experimental setup and the design radescrip-tionales, we validated it on three proofs of concepts characterized by different spatiotemporal scales: the kinetic monitoring of first division steps and cell wall regeneration, the influ-ence of the photoperiod on growth of the protonema, and finally the induction of leafy buds using a cytokinin as a well described phytohormone.
Results
Size distribution of P. patens protoplasts and spores
Starting from 1-week-old P. patens protonema, proto-plasts are isolated by enzymatic digestion with driselase, using protocols detailed in the Materials and Method sec-tion and in the Addisec-tional file 1. After digestion of the cell wall, protoplasts are very fragile and are hence suspended in an iso-osmotic 8.5 wt% mannitol solution. To remove undigested protonema and cellular debris, the suspen-sion is filtered using a set of sieves of decreasing sizes (80 µm, 40 µm). At the end of the isolation process, a rep-resentative picture of the suspension is shown in Fig. 1a. By microscopy and image analysis, we measured the size distribution of a typical protoplast suspension, shown in Fig. 1c. Protoplasts have a homogeneous size distribution characterized by an average size equal to 32 ± 5 µm. In parallel to protoplast isolation, we also measured the size distribution of P. patens spores shown in Fig. 1b. As com-pared to protoplasts, Fig. 1c shows that spores have the same average diameter but are more homogeneous in size.
Hydrodynamic traps design and microfluidic setup
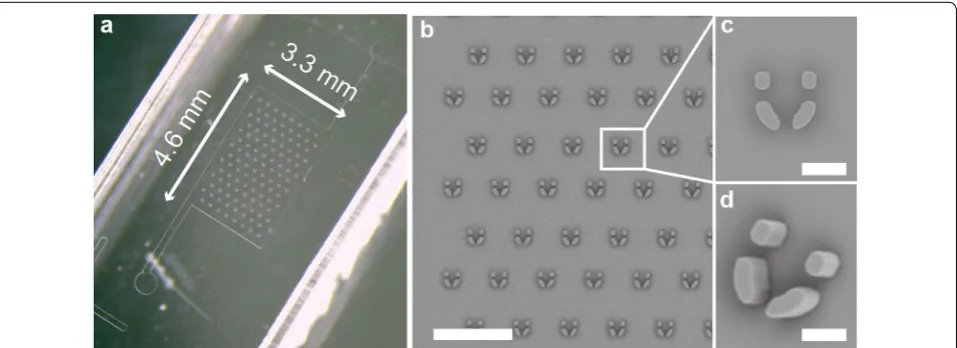
hydrodynamic flow-through traps (Fig. 2a). The height of the microfluidics chamber is set to 45 µm. Microchamber height and trap dimensions have been chosen in accord-ance with the size distribution of the protoplasts, with the general compromise to optimize immobilization and mechanical stability while avoiding a too strong confine-ment that could make loading difficult and eventually
alter protoplast development. Traps are U-shaped, and after several optimization steps, we designed them with a backside and two lateral opening to allow the culture medium flowing easily through the tiny structures, thus avoiding the existence of dead volumes; and to give free-dom to the developing protoplasts to grow.
Traps shown in Fig. 2 have an inner length of 60 µm, an inner width of 45 µm, a wall thickness of 20 µm, and opening widths equal to 15 µm (Fig. 2b, c). Microfluidic trap arrays are fabricated using soft-lithography tech-niques [27] detailed in the Materials and Methods sec-tion. After PDMS molding and creation of openings for tubing insertion, PDMS chips are bonded to glass-bot-tom Petri dishes, as shown in Fig. 2c, to ease manipu-lation and microscopic observation. To get a stable hydrophilic coating of the inner wall of the microchip and avoid trapping of air bubbles, microfluidic cham-bers are rinsed with an hydrophilic block-polymeric sur-factant solutions (0.2 wt% of Pluronic F68 in water) prior to the experiments.
Protoplast loading and immobilization
After membrane digestion and sieving, protoplasts are first diluted at the concentration of 105-106 mL−1 in an
iso-osmotic buffer made from PpNH4, 6.6 wt% of glu-cose and 0.5 wt% of mannitol. Then, they are inserted in a microtube connected to a computer-controlled pres-sure regulator. Protoplasts are injected in the micro-chamber using a pressure drop of 10-15 mbar during 2 to 3 min, low enough to avoid a strong shear rate of the protoplasts.
Fig. 1 Representative brightfield microscopy pictures of a
suspension of P. patens protoplasts (a) after digestion and purification, and (b) spores (c) Size distributions of protoplasts (Red) and spores (Blue) suspension. A gaussian fit of the size distributions gives a diameter of 32 ± 5 µm (Pooled data of 3 independent measurements with n = 130, 128 and 109 protoplasts) and 32 ± 2 µm respectively (Single measurement of a population of 56 spores). Scale bars: (a) 100 µm, (b) 100 µm
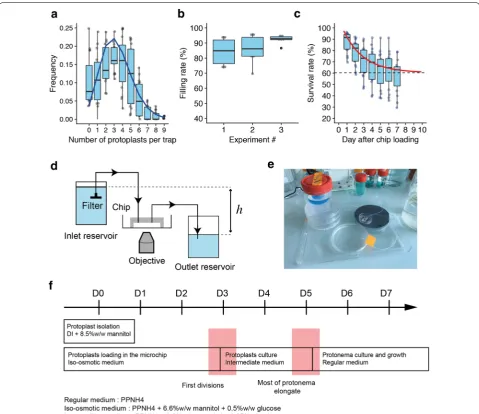
Figure 3a shows that each individual trap contains 1 to 5 protoplasts. Trap loading does not strictly follows a Poisson distribution since the presence of an immo-bilized protoplast in a trap modifies the flow-through hydrodynamic stream, hence decreasing the probability
to trap a second cell [28]. Figure 3b shows that for the same set of experiments, the filling rate, measured by counting the number of traps containing at least one protoplast, is close to 90%. Starting from these values, the trapping efficiency can be easily tuned by playing with the cell density and the time of loading.
Regeneration, growth and differentiation procedure
After protoplast loading in the microchip, the fluidic con-trol system is exchanged for a simpler and more trans-portable setup, based on a hydrostatic pressure difference between two reservoirs [29], as shown on the schematic view from Fig. 3d and the Fig. 3e photograph. The PDMS-on-glass chambers inlet is connected to an upstream source of medium reservoir, and the outlet is connected to a downstream waste disposal reservoir. Culture media are kept in large (100 mL) and sterile plastic containers that are used for several days in a continuous manner without external energy supply. After careful screening of some of the tubing available on the market, we chose to connect reservoirs and the chip using tubes made from a fluorinated polymer (PTFE), as they give best results in terms of contamination and bubble avoidance used sili-cone tubing (e.g. Tygon). The height difference between the culture media menisci in the inlet and outlet reser-voir is set to 4 cm, which corresponds to a flow rate of 0.36 mL h−1 (6 µL min−1).
Salts such as tartrates or mannitol both present at high concentration, both in PpNH4 medium at some stages of the experiment, tend to nucleate crystals [30] from the walls of the microchip. These crystals modify the hydro-dynamics resistance of the chip, degrade the microscopic image quality and can ultimately impede culture media flowing in through the chamber. We solved this issue by placing a 0.2 µm sterile filter connected to the inlet tub-ing and plungtub-ing into the inlet reservoir, as shown in Fig. 2d.
Survival rate of protoplasts in the microdevice
To allow a reproducible cell wall regeneration and then protoplasts division and growth, we optimized the cul-ture media exchange routine, as shown in Fig. 3f. Dur-ing the loadDur-ing step that takes place in the microchip and until the occurrence of the first cell divisions, protoplasts are maintained in an iso-osmotic medium made from PpNH4 medium supplemented with 6.6 wt% of mannitol and 0.5 wt% of glucose. Then, culture medium is replaced for ca. 2 days by a solution of PpNH4medium containing intermediate half concentrations of 3.3 wt% of mannitol and 0.25 wt% of glucose. Finally, when most of the pro-tonema have started their elongation process, the culture medium is definitely replaced by pure PpNH4 medium.
Following this routine and during the first week after loading and immobilization of protoplasts in the chip, we quantified their survival rate by manually identifying and counting the proportions of traps containing at least one living protoplast. The status of the protoplasts is assessed by regularly monitoring the integrity of their membrane and chloroplasts, and their ability to develop over time. Survival rate 2 days after chip loading is of the order of
80%, and stabilizes around 60% after 5 days of culture in the microfluidic device, as shown by the graph in Fig. 3c.
First divisions and cell wall regeneration
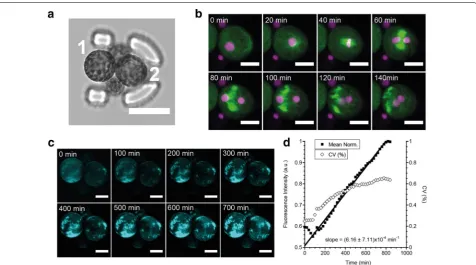
Reconstitution of the pecto-cellulosic cell wall of P. pat-ens protoplasts usually takes place during the first days after isolation and regeneration [31]. During that time, protoplasts are very fragile, which makes usually diffi-cult the observation of the first steps of the development. Using the discrete array of traps in the microfluidic setup, we are able to immobilize the protoplasts and keep them in a gentle flow of iso-osmotic medium without degra-dation of the observations conditions. Figure 4a shows a laser-scanning confocal microscopy image of a trap con-taining 4 H2B-mRFP/microtubules-GFP protoplasts and observed for 48 h after immobilization. Figure 4b and Additional file 2 show a time-lapse recording of the first cytokinesis event of one of the protoplasts at a 20 min temporal resolution. We see the formation of the mitotic spindle and nuclei division, thanks to the histone labeling (in purple). Using calcofluor-white, a non-specific fluo-rescent stain that binds strongly to structures containing cellulose [32], we followed the cell wall reconstitution as a function of time. Figure 4c and Additional file 3 show that for each protoplast, the intensity of the cell wall is spatially heterogeneous and increases over time. This observation is in accordance to former reports from the literature [24]. The average integrated intensity, shown in Fig. 4d, increases linearly with time, while the coeffi-cient of variation (CV), defined as the ratio of the stand-ard deviation to the mean, saturates on long time scales, thus indicating an spatial homogenization of the cell wall after ca. 10 h of experiment. Figure S1 shows that while protoplasts having experienced a long observation under a confocal microscope are unable to grow, protoplasts trapped in adjacent traps are growing normally with time.
In‑house microscope design
of large numerical aperture, ca. 60°, that makes illumina-tion homogeneous in the field of view without the need to use a conventional condenser. To immobilize the glass-bottom Petri dish containing the microchip, we designed a 3D-printed adaptor for the xy-stage. A temperature sensor is also connected to the Arduino board for the continuous recording of this parameter during the exper-iment. Figure S2 shows a representative evolution of the temperature over time inside the chamber. Temperature
varies according to the photoperiod in the 21.5 ± 1.5 °C range.
The flowchart of the recording routine is shown in Fig. 5c. To ease the experiments, we developed a graphi-cal user interface (Matlab) for the control of the LED intensity, the image timelapse parameters, and the recording of the pictures taken with the camera. Cur-rently, the microscope is built with a 10 × plan-corrected objective with a low numerical aperture and without any
Fig. 4 a Confocal image (transmission mode) of a trap containing four H2B‑mRFP/microtubules‑GFP protoplasts. Protoplasts #1 and #2 are in focus and labelled. Scalebar = 40 µm. b Confocal time‑lapse imaging of the first division event of the protoplast #2 (purple : H2B‑mRFP, green : microtubules‑GFP). The GFP channel is in maximum projection mode. Scalebar: 20 µm. c Confocal time‑lapse imaging of the cell wall reconstitution around the two protoplasts, using calcofluor‑white as a dye. Representation is shown in maximum projection mode. Scalebar: 20 µm. d Mean fluorescence intensity of protoplast 1 over time in the calcofluor‑white channel. CV is defined as the ratio of the standard deviation to the mean. The mean intensity increases linearly with time
(See figure on next page.)
Fig. 5 a Schematic representation of the in‑house microscope built for long‑term studies. The white illumination is provided by a white LED controlled with an Arduino micro‑controller. The LED is turned on intermittently for a short amount of time to allow the picture recording by the CMOS camera. The camera is controlled by a Matlab script and the Micro‑Manager software. The microscopic setup is encased in a box equipped with a LED tile on the ceiling, used to set the experimental photoperiod (night: 8 h, day: 16 h). The chamber temperature is recorded all along the experiment using a thermocouple sensing module. b Picture of the experimental setup during an experiment. c Flowchart of the movie recording and automatic frame tagging routine. The LED tile is used to impose the photoperiodic illumination of the sample. Within each day/ night cycle, τ represents the time increment between two pictures, and is usually equal to 10 min. tacq corresponds to exposure time of the camera
tube lens. The optical setup has a field of view sufficient to observe 1 to 3 developing plants. Our setup can work continuously for several weeks for a given sample with-out noticing any defocusing, nor any detrimental effect of the presence of the LED element on the plant growth and development. Figure 5d shows a time-lapse recording of
Influence of the light cycle on protonemal growth
Using the custom-made microscope, we monitored the influence of the photoperiod on the protonemal growth of immobilized protoplasts. 7 days after isolation and culture in the microsystem, microfluidic samples are inserted in the microscope and observed continuously for ca. 80 h with a temporal resolution of 10 min, either under a 16 h light/8 h darkness photoperiod or under continuous illumination (Additional file 4). Under a photoperiodic culture condition, Fig. 6a shows that the absence of light strongly decreases the tip elongation pro-cess, whereas growth restarts after a short lag-time when illumination takes place. Under continuous illumination
conditions, growth is globally constant, as shown in Fig. 6b. Growth rate in both conditions, measured during growing period, is of the order or 3 µm h−1.
Induction of leaf buds on chip using a phytohormone
As the last proof of concept of the microfluidic experi-mental environment presented in this work, we moni-tored the growth of leafy buds using the in-house microscope. Indeed, differentiation of P. patens caulo-nema to leafy buds can be induced at an early stage of development, one week after isolation and regeneration, by the addition of cytokinin [33–35], a phytohormone, to the culture medium. After 10 days of regeneration in the microfluidic chamber following the routine detailed in Fig. 3f, we proceeded to a change of the PpNH4 culture medium flowing in the microchip for a 3-benzyladenin (BA) [36] in PpNH4 solution (100 nM) for 96 h, before finally turning back to a pure PpHN4 medium. Figure 7 shows that the presence of BA induces the development of several buds from a filament over time. The resolu-tion of the microscope is sufficient to observe that cell divisions occur normally in the leafy buds, and also that neighboring chloronema stop their growth during the phyto-hormone induced differentiation, in accordance with existing literature [37].
Discussion
This work present the development of a comprehensive experimental setup based on microfluidic devices made from arrays of flow-through hydrodynamic traps. Th setup allows the long-term immobilization and regen-eration of moss protoplasts and spores. Individual traps have a size comparable to the diameter of the protoplasts, and the chamber is made from a single layer of PDMS molded on a SU8-on-silicon structure, While two-layer traps can often be more efficient for trapping efficiency and homogeneity [38], our design is more robust in terms of manipulation since after trapping, the microdevice can be moved easily from the incubators to the microscope
Fig. 6 a Kymograph of the protonema growth under a 16–8 photoperiod. b Kymograph of the protonema growth under a continuous illumination. Recording have started from day 7 after protoplasts isolation their subsequent immobilization in the microfluidic traps. Protonema growth staggers during night time. Scale: 10 h (time) and 100 µm (distance)
without any risk for the developing protoplasts to move away from the traps. In addition to moss protoplasts, we have also grown spores, as their dimensions are similar. Figure S3 shows that spores grow nicely in the chamber, although their analysis is beyond the scope of the present study.
Instead of using syringe pumps or pressure regulators for the long-term experiments, we instead chose to use a very simple hydrostatic fluidic system that makes the samples easily transportable, straightforward to be par-allelized at low cost, and less prone to contamination or sterility issues as all the elements are disposable or auto-clavable. The design of the custom microscope has been driven by simplicity, so it can be very easily replicated, and avoids having cumbersome z defocusing over long-term observations. Its footprint is small (6 × 6 cm), which makes it highly parallelizable, and at the date of the report, the microscope costs less than 1000€ (ca. 1100 US$) if we exclude the prices of the Matlab licence and the computer. As Arduino boards can be easily controlled by open-source softwares such as Python, the total cost can further be reduced if needed, at the expense of a modification of the control code and the GUI. This set up allows imaging of P. patens development at high resolu-tion and over long time periods.
Following this procedure, we were able to observe dif-ferent development stages of moss in controlled condi-tions with a minimum disturbance and maximum of survival rate. In our hand, we describe the first steps of cell wall regeneration and the first asymmetric division providing evidences that our immobilized system is suit-able for time-lapse imaging of dynamic processes. We validated our system by modifying culture conditions and monitor their impact on cell elongation or gameto-phores formation. This procedure ensures the systematic analysis of numerous cells, during a long period of time, providing a task force for further screenings and/or sta-tistical analysis. Drug or phytohormones flow-through assays can be easily achieved with the described micro-fluidic growth chambers and permit high-throughput pharmacological tests.
Conclusion
We developed the design of a comprehensive, physi-ologically relevant, easy-to-use and low-cost experi-mental setup for the study of P. patens development in a microfluidic environment. This setup allows imaging of
P. patens development at high resolution and over long time periods. In conjunction with the design of a cus-tom-made and open-source brightfield microscope, we believe the solution presented here can be applied to pro-toplasts of other plant species, and could allow address-ing biological questions more easily by simply allowaddress-ing
the real-time visualization or tracking of the growth and development of tissues over time.
Materials and methods
Detailed protocols are given in the Additional file 1 document.
Materials
Unless stated, all chemicals were purchased by Sigma-Aldrich (L’Isle d’Abeau, France) and were used as received. Antibiotics (vancomycin 50 mg L−1,
cefotax-ime 200 mg L−1) were used only for protonema culture
on solid medium. 3-benzyladenin (CAS# 7280-81-1) was used for leafy buds induction [36].
Microfluidic devices fabrication
For our experiments, we used two types of micro-chambers and trap arrays dimensions, detailed in the Additional file 1. The devices were made of PDMS (poly-dimethylsiloxane), using standard soft lithography tech-niques [27]. In brief, we fabricated SU-8 masters (SU-8 2050, Microchem) on silicon wafers using a Karl-Süss MJB4 mask aligner and a laser printed photomask (Selba, Switzerland). We then proceeded to PDMS molding (1:10 ratio, RTV 615, Momentive Performance Materials) and thermal curing at 70 °C for two hours. After cutting PDMS pieces and punching out inlets and outlets with a biopsy puncher, PDMS devices were bonded to a glass bottom Petri dishes (WPI Fluorodish P35-100) using an oxygen plasma (Cute Plasma, Korea). After sealing, microfluidic chambers were washed with a solution of 0.2 wt% Pluronic F127 in water and let overnight à 4 °C to make the microchannel surfaces hydrophilic.
Plant material and tissue collection
The Gransden wild-type strain of P. patens [39, 40] was used in this study. The H2b-mRFP/tubulin-GFP [41] was a kind gift from Pr G. Goshima. For the production of this line the human histone H2B-mRFP fusion gene, directed by the E7113 promoter [42], was integrated into the GFP-tubulin line GTU14 [43] from Pr M. Hasebe. Long term measurements of the influence of the light cycle on growth were done using Ppccd8 mutants [44].
Culturing protocols
Protonemal tissue was propagated on PpNO3 medium [45] supplemented with 2.7 mM NH4-tartrate. Cultures
of 16 h light/8 h darkness and a quantum irradiance of 100 µE m−2 s−1 (standard conditions).
Protoplasts isolation and purification
Isolated P. patens protoplast were obtained following established protocols [4, 25, 46, 47]. In brief, protoplasts were isolated from 6-days-old protonemal cultures by incubation for 30 min in 1 wt% driselase (Sigma-Aldrich, D8037) dissolved in a 8.5 wt% mannitol solution in water. The suspension was filtered successively through 80 μm and 40 μm stainless-steel sieves. Protoplasts were sedi-mented by low-speed centrifugation (300 g for 5 min at 20 °C) and washed 3 times in a 8.5 wt% mannitol olution in water. Isolated protoplasts were then diluted to cell concentration of 2.5 × 10⁵ cells per mL in an iso-osmotic medium (PpNH4 medium supplemented with 6.6 wt% d-mannitol and 0.5 wt% d-glucose) prior to loading in the microfluidic device.
Loading and regeneration in the microchip
To avoid cell and cell aggregates to stick on the sidewalls of the microtubes, we first incubate the microtubes for 10 min with a 0.2 wt% Pluronic F127 solution in water, and finally rinse them with the iso-osmotic medium described above. Then, 300 µL of fresh isolated proto-plasts are pipetted in a microtube connected to the sam-ple holder and the pressure regulator (Fluigent MFCS). Injection of the protoplasts and their subsequent immo-bilization took place in 3–5 min at a pressure drop of 10–15 mBar. After loading, fresh iso-osmotic medium is flown inside the microdevice for 3–5 min, before setting up large scale reservoirs and Teflon tubing used for long term culture conditions.
Cytological staining on chip
For the experiments reported in Fig. 4, the culture medium from the inlet sample container was exchanged for a culture medium containing cytological staining product.
Sample were continuously incubated under flow over-night in a calcofluor-white (0.5 µg mL−1 in PpNH4)
sup-plemented medium under culture conditions (at 24 °C, 16 h light/8 h darkness light regime) before proceeding to the confocal microscopy recordings.
Confocal and Electronic Microscopy
Confocal images were acquired with a confocal Leica TCS SP8 equipped 2 Hybrid Detectors, and a 40X/1.30NA oil immersion objective. Samples were illuminated sequen-tially with 3 lasers at 405 nm, 488 nm, 552 nm. Fluores-cence microscope images were obtained using a Leica DMi8 microscope. Electronic Microscopy images were captured with a Hitachi TM3030 table top microscope.
In‑house microscope imaging
Long term brightfield microscopy pictures were acquired with our custom made, in-house microscope and a 10 × (n.a. = 0.10) objective. The full description of the micro-scope is given in the Results section of the manuscript.
Programming, Image and data analysis
Image analysis was performed with the ImageJ/Fiji soft-ware [48]. Spores and protoplasts size distributions have been measured from brightfield pictures that were thres-holded, binarized, and characterized using the particle measurement tool of Fiji/ImageJ. Kymographs were built from protonema growth time-lapse recording using the Kymograph Builder tool built in the Fiji/Image J software. Data analysis was done using R (RStudio, http://www. rstud io.com/). Programming of the in-house microscope graphical user interface (GUI) was done with Mathworks Matlab and Micro-Manager [49] softwares.
Additional files
Additional file 1. Supplementary informations and detailed methods. Additional file 2: Movie S1. Time‑lapse confocal imaging of the division of a protoplast (purple: H2b‑mRFP, green: tubulin‑GFP). The GFP channel is shown in maximum projection mode.
Additional file 3: Movie S2. Time‑lapse confocal imaging of the cell wall regeneration (calcofluor white). The calcofluor channel is shown in maximum projection mode.
Additional file 4: Movie S3. Chloronemata growth under continuous illumination.
Abbreviations
P. patens: Physcomitrella patens; PTFE: polytetrafluoroethylene; PDMS: poly‑ dimethylsiloxane; LED: light‑emitting diode; CMOS: complementary metal oxide semiconductor; GUI: graphical user interface; BA: 3‑benzyladenin; CV: coefficient of variation.
Acknowledgements
We thank B. Dubreucq (IJPB, INRA, Versailles) for the technical advices regard‑ ing the illumination setup of the in‑house microscope. We thank the staff of the cleanroom of the Institut Pierre‑Gilles de Gennes for their help and sup‑ port all throughout the project.
Authors’ contributions
KS, JF, JCP and FN and designed the experiments, KS performed the experi‑ ments, JF and TLS designed the in‑house microscope, FC maintained P. patens culture, FN and SB provided the Ppccd8 mutant. All authors participated to the analysis of the data, have read and approved the final manuscript.
Funding
This work has received support of “Institut Pierre‑Gilles de Gennes” (Labora‑ toire d’excellence: ANR‑10‑LABX‑31 PSL, “Investissements d’avenir”: ANR‑10‑ IDEX‑0001‑02 PSL and Equipement d’excellence: ANR‑10‑EQPX‑34 PSL).
Availability of data and materials
microscope (references, manufacturers, suppliers, prices). Documents are available on https ://githu b.com/Fatta cciol iLab/Plant sOnCh ip.
Competing interests
No financial competing interests are to be declared.
Consent for publication
Not applicable.
Ethics approval and consent to participate
Not applicable.
Author details
1 PASTEUR, Département de Chimie, École Normale Supérieure, PSL University, Sorbonne Université, CNRS, 75005 Paris, France. 2 Institut Pierre‑Gilles de Gennes pour la Microfluidique, 75005 Paris, France. 3 INRA, Institut Jean‑Pierre Bourgin, Saclay Plant Sciences, Versailles, France. 4 AgroParisTech, Institut Jean‑ Pierre Bourgin, Saclay Plant Sciences, Versailles, France.
Received: 6 March 2019 Accepted: 6 July 2019
References
1. De Smet I, editor. Plant organogenesis. Humana Press; 2013.
2. Wiszniewska A. The influence of isolation stress on the (re) organization of cell walls in protoplasts of in vitro recalcitrant plants. BioTechnologia. 2012;93:102–8.
3. Reski R. Development, genetics and molecular biology of mosses. Bot Acta. 1998;111:1–15.
4. Cove DJ, Perroud P‑F, Charron AJ, McDaniel SF, Khandelwal A, Quatrano RS. Culturing the moss Physcomitrella patens. Cold Spring Harb Protoc. 2009. https ://doi.org/10.1101/pdb.prot5 136.
5. Levario TJ, Zhan M, Lim B, Shvartsman SY, Lu H. Microfluidic trap array for massively parallel imaging of Drosophila embryos. Nat Protoc. 2013;8:721–36.
6. Mehling M, Tay S. Microfluidic cell culture. Curr Opin Biotechnol. 2014;25:95–102.
7. Eland LE, Wipat A, Lee S, Park S, Wu LJ. Microfluidics for bacterial imaging. In: Methods in Microbiology. 2016. p. 69–111.
8. Sanati Nezhad A. Microfluidic platforms for plant cells studies. Lab Chip. 2014;:3262–74.
9. Bérut A, Chauvet H, Legué V, Moulia B, Pouliquen O, Forterre Y. Gravisen‑ sors in plant cells behave like an active granular liquid. Proc Natl Acad Sci. 2018;115:5123–8.
10. Park Y‑H, Lee N, Choi G, Park J‑K. Plant array chip for the germination and growth screening of Arabidopsis thaliana. Lab Chip. 2017.
11. Massalha H, Korenblum E, Malitsky S, Shapiro OH, Aharoni A. Live imaging of root–bacteria interactions in a microfluidics setup. Proc Natl Acad Sci. 2017;114:4549–54.
12. Park J, Kurihara D, Higashiyama T, Arata H. Fabrication of microcage arrays to fix plant ovules for long‑term live imaging and observation. Sens Actuators, B Chem. 2014;191:178–85.
13. Gooh K, Ueda M, Aruga K, Park J, Arata H, Higashiyama T, et al. Live‑cell imaging and optical manipulation of arabidopsis early embryogenesis. Dev Cell. 2015;34:242–51.
14. Grossmann G, Guo W‑J, Ehrhardt DW, Frommer WB, Sit RV, Quake SR, et al. The RootChip: an integrated microfluidic chip for plant science. Plant Cell. 2011;23:4234–40.
15. Meier M, Lucchetta EM, Ismagilov RF. Chemical stimulation of the Arabi‑ dopsis thaliana root using multi‑laminar flow on a microfluidic chip. Lab Chip. 2010;10:2147–53.
16. Kamimura Y, Tanaka H, Kobayashi Y, Shikanai T, Nishimura Y. Chloroplast nucleoids as a transformable network revealed by live imaging with a microfluidic device. Commun Biol. 2018;1:47.
17. Ju JII, Ko JM, Kim SH, Baek JY, Cha HC, Lee SH. Soft material‑based microculture system having air permeable cover sheet for the protoplast culture of Nicotiana tabacum. Bioprocess Biosyst Eng. 2006;29:163–8.
18. Bascom CS, Wu S‑Z, Nelson K, Oakey J, Bezanilla M. Long‑term growth of moss in microfluidic devices enables subcellular studies in development. Plant Physiol. 2016;172:28–37.
19. Schaap A, Dumon J, den Toonder J. Sorting algal cells by morphology in spiral microchannels using inertial microfluidics. Microfluid Nanofluidics. 2016;20:125.
20. Grasso MS, Lintilhac PM. Microbead encapsulation of living plant pro‑ toplasts: a new tool for the handling of single plant cells. Appl Plant Sci. 2016;4:1500140.
21. Zaban B, Liu W, Jiang X, Nick P. Plant cells use auxin efflux to explore geometry. Sci Rep. 2014;4:1–8.
22. Wu H, Liu W, Tu Q, Song N, Li L, Wang J, et al. Culture and chemical‑ induced fusion of tobacco mesophyll protoplasts in a microfluidic device. Microfluid Nanofluidics. 2011;10:867–76.
23. Ko JM, Ju J, Lee S, Cha HC. Tobacco protoplast culture in a polydimethylsi‑ loxane‑based microfluidic channel. Protoplasma. 2006;227:237–40. 24. Jenkins GI, Cove DJ. Light requirements for regeneration of protoplasts of
the moss Physcomitrella patens. Planta. 1983;157:39–45.
25. Cove DJ, Perroud P‑F, Charron AJ, McDaniel SF, Khandelwal A, Quatrano RS. The moss Physcomitrella patens: a novel model system for plant devel‑ opment and genomic studies. Cold Spring Harb Protoc. 2009. https ://doi. org/10.1101/pdb.emo11 5.
26. Karimi A, Yazdi S, Ardekani AM. Hydrodynamic mechanisms of cell and particle trapping in microfluidics. Biomicrofluidics. 2013;7:021501. 27. Xia Y, Whitesides GM. Soft Lithography. Angew Chemie Int Ed.
1998;37:550–75.
28. Di Carlo D, Wu LY, Lee LP. Dynamic single cell culture array. Lab Chip. 2006;6:1445–9.
29. Komeya M, Hayashi K, Nakamura H, Yamanaka H, Sanjo H, Kojima K, et al. Pumpless microfluidic system driven by hydrostatic pressure induces and maintains mouse spermatogenesis in vitro. Sci Rep. 2017;7:1–8. 30. Kelly FJ, Robinson RA, Stokes RH. The thermodynamics of the ternary
system mannitol‑sodium chloride‑water at 25° from solubility and vapor pressure measurements. J Phys Chem. 1961;65:1958–60.
31. Stumm I, Meyer Y, Abel WO. Regeneration of the moss Physcomitrella patens (hedw.) from isolated protoplasts. Plant Sci Lett. 1975;5:113–8. 32. Monheit JE, Cowan DF, Moore DG. Rapid detection of fungi in tissues using calcofluor white and fluorescence microscopy. Arch Pathol Lab Med. 1984;108:616–8.
33. Schulz P, Reski R, Maldiney R, Laloue M, Schwartzenberg KV. Kinetics of cytokinin production and bud formation in physcomitrella: analysis of wild type, a developmental mutant and two of its ipt Transgenics. J Plant Physiol. 2000;156:768–74.
34. Bopp M. The hormonal regulation of protonema development in mosses: II. The first steps of cytokinin action. Zeitschrift für Pflanzenphysiologie. 1984;113:435–44.
35. Decker EL, Frank W, Sarnighausen E, Reski R. Moss systems biology en route: phytohormones in Physcomitrella development. Plant Biol. 2006;8:397–406.
36. Brun F, Gonneau M, Laloue M, Nogué F. Identification of Physcomitrella patens genes specific of bud and gametophore formation. Plant Sci. 2003;165:1267–74.
37. Bonhomme S, Nogué F, Rameau C, Schaefer DG. Usefulness of Physcom-itrella patens for studying plant organogenesis. In: Methods in Molecular Biology. 2013. p. 21–43.
38. Skelley AM, Kirak O, Suh H, Jaenisch R, Voldman J. Microfluidic control of cell pairing and fusion. Nat Methods. 2009;6:147–52.
39. Ashton NW, Cove DJ. The isolation and preliminary characterisation of auxotrophic and analogue resistant mutants of the moss. Physcomitrella patens. MGG Mol Gen Genet. 1977;154:87–95.
40. Trouiller B. MSH2 is essential for the preservation of genome integrity and prevents homeologous recombination in the moss Physcomitrella patens. Nucleic Acids Res. 2006;34:232–42.
41. Nakaoka Y, Miki T, Fujioka R, Uehara R, Tomioka A, Obuse C, et al. An inducible RNA interference system in Physcomitrella patens reveals a dominant role of augmin in phragmoplast microtubule generation. Plant Cell. 2012;24:1478–93.
•fast, convenient online submission
•
thorough peer review by experienced researchers in your field
• rapid publication on acceptance
• support for research data, including large and complex data types
•
gold Open Access which fosters wider collaboration and increased citations maximum visibility for your research: over 100M website views per year
•
At BMC, research is always in progress.
Learn more biomedcentral.com/submissions
Ready to submit your research? Choose BMC and benefit from: 43. Hiwatashi Y, Obara M, Sato Y, Fujita T, Murata T, Hasebe M. Kinesins are
indispensable for interdigitation of phragmoplast microtubules in the moss Physcomitrella patens. Plant Cell. 2008;20:3094–106.
44. Proust H, Hoffmann B, Xie X, Yoneyama K, Schaefer DG, Yoneyama K, et al. Strigolactones regulate protonema branching and act as a quorum sensing‑like signal in the moss Physcomitrella patens. Development. 2011;138:1531–9.
45. Ashton NW, Grimsley NH, Cove DJ. Analysis of gametophytic develop‑ ment in the moss, Physcomitrella patens, using auxin and cytokinin resist‑ ant mutants. Planta. 1979;144:427–35.
46. Schaefer DG, Zrÿd JP. Efficient gene targeting in the moss Physcomitrella patens. Plant J. 1997;11:1195–206.
47. Cove DJ, Perroud P, Charron AJ, McDaniel SF, Khandelwal A, Quatrano RS. Isolation and regeneration of protoplasts of the moss Physcomitrella
patens. Cold Spring Harb Protoc. 2009. https ://doi.org/10.1101/pdb.prot5 140.
48. Schindelin J, Arganda‑Carreras I, Frise E, Kaynig V, Longair M, Pietzsch T, et al. Fiji: an open‑source platform for biological‑image analysis. Nat Methods. 2012;9:676–82.
49. Edelstein A, Amodaj N, Hoover K, Vale R, Stuurman N. Computer control of microscopes using µManager. Curr Protoc Mol Biol. 2010; Chapter 14 October:Unit14.20.
Publisher’s Note
![Fig. 3f, we proceeded to a change of the PpNH4 culture medium flowing in the microchip for a 3-benzyladenin (BA) [36] in PpNH4 solution (100 nM) for 96 h, before](https://thumb-us.123doks.com/thumbv2/123dok_us/9155457.1910662/8.595.56.292.273.485/proceeded-change-culture-medium-flowing-microchip-benzyladenin-solution.webp)
