R E S E A R C H
Open Access
Impact of dyslipidemia on 24-h urine
composition in adults without urolithiasis
Chao Cai
1,2,3†, Zanlin Mai
1,2,3†, Tuo Deng
1,2,3†, Zhijian Zhao
1,2,3, Wei Zhu
1,2,3, Yaoan Wen
1,2,3, Xiaolu Duan
1,2,3,
Wenqi Wu
1,2,3and Guohua Zeng
1,2,3*Abstract
Purposes:To evaluate the influence of dyslipidemia on 24-h urine composition in adults who were non-stone formers (NF).
Methods:Samples for 24-h urine composition were analyzed from 584 NF adults without urolithiasis in a national six-city-based epidemiologic study. The samples were divided into groups based on total cholesterol (TC),
triglycerides (TG), high-density lipoprotein (HDL), and low-density lipoprotein (LDL). The groups were compared based on demographic data and each component of 24-h urinalysis.
Results:The numbers of participants in high TG, high TC, high LDL, and low HDL were 106, 175, 147, and 59, respectively. The high TG group had increased urinary excretions of oxalate [mean difference (MD) = 0.032 mmol, 95% confidence interval (CI): 0.000–0.065] and potassium (MD = 4.298 mmol, 95%CI: 0.182–8.414). Increased urinary excretion of calcium (MD = 0.531 mmol, 95%CI: 0.061–1.001), sodium (MD = 41.561 mmol, 95%CI: 9.179–73.942), and chloride (MD = 45.209 mmol, 95%CI: 12.118–78.299) were found in the high TC group. Interestingly, the high LDL group had a decreased urinary excretion of calcium (MD =−0.573 mmol, 95%CI: -1.048 to−0.097), oxalate (MD =−0.038 mmol, 95%CI: -0.07 to−0.006), sodium (MD =−53.285 mmol, 95%CI: -85.823 to−20.748), and chloride (MD =−55.809 mmol, 95%CI: -89.035 to−22.583). Increased urinary excretions of citrate (MD = 0.455 mmol, 95%CI: 0.076–0.835) and magnesium (MD = 0.697 mmol, 95%CI: 0.244–1.149) were found in the low HDL group.
Conclusions:The present study first investigated the effects of dyslipidemia on 24-h urinalysis in NF adults. Of note, high LDL and low HDL were found to be adversely related to kidney stone formation. However, people with high TG and high TC should be cautious of getting kidney stones.
Keywords:Dyslipidemia, 24-h urine composition, Non-stone formers, Effects
Introduction
Nephrolithiasis is becoming increasingly common
worldwide [1,2]. Interestingly, the rate of dyslipidemia is also increasing in developed countries and developing areas such as China [2]. Nephrolithiasis is a metabolic disease, and dyslipidemia has been demonstrated to be an independent risk factor for urinary stone formation and recurrence [3, 4]. The concerning underlying
mech-anisms were reported to be insulin resistance,
inflammation, and oxidative stress [3]. These internal environment disturbances together cause urinary litho-genic changes, including hypercalciuria, hyperuricosuria, hyperoxaluria, and hypocitraturia [3]. Therefore, lipid profiles, which are composed of total cholesterol
(TC), triglycerides (TG), high-density lipoprotein
(HDL), and low-density lipoprotein (LDL), are sup-posed to be associated with the levels of physico-chemical elements in urine.
Changes in 24-h urine composition are markedly re-lated to urinary stone formation. Moreover, 24-h urine composition analysis is a good approach to detect urine physicochemical elements. In a large cohort with nephrolithiasis, Torricelli and his colleagues found that lipid profiles were significantly associated with urinary
* Correspondence:gzgyzgh@vip.sina.com
†Chao Cai, Zanlin Mai and Tuo Deng contributed equally to this work.
1Department of Urology, Minimally Invasive Surgery Center, The First
Affiliated Hospital of Guangzhou Medical University, Guangzhou, China
2Guangzhou Institute of Urology, Guangzhou, China
Full list of author information is available at the end of the article
composition changes. High TC indicated a higher urin-ary potassium and calcium, whereas low HDL or high triglyceride levels correlated with an elevated urine so-dium, oxalate, and uric acid, as well as a lower urine pH [5]. However, in the setting of a non-stone forming (NF) population, the correlation between dyslipidemia and 24-h urine composition was never reported. To clarify this issue, this study was conducted to evaluate the influ-ence of dyslipidemia on 24-h urine composition in adults without urolithiasis.
Material and methods
Study population
From May 2013 to July 2014, our group conducted a nation-wide epidemiologic study of urolithiasis among adults aged 18 years and older in China. A total of 584 Chinese adults without urolithiasis in six cities (Shanghai, Chongqing, Har-bin, Shaoyang, Lanzhou, and Changzhi) were included in this study. These six cities are located in traditional geo-graphical regions of China (south central, southwest, east, north, northeast, and northwest). This study was approved by the Ethics Committee of the First Affiliated Hospital of Guangzhou Medical University, China. Written informed consent was obtained from all the participants.
As shown in the Fig. 1, the individuals without
nephrolithiasis who underwent at least a single 24-h urine composition analysis and a single fasting lipid pro-file evaluation were included. Study exclusion criteria were subjects with incomplete urine samples (men: urine creatinine < 800 mg/24 h; women: urine creatin-ine < 600 mg/24 h), serum creatincreatin-ine greater than
133 μmol/L, urinary stone, urinary tract infection,
gout, gastroenteric diseases, enterectomy history, a history of dyslipidemia or receiving a statin, prescription of specific individualized dietary intervention or medical therapy (except for general fluid or dietary modifications), or a history of taking thiazide, allopurinol, vitamin supple-ments, potassium citrate, or calcium supplements during the past 2 weeks. All eligible participants with a free diet received ultrasonographic urinary tract examinations and questionnaires to collect the basic characteristic informa-tion [e.g., age, gender, body mass index (BMI), health his-tory]. The estimated creatinine clearance rate (eCCr) was calculated by the Cockcroft-Gault equation.
Collection and analysis of 24-h urine
The detailed methods of the collection and analysis of 24-h urine samples have been described in our previous
study [6]. A kit containing all the necessary supplies for the collection was sent to each participant. Clean poly-ethylene containers with prestored toluene were used to collect urine samples. One 24-h urine sample was col-lected from each person. All participants maintained their fluid intake and normal diet during the collection.
The urine was analyzed within 72 h after collection. The main measurement outcomes of 24-h urine analysis included urine volume, pH value, and concentration of urine sodium, potassium, chloride, calcium, phosphate, uric acid, magnesium, oxalate, and citrate. Urine citrate and oxalate were measured with ion exchange chroma-tography (Metrohm, Switzerland). Urine potassium, so-dium, calcium, chloride, creatinine, and phosphate were determined by Unicel DxC 600 synchronic biochemical detecting system. Urine uric acid and magnesium were measured by Beckman coulter AU680 automatic bio-chemistry analyzer. Urine cystine was quantified with Thermo Scientific Microplate Reader. pH values were measured with a glass electrode in a calibrated pH meter (Mettler Toledo, Switzerland). In addition, the ion activ-ity products of calcium oxalate and calcium phosphate,
expressed in terms of AP (CaOx) indexs and AP (CaP)
indexs were also calculated in our study [7]. The 24-h urine analyses were performed in the Guangdong Key
Laboratory of Urology according to standardized
protocols.
AP CaOxð Þindexes¼ 1:9Calcium
0:84Oxalate
Calcium0:22Magnesium0:121:51:03
AP CaPð Þindexes¼
2:710−3Calcium1:07
Phospate0:70ð7:0−4:5Þ6:8 Citrate0:201:51:31
Measurement and definition of variables
Fasting blood samples were taken from patients to meas-ure their plasma lipid profiles. The samples from differ-ent cities were measured with the same analyzer and reagent kits. According to the National Cholesterol Education Program (Adult Treatment Panel III guide-lines), dyslipidemia was defined as follows: hyperchol-esterolemia (TC > 200 mg/dL), hypertriglyceridemia (TG > 150 mg/dL), low HDL cholesterolemia (HDL-C < 40 mg/dL in men and < 50 mg/dL in women), or high-LDL cholesterolemia (LDL cholesterol > 130 mg/dL).
Statistical analysis
Serum lipid levels were analyzed as dichotomous (dyslip-idemia vs normal) to evaluate their effect on 24-h urine composition. The baseline characteristics and 24-h urine composition of the dyslipidemia group (any abnormality in the lipid profile: hypercholesterolemia, hypertriglyc-eridemia, low HDL-C or high LDL-C) were compared
with their corresponding normal group, respectively.
Student’s t-test was used on continuous variables and
chi-squared for categorical variables. Univariable com-parisons of urinary components between dyslipidemia
group and normal group were conducted with Student’s
t-test. The multivariate logistic regression was performed to access the independent impact of all possible factors in baseline characteristics comparisons between
dyslipid-emia group and normal group. A two-sided P value <
0.05 was considered significant for all results in this study. All statistical analyses were conducted by the SPSS 17.0 software.
Results
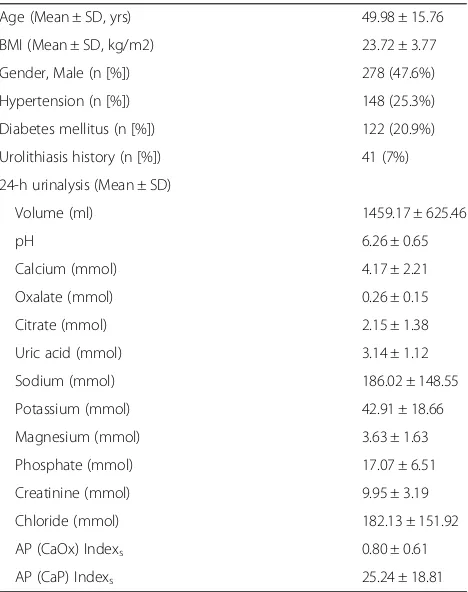
The demographic data and 24-h urine composition of the included adults are listed in Table 1. A total of 584 NF adults (47.6% men) was included. The mean age was 49.98 ± 15.76 years, and the mean BMI was 23.72 ± 3.77. There were 148 (25.3%), 122 (20.9%), and 41 (7%) adults with a history of hypertension, diabetes mellitus, and urolithiasis, respectively.
As shown in Table 2, high TG (> 1.7 mmol/L) was
more frequently seen in older (53.82 vs. 49.12,p= 0.001) and higher BMI (25.30 vs. 23.37, p< 0.001) adults. High TG participants also had a higher proportion of
individ-uals with hypertension (37.7% vs. 22.6%, p= 0.001) and
Table 1Demographic data and 24-h urine composition in 584 adults
Age (Mean ± SD, yrs) 49.98 ± 15.76 BMI (Mean ± SD, kg/m2) 23.72 ± 3.77 Gender, Male (n [%]) 278 (47.6%) Hypertension (n [%]) 148 (25.3%) Diabetes mellitus (n [%]) 122 (20.9%) Urolithiasis history (n [%]) 41 (7%) 24-h urinalysis (Mean ± SD)
Volume (ml) 1459.17 ± 625.46
pH 6.26 ± 0.65
Calcium (mmol) 4.17 ± 2.21
Oxalate (mmol) 0.26 ± 0.15
Citrate (mmol) 2.15 ± 1.38
Uric acid (mmol) 3.14 ± 1.12
Sodium (mmol) 186.02 ± 148.55
Potassium (mmol) 42.91 ± 18.66
Magnesium (mmol) 3.63 ± 1.63
Phosphate (mmol) 17.07 ± 6.51
Creatinine (mmol) 9.95 ± 3.19
Chloride (mmol) 182.13 ± 151.92
AP (CaOx) Indexs 0.80 ± 0.61
diabetes mellitus (34% vs. 18%, p< 0.001). The partici-pants in the high TC group (> 5.17 mmol/L) were older
than those on the normal group (56.34 vs. 47.25, p<
0.001). The high TC group had a higher proportion of
individuals with hypertension (34.3% vs. 21.5%, p=
0.001), diabetes mellitus (30.9% vs. 16.6%,p< 0.001), and a history of urolithiasis (11.4% vs. 5.1%, p= 0.006). The serum levels of eCCr, calcium, and uric acid were increased in the high TC group. In the high LDL group (> 3.12 mmol/L), the individuals had an older mean age (55.58 ± 15.46 vs. 48.09 ± 15.43, p< 0.001) and a higher BMI (25.30 ± 3.26 vs. 23.37 ± 3.78,p< 0.001). The partic-ipants with high LDL were more likely to have
hyperten-sion (36.1% vs. 21.7%, p= 0.001) and diabetes mellitus
(34% vs. 16.5%, p< 0.001). The participants with low HDL (< 0.91 mmol/L) had a younger mean age (39.56 ±
13.34 vs. 51.15 ± 15.59, p< 0.001) and a higher BMI
(25.45 ± 5.16 vs. 23.53 ± 3.53,p= 0.007).
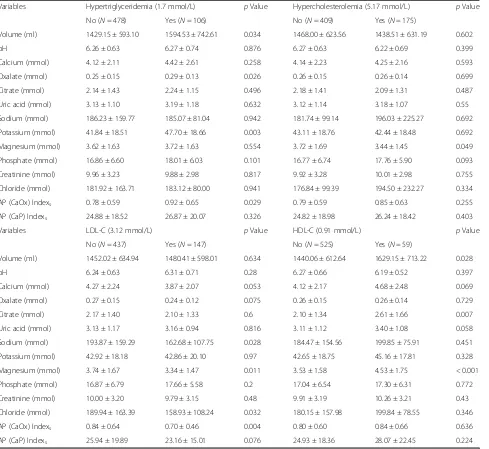
Table3 shows the influences of dyslipidemic status on 24-h urinalysis data. In the high TG group, the volume of urine was greater than that of the normal group
(1594.53 ± 742.61 vs. 1429.15 ± 593.10, p= 0.034). The
levels of oxalate (0.29 ± 0.13 vs. 0.25 ± 0.15, p= 0.026),
potassium (47.70 ± 18.66 vs. 41.84 ± 18.51, p= 0.003),
and AP (CaOx) index (0.92 ± 0.65 vs. 0.78 ± 0.59, p=
0.029) were higher in the high TG group. In the high TC group, the individuals were more likely to have lower
levels of magnesium (3.44 ± 1.45 vs. 3.72 ± 1.69, p=
Table 2Demographic data by serum TG, TC, HDL and LDL
Variables Hypertriglyceridemia (1.7 mmol/L) pValue Hypercholesterolemia (5.17 mmol/L) pValue No (N= 478) Yes (N= 106) No (N= 409) Yes (N= 175)
Age (year) 49.12 ± 16.33 53.82 ± 12.20 0.001 47.25 ± 15.89 56.34 ± 13.48 < 0.001 BMI (kg/m2) 23.37 ± 3.78 25.30 ± 3.26 < 0.001 23.68 ± 3.92 23.81 ± 3.39 0.706 Gender, Male (n [%]) 239 (50%) 39 (36.8%) 0.14 196 (47.9%) 82 (46.9%) 0.813 Hypertension (n [%]) 108 (22.6%) 40 (37.7%) 0.001 88 (21.5%) 60 (34.3%) 0.001 Diabetes mellitus (n [%]) 86 (18%) 36 (34%) < 0.001 68 (16.6%) 54 (30.9%) < 0.001 Urolithiasis history (n [%]) 35 (7.3%) 6 (5.7%) 0.545 21 (5.1%) 20 (11.4%) 0.006 Hyperuricemia (n [%]) 33 (6.9%) 9 (7.2%) 0.567 26 (6.4%) 16 (9.1%) 0.233 Hemoglobin (g/L) 139.72 ± 17.04 139.06 ± 16.23 0.715 139.06 ± 17.55 140.86 ± 15.19 0.239 Serum creatinine (μmol/L) 73.35 ± 17.14 69.91 ± 16.70 0.061 73.34 ± 17.42 71.26 ± 16.28 0.178 eCCr (ml/min) 89.33 ± 30.52 93.67 ± 30.56 0.187 92.48 ± 30.88 84.60 ± 29.10 0.004 Serum calcium (mmol/L) 2.38 ± 0.13 2.41 ± 0.17 0.119 2.37 ± 0.14 2.42 ± 0.13 < 0.001 Serum sodium (mmol/L) 140.25 ± 2.77 140.05 ± 2.44 0.504 140.25 ± 2.91 140.13 ± 2.20 0.574 Serum potassium (mmol/L) 4.14 ± 0.49 4.18 ± 0.43 0.427 4.15 ± 0.49 4.14 ± 0.44 0.765 Serum uric acid (μmol/L) 290.69 ± 82.70 307.67 ± 84.59 0.057 285.71 ± 82.23 312.61 ± 82.74 < 0.001
Variables LDL-C (3.12 mmol/L) pValue HDL-C (0.91 mmol/L) pValue
No (N= 437) Yes (N= 147) No (N= 525) Yes (N= 59)
0.049). The high LDL group had lower levels of sodium (162.68 ± 107.75 vs. 193.87 ± 159.29, p= 0.028),
magne-sium (3.34 ± 1.47 vs. 3.74 ± 1.67, p= 0.011), chloride
(158.93 ± 108.24 vs. 189.94 ± 163.39, p= 0.032), and AP (CaOx) index (0.70 ± 0.46 vs. 0.84 ± 0.64, p= 0.004) than the normal group. Interestingly, citrate and magnesium in the urine are inhibitors for renal stone formation. However, our study showed that the levels of 24-h cit-rate (2.61 ± 1.66 vs. 2.10 ± 1.34, p= 0.007) and magne-sium (4.53 ± 1.75 vs. 3.53 ± 1.58, p< 0.001) in the urine were increased in the low HDL group.
Then, multivariate logistic regression was performed to assess the independent impact of dyslipidemic status on 24-h urine composition considering the confounding
factors including age, sex, BMI, hypertension, and dia-betes mellitus. Moreover, the members of the lipid pro-files were also considered to be confounding factors. For example, if there were differences in terms of the levels of TC, LDL, or HDL between the high TG and normal groups, the status of TC, LDL, or HDL would be consid-ered as a confounding factor when evaluating the inde-pendent impact of TG on 24-h urine composition. As
shown in Table4, the high TG status had an
independ-ent impact on the increased urinary volume and urinary excretion of oxalate, potassium, and AP (CaOx) index. The high TC status had an independent influence on the increased urinary excretion of calcium, sodium, chloride, AP (CaOx) index, and AP (CaP) index. Of note, the high
Table 3The influence of dyslipidemic status on 24-h urinalysis data
Variables Hypertriglyceridemia (1.7 mmol/L) pValue Hypercholesterolemia (5.17 mmol/L) pValue No (N= 478) Yes (N= 106) No (N= 409) Yes (N= 175)
Volume (ml) 1429.15 ± 593.10 1594.53 ± 742.61 0.034 1468.00 ± 623.56 1438.51 ± 631.19 0.602
pH 6.26 ± 0.63 6.27 ± 0.74 0.876 6.27 ± 0.63 6.22 ± 0.69 0.399
Calcium (mmol) 4.12 ± 2.11 4.42 ± 2.61 0.258 4.14 ± 2.23 4.25 ± 2.16 0.593 Oxalate (mmol) 0.25 ± 0.15 0.29 ± 0.13 0.026 0.26 ± 0.15 0.26 ± 0.14 0.699 Citrate (mmol) 2.14 ± 1.43 2.24 ± 1.15 0.496 2.18 ± 1.41 2.09 ± 1.31 0.487 Uric acid (mmol) 3.13 ± 1.10 3.19 ± 1.18 0.632 3.12 ± 1.14 3.18 ± 1.07 0.55 Sodium (mmol) 186.23 ± 159.77 185.07 ± 81.04 0.942 181.74 ± 99.14 196.03 ± 225.27 0.692 Potassium (mmol) 41.84 ± 18.51 47.70 ± 18.66 0.003 43.11 ± 18.76 42.44 ± 18.48 0.692 Magnesium (mmol) 3.62 ± 1.63 3.72 ± 1.63 0.554 3.72 ± 1.69 3.44 ± 1.45 0.049 Phosphate (mmol) 16.86 ± 6.60 18.01 ± 6.03 0.101 16.77 ± 6.74 17.76 ± 5.90 0.093 Creatinine (mmol) 9.96 ± 3.23 9.88 ± 2.98 0.817 9.92 ± 3.28 10.01 ± 2.98 0.755 Chloride (mmol) 181.92 ± 163.71 183.12 ± 80.00 0.941 176.84 ± 99.39 194.50 ± 232.27 0.334 AP (CaOx) Indexs 0.78 ± 0.59 0.92 ± 0.65 0.029 0.79 ± 0.59 0.85 ± 0.63 0.255
AP (CaP) Indexs 24.88 ± 18.52 26.87 ± 20.07 0.326 24.82 ± 18.98 26.24 ± 18.42 0.403
Variables LDL-C (3.12 mmol/L) pValue HDL-C (0.91 mmol/L) pValue
No (N= 437) Yes (N= 147) No (N= 525) Yes (N= 59)
Volume (ml) 1452.02 ± 634.94 1480.41 ± 598.01 0.634 1440.06 ± 612.64 1629.15 ± 713.22 0.028
pH 6.24 ± 0.63 6.31 ± 0.71 0.28 6.27 ± 0.66 6.19 ± 0.52 0.397
Calcium (mmol) 4.27 ± 2.24 3.87 ± 2.07 0.053 4.12 ± 2.17 4.68 ± 2.48 0.069 Oxalate (mmol) 0.27 ± 0.15 0.24 ± 0.12 0.075 0.26 ± 0.15 0.26 ± 0.14 0.729 Citrate (mmol) 2.17 ± 1.40 2.10 ± 1.33 0.6 2.10 ± 1.34 2.61 ± 1.66 0.007 Uric acid (mmol) 3.13 ± 1.17 3.16 ± 0.94 0.816 3.11 ± 1.12 3.40 ± 1.08 0.058 Sodium (mmol) 193.87 ± 159.29 162.68 ± 107.75 0.028 184.47 ± 154.56 199.85 ± 75.91 0.451 Potassium (mmol) 42.92 ± 18.18 42.86 ± 20.10 0.97 42.65 ± 18.75 45.16 ± 17.81 0.328 Magnesium (mmol) 3.74 ± 1.67 3.34 ± 1.47 0.011 3.53 ± 1.58 4.53 ± 1.75 < 0.001 Phosphate (mmol) 16.87 ± 6.79 17.66 ± 5.58 0.2 17.04 ± 6.54 17.30 ± 6.31 0.772 Creatinine (mmol) 10.00 ± 3.20 9.79 ± 3.15 0.48 9.91 ± 3.19 10.26 ± 3.21 0.43 Chloride (mmol) 189.94 ± 163.39 158.93 ± 108.24 0.032 180.15 ± 157.98 199.84 ± 78.55 0.346 AP (CaOx) Indexs 0.84 ± 0.64 0.70 ± 0.46 0.004 0.80 ± 0.60 0.84 ± 0.66 0.636
LDL status had an independent effect on the decreased urinary excretion of calcium, oxalate, sodium, chloride, AP (CaOx) index, and AP (CaP) index. The low HDL status had an independent impact on the increased urin-ary excretion of citrate and magnesium, as well as de-creased urinary excretion of creatinine.
Discussion
The pathophysiology of nephrolithiasis is multifactorial. The components of metabolic syndrome (MetS) includ-ing obesity, hypertension, dyslipidemia, and diabetes
were risk factors for stone formation [8–11]. Dyslipid-emia has been widely accepted to be an independent risk factor for renal stone formation and recurrence [4, 12]. Insulin resistance, inflammation, and oxidative stress were hypothesized to be the mechanism. These internal environment disturbances together cause urinary litho-genic changes, including hypercalciuria, hyperuricosuria, hyperoxaluria, and hypocitraturia [3]. Analysis with 24-h urine composition is a good approach to detect urine physicochemical elements. In the SF patients, dyslipid-emia could cause significant changes in the 24-h urine
Table 4Multivariate adjusted differences in 24-h urinary excretion between dyslipidemia and normal adults
Hypertriglyceridemia (1.7 mmol/L) pValue Hypercholesterolemia (5.17 mmol/L) pValue
Difference 95%CI Difference 95%CI
Volume (ml) 188.361 (49.294, 327.429) 0.008 −77.317 (−213.049, 58.416) 0.264
pH 0.013 (−0.132, 0.158) 0.861 −0.091 (−0.232, 0.051) 0.208
Calcium (mmol) 0.337 (−0.146, 0.821) 0.171 0.531 (0.061, 1.001) 0.027 Oxalate (mmol) 0.032 (0.000, 0.065) 0.05 0.014 (−0.017, 0.045) 0.379 Citrate (mmol) −0.103 (−0.402, 0.196) 0.498 0.071 (−0.216, 0.358) 0.627 Uric acid (mmol) 0.048 (−0.195, 0.291) 0.697 0.176 (−0.058, 0.411) 0.14 Sodium (mmol) −11.21 (−44.326, 21.906) 0.506 41.561 (9.179, 73.942) 0.012 Potassium (mmol) 4.298 (0.182, 8.414) 0.041 −2.398 (−6.416, 1.620) 0.242 Magnesium (mmol) 0.103 (−0.254,0.461) 0.571 0.004 (−0.342, 0.349) 0.984 Phosphate (mmol) 0.703 (−0.72, 2.125) 0.332 0.615 (−0.76, 1.991) 0.38 Creatinine (mmol) 0.293 (−0.293, 0.879) 0.326 0.475 (−0.087, 1.037) 0.097 Chloride (mmol) −9.534 (−43.371, 24.303) 0.58 45.209 (12.118, 78.299) 0.007 AP (CaOx) Indexs 0.146 (0.012, 0.279) 0.032 0.155 (0.025, 0.284) 0.019
AP (CaP) Indexs 2.418 (−1.666, 6.502) 0.245 4.2 (0.21, 8.189) 0.039
LDL-C (3.12 mmol/L) pValue HDL-C (0.91 mmol/L) pValue
Difference 95%CI Difference 95%CI
Volume (ml) 38.165 (−82.456, 158.787) 0.445 127.322 (−49.633, 304.276) 0.158
pH 0.123 (−0.02, 0.265) 0.092 −0.082 (−0.267, 0.103) 0.384
Calcium (mmol) −0.573 (−1.048,−0.097) 0.018 0.161 (−0.455, 0.778) 0.607 Oxalate (mmol) −0.038 (−0.07,−0.006) 0.019 −0.249 (−0.046, 0.036) 0.804 Citrate (mmol) −0.093 (−0.387, 0.201) 0.534 0.455 (0.076, 0.835) 0.019 Uric acid (mmol) 0.017 (−0.221, 0.256) 0.886 0.065 (−0.245, 0.374) 0.681 Sodium (mmol) −53.285 (−-85.823,−20.748) 0.001 15.46 (−26.733, 57.653) 0.472 Potassium (mmol) −0.706 (−4.758, 3.347) 0.732 1.942 (−3.303, 7.186) 0.467 Magnesium (mmol) −0.033 (−0.68, 0.021) 0.066 0.697 (0.244, 1.149) 0.003 Phosphate (mmol) 0.329 (−1.083, 1.742) 0.647 −0.819 (−2.612, 0.973) 0.37 Creatinine (mmol) −0.057 (−0.632, 0.519) 0.847 −0.904 (−1.647,−0.161) 0.017 Chloride (mmol) −55.809 (−89.035,−22.583) 0.001 23.066 (−20.023, 66.155) 0.294 AP (CaOx) Indexs −0.237 (−0.368,−0.106) < 0.001 −0.053 (−0.223, 0.117) 0.543
AP (CaP) Indexs −4.236 (−8.258,−0.214) 0.039 −0.363 (−5.569, 4.843) 0.891
composition [5]. However, in the setting of the NF popu-lation, the correlation between dyslipidemia and 24-h urine composition was never reported. Our present study included 584 NF participants from a nationwide epidemiologic study in six cities and for the first time re-ported the effects of dyslipidemia on 24-h urine compos-ition in adults without urolithiasis. Specifically, high TG and TC caused increased urinary excretion of lithogenic components, such as oxalate, calcium, potassium, so-dium, chloride, AP (CaOx) index, and AP (CaP) index. Interestingly, high LDL decreased the urinary excretion of lithogenic components such as calcium, sodium, chloride, AP (CaOx) index, and AP (CaP) index. Low HDL increased the urinary excretion of protective
fac-tors for stone formation including citrate and
magnesium.
High TG was reported to cause high urinary calcium, sodium, uric acid, magnesium, and potassium excretions in SF patients [4, 5]. In the present study, we showed that high TG had higher urinary oxalate, potassium, and AP (CaOx) index in the NF population. The new finding in this study was that high TG caused high urinary
oxal-ate excretion. Table 2 shows that the patients with
in-creased TG had higher BMI (P< 0.001), which suggested that increased oxalate accumulation might be caused by obesity. Recently, Khashayar Sakhaee uncovered the mechanisms of obesity-induced hyperoxaluria. The po-tential pathophysiologic mechanisms of obesity-induced hyperoxaluria might be as follows [13–16]: (a) increased intake of oxalate and increased oxalate intestinal absorp-tion daily; (b) obese subjects had decreased number of Oxalobacter formigenes, which could degrade intestinal luminal oxalate and stimulate intestinal oxalate secre-tion; (c) increased intestinal and circulating proinflam-matory cytokines in obese subjects inhibits intestinal oxalate secretion mediated by the anion exchange trans-porter Slc26a6 (A6). These potential mechanisms could explain why increased TG cause increased oxalate accu-mulation. SF patients with high TG level were shown to more likely to have stone recurrence and had a shorter
stone recurrence-free period [4]. Andrew J et al.
followed the participants without urolithiasis and found by multivariable analysis that the median TG levels of people who formed kidney stones were higher than that of people who did not form kidney stones [17]. Our re-sults implied that NF populations with high TG might form kidney stones more readily due to more urinary oxalate and potassium excretion.
The univariable analysis results demonstrated that high TC caused increased urinary magnesium excretion. However, multivariate logistic regression analysis did not show a significant difference in terms of urinary magne-sium. Instead, multivariate logistic regression analysis showed that high TC could cause increased excretion of
urinary calcium, sodium, chloride, AP (CaOx) indexes, and AP (CaP) Indexes. High TC was reported to be cor-related with high urinary calcium in SF patients [5]. This relation was also suggested in animal studies [18]. The present study first reported that high TC had a link to high urinary sodium, chloride, AP (CaOx) indexes, and AP (CaP) indexes. The present results also demonstrate that people with high TC should pay attention to kidney stone formation.
Therefore, for the people with high TG and high TC, they should be cautious of getting kidney stones. Statin intake and regular exercise had a protective effect against stone formation [19]. Individual components of serum lipids (TC, TG, LDL cholesterol, HDL choles-terol) were reported to be adversely associated with urinary stone risk. Kang et al. found that in SF patients, high TG and low HDL were associated with increased risk for urinary stones, whereas high TC and high LDL were associated with reduced risk of urinary stones [20]. In the NF population, our results also indicated that contrary to the lithogenic urinary changes of high TG and high TC, high LDL caused decreased lithogenic component excretion including calcium, oxalate, so-dium, chloride, AP (CaOx) indexes, AP (CaP) indexes, and low HDL caused increased stone formation inhibi-tors such as citrate and magnesium. Our findings con-cerning the effects of LDL on 24-h urinary components were similar to the previous studies. High LDL seemed to lower the risk of stones [20]. However, the effects of HDL on 24-h urinary components was different from the existing findings. HDL was shown to have protective anti-inflammatory effects and protect against insulin
re-sistance [21]. Low levels of HDL were reported to
in-crease the nephrolithiasis risk [20, 22]. Moreover, the underlying physiologic mechanism explaining why indi-vidual components of dyslipidemia have a contradictory effect on lithogenic urinary changes cannot be explained at present. For the population without urolithiasis, the latest study including the participants with a first re-corded diagnosis of hyperlipidemia also got a conflicting result. During the follow-up, they found that the partici-pants who developed kidney stones had a lower level TC or LDL and higher HDL. However, they confirmed that higher TG was associated with an increased risk of kid-ney stones [17].
different among the included cities, and the numbers of people with dyslipidemia in our study are relatively small. All these factors may cause potential bias to our results.
Conclusion
The present study for the first time investigated the ef-fects of dyslipidemia on 24-h urinalysis in adults without urolithiasis. Of note, high LDL and low HDL were found to be adversely related to kidney stone formation. How-ever, according to our results, people with high TG and high TC should be cautious of getting kidney stones.
Abbreviations
BMI:Body mass index; CI: Confidence interval; eCCr: Creatinine clearance rate; HDL: High density lipoprotein; LDL: Low-density lipoprotein; MD: Mean difference; NF: Non-stone formers; TC: Total cholesterol; TG: Triglycerides
Acknowledgements
We thank the staffs of the Department of Urology in six centers for their helps with collecting and dealing with the 24-h urine of the non-stone formers.
Funding
This work was financed by grants from the National Natural Science Foundation of China (81602541, 81670643, 81402430), the Collaborative Innovation Project of Guangzhou Education Bureau (NO. 1201620011), the Guangzhou Science Technology and Innovation Commission (No. 201604020001 and No. 201704020193), the Science and Technology Planning Project of Guangdong Province (No.2017B030314108) and Natural Science Foundation of Guangdong Province (2016A030310276).
Availability of data and materials
The datasets used and/or analyzed in the present study are available from the corresponding author on reasonable request.
Authors’contributions
GZ Project development, ZM, TD, WZ Data collection, YW, XD Data management, CC, ZZ Data analysis, CC Manuscript writing, WW Manuscript editing. All authors read and approved the final manuscript.
Ethics approval and consent to participate
All procedures performed in studies involving human participants were in accordance with the ethical standards of the institutional and/or national research committee and with the 1964 Helsinki declaration and its later amendments or comparable ethical standards.
Informed consent was obtained from all individual participants included in the study.
Consent for publication
Not applicable.
Competing interests
The authors declare that they have no competing interests.
Publisher’s Note
Springer Nature remains neutral with regard to jurisdictional claims in published maps and institutional affiliations.
Author details
1
Department of Urology, Minimally Invasive Surgery Center, The First Affiliated Hospital of Guangzhou Medical University, Guangzhou, China.
2Guangzhou Institute of Urology, Guangzhou, China.3Guangdong Key
Laboratory of Urology, Guangzhou, China.
Received: 26 August 2018 Accepted: 23 October 2018
References
1. Neisius A, Preminger GM. Stones in 2012: epidemiology, prevention and redefining therapeutic standards. Nat Rev Urol. 2013;10(2):75–7.
2. Zeng G, Mai Z, Xia S, Wang Z, Zhang K, et al. Prevalence of kidney stones in China: an ultrasonography based cross-sectional study. BJU Int. 2017;120(1): 109–16.
3. Kohjimoto Y, Sasaki Y, Iguchi M, Matsumura N, Inagaki T, Hara I. Association of metabolic syndrome traits and severity of kidney stones: results from a nationwide survey on urolithiasis in Japan. Am J Kidney Dis. 2013;61:923–9. 4. Kang HW, Seo SP, Kim WT, Kim YJ, Yun SJ, et al. Hypertriglyceridemia is
associated with increased risk for stone recurrence in patients with urolithiasis. Urology. 2014;84(4):766–71.
5. Torricelli FC, De SK, Gebreselassie S, Li I, Sarkissian C, Monga M. Dyslipidemia and kidney stone risk. J Urol. 2014;191(3):667–72.
6. Zhu W, Mai Z, Qin J, Duan X, Liu Y, et al. Difference in 24-hour urine composition between diabetic and non-diabetic adults without nephrolithiasis. PLoS One. 2016;11:e0150006.
7. Tiselius HG. Medical evaluation of nephrolithiasis. Endocrinol Metab Clin N Am. 2002;31:1031–50.
8. Thomas G, Sehgal AR, Kashyap SR, Srinivas TR, Kirwan JP, Navaneethan SD. Metabolic syndrome and kidney disease: a systematic review and meta-analysis. Clin J Am Soc Nephrol. 2011;6(10):2364–73.
9. West B, Luke A, Durazo-Arvizu RA, Cao G, Shoham D, Kramer H. Metabolic syndrome and self-reported history of kidney stones: the National Health and Nutrition Examination Survey (NHANES III) 1988-1994. Am J Kidney Dis. 2008;51(5):741–7.
10. Jeong IG, Kang T, Bang JK, Park J, Kim W, et al. Association between metabolic syndrome and the presence of kidney stones in a screened population. Am J Kidney Dis. 2011;58(3):383.
11. DiBianco JM, Jarrett TW, Mufarrij P. Metabolic syndrome and nephrolithiasis risk: should the medical management of nephrolithiasis include the treatment of metabolic syndrome? Rev Urol. 2015;17(3):117–28. 12. Inci M, Demirtas A, Sarli B, Akinsal E, Baydilli N. Association between body
mass index, lipid profiles, and types of urinary stones. Ren Fail. 2012;34(9): 1140–3.
13. Sakhaee K. Nephrolithiasis as a systemic disorder. Curr Opin Nephrol Hypertens. 2008;17(3):304–9.
14. Das UN. Is obesity an inflammatory condition? Nutrition. 2001;17(11–12): 953–66.
15. Duparc T, Naslain D, Colom A, et al. Jejunum inflammation in obese and diabetic mice impairs enteric glucose detection and modifies nitric oxide release in the hypothalamus. Antioxid Redox Signal. 2011;14:415–23. 16. Hatch M, Cornelius J, Allison M, et al. Oxalobacter sp. reduces urinary
oxalate excretion by promoting enteric oxalate secretion. Kidney Int. 2006; 69:691–8.
17. Cohen AJ, Adamsky MA, Nottingham CU, Pruitt J, Lapin B, Wang CH, Park S. Impact of statin intake on kidney stone formation. Urology. 2018.https:// doi.org/10.1016/j.urology.2018.01.029.
18. Schmiedl A, Schwille PO, Bonucci E, Erben RG, Grayczyk A, Sharma V. Nephrocalcinosis and hyperlipidemia in rats fed a cholesterol- and fat-rich diet: association with hyperoxaluria, altered kidney and bone minerals, and renal tissue phospholipid-calcium interaction. Urol Res. 2000;28(6):404–15. 19. Sur RL, Masterson JH, Palazzi KL, L’Esperance JO, Auge BK. Impact of statins
on nephrolithiasis in hyperlipidemic patients: a 10-year review of an equal access health care system. Clin Nephrol. 2013;79(5):351–5.
20. Kang HW, Lee SK, Kim WT, Kim YJ, Yun SJ, Lee SC, Kim WJ.
Hypertriglyceridemia and low high-density lipoprotein cholesterolemia are associated with increased hazard for urolithiasis. J Endourol. 2014;28(8): 1001–5.
21. Hoofnagle AN, Vaisar T, Mitra P, Chait A. HDL lipids and insulin resistance. Curr Diab Rep. 2010;10(1):78–86.